Observation of cooperatively enhanced atomic dipole forces from NV centers in optically trapped nanodiamonds
Since the early work by Ashkin in 1970 Ashkin86 , optical trapping has become one of the most powerful tools for manipulating small particles, such as micron sized beads Neuman04 or single atoms Schlosser2001 . The optical trapping mechanism is based on the interaction energy of a dipole and the electric field of the laser light. In atom trapping, the dominant contribution typically comes from the allowed optical transition closest to the laser wavelength, whereas for mesoscopic particles it is given by the bulk polarizability of the material. These two different regimes of optical trapping have coexisted for decades without any direct link, resulting in two very different contexts of applications: one being the trapping of small objects mainly in biological settings Grier03 , the other one being dipole traps for individual neutral atoms Grimm2000 in the field of quantum optics. Here we show that for nanoscale diamond crystals containing artificial atoms, so-called nitrogen vacancy (NV) color centers, both regimes of optical trapping can be observed at the same time even in a noisy liquid environment. For wavelengths in the vicinity of the zero-phonon line transition of the color centers, we observe a significant modification () of the overall trapping strength. Most remarkably, our experimental findings suggest that owing to the large number of artificial atoms, collective effects greatly contribute to the observed trapping strength modification. Our approach adds the powerful atomic-physics toolbox to the field of nano-manipulation.
Whenever a polarizable particle is exposed to light, the electromagnetic field induces an optical dipole moment which in turn leads to an interaction energy that scales with the field intensity. This interaction energy results in optical forces that ultimately allow for spatial manipulation of the particle. Using a semi-classical approach the optical forces can be derived as Grynberg2010 :
| (1) |
where the polarizability of the particle has been split into real and imaginary parts , is the dielectric permittivity of vacuum, and the incident time-averaged field amplitude and phase are and , respectively. The real part of the polarizability gives rise to the so-called dipole force associated with a conservative trapping potential. In contrast, the imaginary part of leads to dissipative resonant scattering forces proportional to the gradient of the phase of the field. Due to its dissipative nature, the resonant scattering force plays a key role in atom cooling Grynberg2010 . In the context of this work, we can neglect the resonant scattering term by utilizing a Gaussian standing wave (GSW) trap Zemanek1999 .
For an isotropic and homogeneous object, the polarizability is directly related to the refractive index of the material and is typically a slowly varying function of wavelength. Conversely, in the case of a two-level quantum system (e.g. a single atom in free space) the dipole force exhibits a strong dependence on the trapping wavelength through the resonant nature of the polarizability. In particular, it changes sign at the transition frequency, , and becomes repulsive for blue detunings (). Experiments on ultracold neutral atoms routinely exploit this strong detuning dependence for creating complex potential landscapes Grimm2000 . In the following, we report on the observation of near-resonant optical forces from an ensemble of artificial atoms embedded in a nanocrystal.
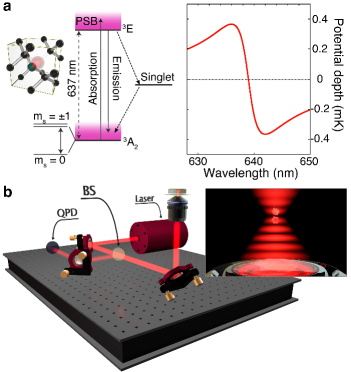
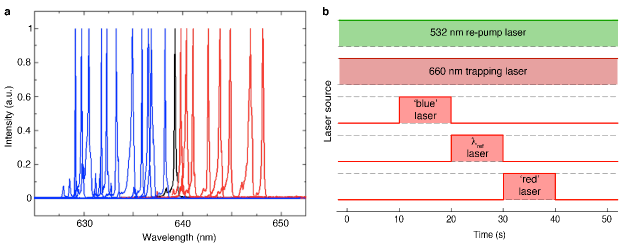
Nanodiamonds (NDs) containing color centers are excellent candidate nanoparticles for observing atom-like trapping resonances. The color centers act like artificial atoms exhibiting sharp optical transitions. In particular, the nitrogen-vacancy center (NV), consisting of a nitrogen atom and an adjacent vacancy site (see Figure 1a left), has attracted a lot of interest over the past decade. In its most stable form, the negatively charged NV-, it exhibits outstanding spin-optical properties which persist even up to room-temperature Doherty2013 . Consequently, the NV- has proven to be highly suitable as a solid-state spin qubit Jelezko2004b and nanoscale magnetic sensor Balasubramanian2008 ; Maze2008 . Here we are mainly interested in its optical properties. The NV- displays stable single-photon emission Brouri2000 ; Kurtsiefer2000 with a sharp zero-phonon line (ZPL) in bulk at 637 nm followed by well-defined vibronic side bands Davies1976 . At room temperature, most photons are emitted into these sidebands and only a fraction into the ZPL (typically Faraon2011 ). Note that, mainly due to strain, the ZPL position in NDs can shift considerably. In our experiment, we measured the average ZPL to be 639 nm. Due to their strong and stable fluorescence, NV- centres hosted in nanodiamonds have been used as biolabels for high-resolution, real-time and low-disruption imaging of living cells McGuinness2011 and as carriers for drugs and biomolecules Alhaddad2011 . Previous investigations on liquid trapping Horowitz2012 ; Geiselmann2013 and levitating NDs Neukirch2013 used laser light at 1064 nm which is far away from the ZPL at 637 nm. None of these experiments reported any effects due to the presence of the NV- centers on the external degrees of freedom of the nanodiamond in the optical trap.
In our experiment, we create a GSW trap near 639 nm by focussing a Gaussian laser beam on a silver-coated mirror. The GSW provides a stronger trap along the direction of the standing wave compared a to conventional focused Gaussian beam, and allows one to neglect scattering forces. The mirror forms the top of a static micro-fluidic chamber that contains the NDs suspended in deionized water (see Figure 1b). The laser sources are a set of temperature-stabilized laser diodes operating at different wavelengths detuned with respect to 639 nm (see Materials and Methods). In addition, a pulsed green laser (532 nm) serves as a weak re-pump to counteract resonant ionization to the neutral NV0 state Aslam2013 . The trap depth itself is hard to measure directly in optical tweezers in liquid. Instead, by measuring the corner frequency Neuman04 (see Materials and Methods), we obtain the trap stiffness, , which corresponds to the second derivative of the trapping potential. The nanodiamonds are in the strongly overdamped regime and their displacement from the trap center is small compared to the beam waist. As a result, the particles mainly probe the harmonic part of the potential near the trap minimum Gieseler2013 . In order to obtain the stiffness experimentally, the position of the trapped particle is recorded using a quadrant photodiode. The stiffness can then be obtained from a Lorentzian fit of the power spectrum density of the signal Neuman04 (see Materials and Methods). Due to its dependence on the exact size of the trapped ND, is not a good observable when comparing the results obtained for different NDs. In order to circumvent this problem, we extract a relative value for normalized to the measured trapping stiffness at a reference wavelength ( nm) for each ND separately (see Materials and Methods).
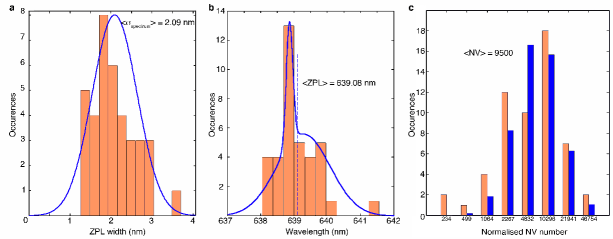
In order to obtain a significant resonant trapping effect, we use NDs with a high concentration of NV- centers Fu2007 . We first characterized the NDs using a home-built combined confocal/AFM microscope setup Bradac2009 . The investigated NV- centers show a ZPL centered at nm with an average spectral width of nm (see Extended Data Fig. 1). The ZPL width of individual nanodiamonds is a convolution of a Gaussian and a Lorentzian distributions (Voigt profile). Assuming a dephasing rate at room temperature of approximately THz Fu2009 , we extracted the width of the underlying Gaussian distribution due to the variation of NV ZPL frequency within a ND to be . We also measured the size distribution of the nanocrystals in liquid using dynamic light scattering and found an average size of nm. The expected average number of NVs per ND is Fu2007 . A sample of NDs with a similar size, nm, but with a much lower concentration of NV centers was used as a reference.
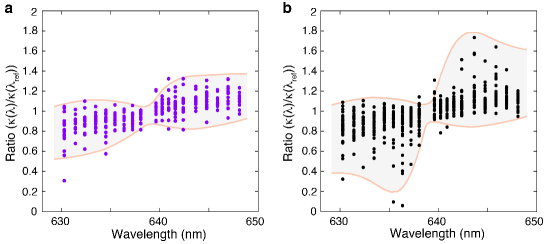
To characterize the contribution of the NVs to the trap stiffness, we measured the corner frequency on a number of different NDs for a given set of wavelengths for the two ND samples (low and high NV center concentration). We then extracted the trap stiffness for each ND separately and applied a statistical analysis in order to systematically discard unwanted events such as the trapping of multiple NDs or standing wave hopping (see Supplementary Material). The resulting trap stiffness ratios as a function of laser wavelength for the reference NDs are displayed in Figure 2a. This measurement serves as a reference as we do not expect the resonant trapping forces to have a measurable effect for this sample. The monotonic trend is attributed to chromatic aberrations which are aggravated by the standing wave trap. In contrast, Figure 2b displays the results for the ND sample with high NV- density. As in the case of the reference sample, the underlying monotonic trend is clearly visible. However, the high density data clearly shows a strongly asymmetrical distribution with -ratio values much lower than 1 for wavelengths below and values larger than 1 for wavelengths larger than . The extreme values are attributed to NDs with larger number of NV centers leading to a significant contribution of the NVs to the trap stiffness.
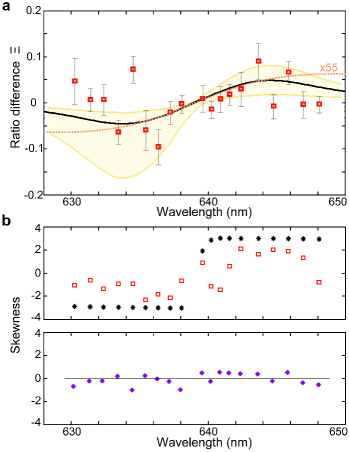
Next, we extract the mean value from both data sets and plot the difference of the mean values as a function of wavelength (Figure 3a). Due to the choice of reference wavelength, this difference of mean values gives access to the ratio of the stiffness arising from the NV ensemble to the stiffness from the bare ND matrix (see Supplementary Material). The dispersive trend is clearly visible, corresponding to a stiffness ratio lower than 1 at wavelengths below the ZPL and larger than 1 for wavelengths above, with a magnitude of up to 10. Most remarkably, these experimental results cannot be accounted for only by assuming independent NVs: The dashed line in Figure 3a displays the expected trap stiffness from a calculation that assumes independent NV centers and takes the average values for the ZPL width, ZPL position and number of NV centers per ND. Note that the curve has been magnified by 55 times for plotting. Clearly, assuming the NV centers to act independently does not reproduce our experimental findings. Besides the magnitude being off by almost two orders of magnitude, the shape of the curve also does not match the observations. In order to fully capture the experimental results, we therefore have to consider collective effects Dicke1958 between the NV centers within a single nanocrystal.
Cooperative effects between NV centers have a significant impact on the dipole forces by increasing the spontaneous decay rate and modifying the steady state population. The presence of collective effects in our high NV density NDs was independently confirmed through a set of scattering experiments where sub-nanosecond cooperative decay rates were observed Bradac2015 . Due to the large variation in ZPL position in a single ND, only sub-domains of NVs within narrow frequency windows are expected to act collectively. To model the collective forces, we applied the Dicke model Gross1982 to each sub-domain. In this context, the NVs contained in the sub-domain can be represented as a superposition of spin 1/2 states. The collective force can then be obtained by solving the Liouville equations for the collective spin operator where and are the excited and ground state of NV number respectively. In this simplified model, the single-spin dephasing rate is given by the spontaneous decay rate of the NV, and we used a collective spin dephasing rate at room temperature of Fu2009 (see Supplementary Material). The collective force calculated for our particular ND sample is presented in Figure 3a as the solid black line along with the experimental data points. The variability of the NV density was reproduced using a Monte Carlo approach, providing a confidence interval within which of the experimental values should fall (shaded area in Fig. 3a). The number of sub-domains, and consequently their frequency width, has been used as the only adjustable parameter in our model and provides a number for NVs acting collectively. The measurements were best reproduced using a sub-domain size of approximately 100 GHz corresponding to an average domain size of 95 NV centers, or 1 of the total average number of centers (see Supplementary Material). Comparing with the force obtained for independent NVs, the overall impact of the collective effects is clearly apparent. We estimate an enhancement of the trap stiffness of around a factor 50, demonstrating the importance of collective effects in our analysis. In parallel to the average trap stiffness, we also modelled the expected skewness of the experimental data points (Fig. 3b upper panel). Our model gives a good quantitative agreement with the skewness obtained from the experiment. As the model does not include any type of experimental noise, the skewness is consequently slightly over-estimated. For comparison, the skewness of the experimental data obtained for the reference ND sample is presented in the lower panel of Fig. 3b.
In conclusion, our observations open the door to a wealth of new research directions. The collective effects arising from the high number of NV centers in an individual nanocrystal provide a mechanism to significantly increase the optical forces. While our simplified model is in good agreement with the experiment, a more complete description accounting for dipole-dipole interactions Gross1982 constitutes an interesting future research direction. In addition, the observed change in trapping stiffness could be further increased by using defects such as silicon-vacancy centers which are characterized by higher densities Vlasov2014 and stronger transition dipole moment Rogers2014 ; Sipahigil2014 . These centers could offer the opportunity to access a regime in which the resonant trapping forces dominate the dynamics of the system, with the nanocrystal essentially behaving like a very large atom, or superatom. In the context of quantum opto-mechanics, this could allow for single-photon strong coupling and side-band cooling at room temperature juan2015 . With all these exciting possibilities at hand, this work opens the door to applying the powerful quantum technologies developed for atom trapping and cooling to the manipulation of small nanoparticles introducing an unprecedented degree of control at the nanoscale.
Acknowledgments
We thank O. Romero-Isart for useful discussions. This work was funded by the Australian Research Council Centre of Excellence for Engineered Quantum Systems (EQuS) CE 110001013. G.M.-T. acknowledges funding by the Australian Research Council Future Fellowship program. Comments or requests for materials should be addressed to mathieu.juan@mq.edu.au or thomas.volz@mq.edu.au.
Materials and Methods
Nanodiamond (ND) Sample
The two nanodiamond samples used in this work are synthetic type Ib diamond powders with a nitrogen concentration of 300 ppm, i.e. nitrogen atoms per m3 (MSY 0.1 m; Microdiamant). This ND powder was only chemically and mechanically processed to remove the sp2 carbon-phase in excess Bradac2009 . The NDs with no additional treatment were used as reference (low NV centers concentration) in the control experiment to determine the effect of chromatic aberrations in the standing wave trap. For high NV centers concentration, the ND powder was further treated to increase the concentration of NV centres (Academia Sinica, Taipei Taiwan) as follows: the nanodiamonds were purified by nitration in concentrated sulphuric and nitric acid (H2SO4-HNO3), rinsed in deionized water, irradiated by a 3-MeV proton beam at a dose of ions per cm2 and annealed in vacuum at 700 degrees Celsius for 2 hours to induce the formation of NV centres Fu2007 . Prior to the trapping experiment, both nanodiamond samples were characterized by means of a lab-built confocal scanning fluorescence microscope (100x oil immersion objective UplanFL N, NA 1.3; Olympus) excited with a 532-nm CW diode-pumped solid-state laser (Compass 315-M100; Coherent Scientific) and combined with a commercial atomic force microscope (Ntegra; NT-MDT) Bradac2009 . For characterization, the diamond nanocrystals were dispersed on 170-m thick BK7 glass coverslips (BB022022A1; Menzel-Glaser) which were previously sonicated and rinsed in acetone (C3H6O, purity 99.5%; Sigma-Aldrich) for 10 min. The measured average size of the nanodiamonds is (150.5 23.3) nm, determined by atomic force microscopy and confirmed by dynamic light scattering analysis (Zetasizer Nano-ZS; Malvern Instruments). The spectral interrogation of the NDs to identify emission from NV- centres was performed via a commercial spectrometer (Acton 2500i, Camera Pixis100 model 7515-0001; Princeton Instruments). While for the untreated sample the concentration of NV centres is extremely low (at most a few NVs per nanocrystals), for the irradiated one we estimate NV centres per nanodiamond. This was determined by correlating, for nanocrystals of different sizes, the average fluorescence intensity measured for each ND with its volume, and comparing this ratio with the one given by the sample provider Fu2007 .
Trapping Setup
For the trapping experiment, the suspension of nanodiamonds in deionized water was inserted in a microfluidic chamber consisting of a BK7 glass coverslip (BB022022A1; Menzel-Glaser) and a protected silver mirror (PF10-03-P01; Thorlabs) using double sided tape for sealing (50 mm 50 m, 0.14 mm-thick; 3M). The experiment involves five diode lasers, four used for the optical trapping itself and one for the re-pumping from NV0 to NV-. The re-pump laser is a 532-nm pulsed laser (LDH-P-FA-530B; PicoQuant) used at 40 MHz repetition rate with an average output power at the sample of 30 W. The four other lasers are temperature-stabilized laser diodes combined through the same fibre to ensure that the focal spots of the different diodes are superimposed perfectly in lateral direction. One of these diodes is used to provide a stable conventional trap for the ND at a wavelength of 660 nm with 6 mW of power (660 nm/130 mW; Oclaro) in order to maintain the ND trapped during the measurement. The three remaining diodes provide the reference wavelength (), the blue and the red wavelengths with 4 mW of power. The choice of diodes (Oclaro 633 nm/110 mW, Oclaro 637 nm/170 mW, Mitsubishi 638 nm/150 mW and Oclaro 642 nm/150 mW) provides an overall covered spectral range of 629-648 nm (see Extended Data Fig. 2a). The laser beams are switched using home-built electromechanical shutters controlled with a data acquisition system (NI-PCI 6289; National Instrument) in order to provide 50-s continuous time trace composed of 10-s segments with different wavelengths (see Extended Data Fig. 2b). The trapping beam at the output of the fiber is polarized using a Glan-Laser calcite polarizer (GL10-A; Thorlabs) and then focused into the chamber through a water-immersion objective (UPLSAPO 60XW, NA 1.2; Olympus) with a measured waist at 640 nm of =470 nm. The position of the objective is set such that the reference laser diode (639.13 nm) is focussed on the mirror forming the top surface of the microfluidic chamber. Finally, the wavelength for the reference laser was chosen very close to the measured average NV ZPL position of 639.08 nm (see Extended Data Fig. 1b).
Stiffness measurement
Using a quadrant photodiode, the position of the ND is tracked over time. A Fourier transform of the signal yields the corresponding power spectral density (PSD) in reciprocal space. From a Lorentzian fit to the PSD Neuman04 , the corner frequency is extracted which can be directly related to the trap stiffness through , where is the drag coefficient of the ND. In the experiment, we measure as a function of wavelength in the vicinity of the ZPL of the NV-. The drag coefficient is a function of the viscosity of the medium, the ND size and its distance to the surface Neuman04 . Consequently, referencing every measurement to a reference wavelength allows direct access to the ratio of the stiffnesses without explicit knowledge of the drag coefficient. In addition, we subtracted to each measurements (+660-nm, +660-nm or +660-nm) the corner frequency obtained for the 660-nm laser in order to access the stiffness ratio for , or (see Supplementary Information).
References
- (1) Ashkin, A., Dziedzic, J. M., Bjorkholm, J. E., & Chu, S. Observation of a single-beam gradient force optical trap for dielectric particles. Opt. Lett. 11 288-290 (1986).
- (2) Neuman, K. C., & Block, S. M. Optical trapping. Review of Scientific Instruments 75, 2787 (2004)
- (3) Schlosser, N., Reymond, G., Protensko, I., & Grangier, P. Sub-Poissonian loading of single atoms in a microscopic dipole trap. Nature 411 1024-1027 (2001).
- (4) Grier, D. G. A revolution in optical manipulation Nature 424, 810-816 (2003)
- (5) Grimm, R., Weidemüller, M., & Ovchinnikov, Y. B. Optical dipole traps for neutral atoms Advances in Atomic, Molecular and Optical Physics 42 95-170 (2000).
- (6) Grynberg, G., Aspect, A., and Fabre, C. Introduction to Quantum Optics From the Semi-classical Approach to Quantized Light Cambridge University Press, Cambridge (UK).
- (7) Zemánek, P., Jonáš, A., Šrámek, L., & Liška, M. Optical trapping of nanoparticles and microparticles by a Gaussian standing wave. Opt. Lett. 24, 1448-1450 (1999).
- (8) Doherty, M. W. et al. The nitrogen-vacancy colour centre in diamond. Physics Reports 528 1-45 (2013).
- (9) Jelezko, F., Gaebel, T., Popa, I., Gruber, A., & Wrachtrup, J. Observation of Coherent Oscillations in a Single Electron Spin. Phys. Rev. Lett. 92, 076401 (2004).
- (10) G. Balasubramanian, at al. Nanoscale imaging magnetometry with diamond spins under ambient conditions. Nature 455, 648-651 (2008).
- (11) Maze, J. R. et al. Nanoscale magnetic sensing with an individual electronic spin in diamond. Nature 455, 644-647 (2008).
- (12) Brouri, R. et al. Photon antibunching in the fluorescence of individual color centers in diamond. Opt. Lett. 25, 1294-1296 (2000).
- (13) Kurtsiefer, C. et al. Stable solid-state source of single photons. Phys. Rev. Lett. 85, 290-293 (2000).
- (14) Davies, G., & Hamer, M. F. Optical Studies of the 1.945 eV Vibronic Band in Diamond. Proceedings of the Royal Society of London. Series A, Mathematical and Physical Sciences 348, 285-298 (1976).
- (15) Faraon, A., Barclay, P. E., Santori, C., Fu, K.-M. C., & Beausoleil, R. G. Resonant enhancement of the zero-phonon emission from a colour centre in a diamond cavity Nat. Phot. 5, 301 (2011).
- (16) McGuinness, L. P. et al. Quantum measurement and orientation tracking of fluorescent nanodiamonds inside living cells. Nat. Nano. 6 358-363 (2011).
- (17) Alhaddad, A. et al. Nanodiamond as a Vector for siRNA Delivery to Ewing Sarcoma Cells. Small 7 3087-3095 (2011).
- (18) Horowitz, V. R., Alemán, B. J., Christle, D. J., Cleland, A. N., & Awschalom, D. D. Electron spin resonance of nitrogen-vacancy centers in optically trapped nanodiamonds. PNAS 109 13493-13497 (2012).
- (19) Geiselmann, M. et al. Three-dimensional optical manipulation of a single electron spin. Nat. Nano. 8, 175-179 (2013).
- (20) Neukirch, L. P., Gieseler, J., Quidant, R., Novotny, L., & Vamivakas, A. N. Observation of nitrogen vacancy photoluminescence from an optically levitated nanodiamond. Opt. Lett. 38 2976-2979 (2013).
- (21) Aslam, N., Waldherr, G., Neumann, P., Jelezko, F., & Wrachtrup, J. Photo-induced ionization dynamics of the nitrogen vacancy defect in diamond investigated by single-shot charge state detection. New J. Phys. 15 013064 (2013).
- (22) Gieseler, J., Novotny. L., & Quidant, R. Thermal nonlinearities in a nanomechanical oscillator. Nat. Phys. 9 806-810 (2013).
- (23) Fu, C. C. et al. Characterization and application of single fluorescent nanodiamonds as cellular biomarkers. PNAS 104 727-732 (2007).
- (24) Bradac, C., Gaebel, T., Naidoo, N., Rabeau, J. R., & Barnard, A. S. Prediction and Measurement of the Size-Dependent Stability of Fluorescence in Diamond over the Entire Nanoscale. Nano Lett. 9 3555-3564 (2009).
- (25) Fu, K.-M. C. et al. Observation of the Dynamic Jahn-Teller Effect in the Excited States of Nitrogen-Vacancy Centers in Diamond. Phys. Rev. Lett. 103 265404 (2009).
- (26) Dicke, R. Coherence in Spontaneous Radiation Processes. Phys. Rev. 93, 99 (1958).
- (27) Bradac, C. et al. Observation of room-temperature cooperative emission from diamond nanocrystals with large numbers of nitrogen vacancy centers in preparation
- (28) Gross, M, & Harroche, S. Superradiance: an essay on the theory of collective spontaneous emission. Physics Reports 93, 301-396 (1982).
- (29) Vlasov, I. I. et al. Molecular-sized fluorescent nanodiamonds. Nat. Nano. 9 54-58 (2014).
- (30) Rogers, L. J. et al. Electronic structure of the negatively charged silicon-vacancy center in diamond. Phys. Rev. B 89 235101 (2014).
- (31) Sipahigil, A. et al. Indistinguishable Photons from Separated Silicon-Vacancy Centers in Diamond. Phys. Rev. Lett. 113 113602 (2014).
- (32) Juan, M.L., Molina-Terriza, G., Volz, T., & Romero-Isart, O. Near-field Levitated Quantum Optomechanics with Nanodiamonds: Strong Single-Photon Coupling at Room Temperature arxiv: 1505.03363 (2015).
Supplemental Materials: Observation of cooperatively enhanced atomic dipole forces from NV centers in optically trapped nanodiamonds
Data acquisition and treatment
.0.1 Data acquisition and sequencing
The data was obtained from an acquisition time trace of 50 s overall duration. The timing sequence for applying the different trapping lasers during these 50 s is displayed in the Extended Data Fig. 2. The time trace is partitioned in equal segments of 10 seconds, and the corner frequency during these 10 seconds is obtained from the power spectral density of each individual segment. During the first and last 10 s of acquisition, only the 660-nm laser is on corresponding to the corner frequency . During each of the other 10 s intervals, the 660-nm laser is on plus one of the three following lasers at a time: the “blue” laser with (giving the corner frequency ), the reference laser with (), and the “red” laser with (). Since the 660-nm laser is far detuned from the resonance the dipole force from the NV transition with this laser can be neglected. This point stands when using both the 660-nm laser and a laser closer to the NV transition (e.g. “red” laser): the dipole force from the NV due to the “red” laser does not depend on the 660-nm laser (for moderate power as such used in this work). Within the harmonic approximation, the overall corner frequency with two lasers on simultaneously (e.g. the 660-nm laser and the laser with ) can thus be written as: with the drag coefficient of the particular nanodiamond. The observables of interest, and , are therefore determined by
| (S1) |
Normalizing the corner frequencies this way gives access to the trapping stiffness ratios without requiring knowledge of the actual size of the trapped NDs. In addition, the normalization avoids the dependence of the trapping stiffness on the volume. Hence, the normalized ratios can directly be compared for different NDs.
.0.2 Data treatment
As explained previously, the first and last 10 s of the acquisition are necessary to extract the effect of the 660-nm trapping laser only. In addition, we compared the corner frequency for these two segments with the 660-nm trapping laser to identify anomalous events during the whole 50 s data acquisition. As a boundary condition for discarding anomalous time traces, we imposed a relative change in corner frequency smaller than between the two segments. Based on this -rule, we typically removed of the data. The main cause for a dramatic change in 660-nm corner frequency at the beginning and end of the 50 s acquisition period would most likely be a second ND hopping into the trap due to the relatively high concentration of NDs in the solution.
The 10% selection rule was applied before calculating the trapping stiffness ratios and allowed us to discard clearly anomalous time traces. In addition, we also used a Local Outlier Factor (LOF) method SMBreunig2000 to remove clear statistical outliers from the data. This method is based on calculating the local density of neighbors for each data point. Within the LOF method, (local) outliers are identified by their large LOF value. We rejected data points having a LOF larger than 5.7 using a LOF calculation based on the 6th-nearest neighbor. The same parameters were used for all the data and ultimately removed 3.4% of the remaining data points. We verified that this method would not impact the effect we wanted to underline. To do so, we used a Monte Carlo simulation to numerically reproduce the experiment accounting only for the variability of the ND properties (number of NVs, average ZPL transition and ZPL standard deviation). Applying the very same LOF selection rule to the numerical results only removed an average of 0.6% of the numerical data points. This confirms that even with the large variability in the NV density, the outlier method only marginally impacts the data.
Calculating the dipole force for an ensemble of NVs
.0.3 Dipole force on a 2-level system
For a simple 2-level system with a dipole moment and transition in the presence of dephasing () in an electric field with amplitude , the optical dipole potential can be written as SMGrynberg2010 :
| (S2) |
where is the saturation parameter and the Rabi frequency. Here the prefactor comes from the time average of the electric field () and the orientational average of the dipole moment ().
.0.4 NV center and phonon sidebands
NV centers constitute good quantum emitters, yet their level structure is quite different from the ideal 2-level system usually considered in calculating the dipole forces. In particular, the large phonon sideband (PSB) needs to be taken into account when estimating the dipolar moment. From the spontaneous rate emission in vacuum of NVs, , at the transition frequency , the overall dipolar moment can be determined via the Fermi Golden rule as . Here is the vacuum permittivity, the speed of light and with the refractive index of diamond and the spontaneous rate emission of NVs in nanodiamonds SMInam2011 . Decomposiing the PSB in 7 distinct bands following SMAlbrecht2013 , the spontaneous rate emission can be written as with the zero phonon line (ZPL) spontaneous rate emission and the sum on the phonon sidebands SMAlbrecht2013 . When studying the forces around the ZPL at , the different sidebands () are far detuned enough to be ignored (min nm). As a consequence, we used for the dipole moment:
| (S3) |
Consequently, due to the phonon sidebands the dipole moment is effectively reduced. Also we used a branching ratio, or Debye-Waller factor, of 0.04 SMSiyushev2009 ; Faraon2011 .
In addition to reducing the dipole moment, we also took into account the sidebands calculating the dipole force. We made the following approximations in order to maintain a simplified and analytical approach: (i) the different sidebands have been accounted for as one extra channel with a decay rate going as the sum of the various bands, , (ii) the non-radiative phonon decay rate is assumed to be similar for all bands and equal to SMHuxter2013 , and (iii) the sidebands cannot be efficiently coherently driven due their very large dephasing () and large detuning from the laser resonant with the ZPL. Under these approximations, the relevant terms from the optical Bloch equation can be explicitly written as:
| (S4) | |||||
where , and are the ground state, the excited state and the phonon sideband respectively, is the Rabi frequency and the laser detuning from the transition . The density matrix element is the element in the rotating frame, . The decay rate from the excited state to the phonon sideband is , from the excited state to the ground state is , and from the phonon sideband to the ground state is . At room temperature, the total linedwith of the NV is much larger than the lifetime limited linewidth. This linewidth (or transverse decay rate) is , where accounts for additional coherence decay (inhomogeneous broadening). The value typically observed at room temperature is THz SMFu2009 .
In the Heisenberg-picture, the time averaged value of the dipole force can then be written as:
| (S5) |
where is the steady state coherence as obtained by solving the steady state optical Bloch equation for , and is the complex conjugate of . The force can then be explicitly written as:
| (S6) |
with and the saturation parameter . The impact of the phonon sidebands contained in the factor is clearly negligible if the phonon decay rate (phonon sideband ground) is the fastest decay. Intuitively, when this decay is fast the phonon sidebands are never populated (i.e. ) and the system behaves as a typical two-level system obtained for . Conversely, if this decay is slow enough to maintain population in the phonon sidebands both the saturation parameter and the force are impacted. In terms of optical potential one obtains:
| (S7) |
Trapping stiffness
The fitting of the experimental data is done on the trapping stiffness rather than the optical potential depth. For this reason, the position dependence of the potential has to be given explicitly. Along the measurement direction , we approximated the electromagnetic field to a Gaussian profile , with the field amplitude . Here the waist of the focus is defined by (=470 nm, measured at 640 nm), the incident power by and the refractive index of the medium (water) by .
The optical potential for the force acting on the nanodiamond dielectric matrix is then given by SMHarada1995 :
| (S8) |
where is the refractive index of diamond () relative to the medium (water, ). Similarly, the optical potential acting on the NV center can be explicitly given by:
| (S9) |
For the sake of simplicity, in the following we refer to the first potential (force) as the “classical” potential (force) and to the second one as “quantum” potential (force).
In the overdamped regime, the variance in the position of the trapped ND can be obtained through the equipartition theorem , with being the drag coefficient of the ND. This variance is estimated to be around nm for a nm ND and an average corner frequency of Hz. Such a small displacement allows neglecting any anharmonic effects such as for example a Duffing non-linearity SMGieseler2013 . In this case the optical potential seen by the ND can then be well approximated by a simple harmonic potential of the form where is related to the potential through . For the simple case of a nanodiamond containing identical NVs with transition frequencies , the two components of the stiffness can thus be written as:
| (S10) |
| (S11) |
with the saturation parameter taken at given by:
| (S12) |
Note that the waist of the Gaussian beam, , is also a (monotonic) function of wavelength.
Cooperative effects
When calculating the dipole force from an ensemble of NVs such as the one present in the nanodiamonds used in the experiment, this force is much smaller than the one observed experimentally. Due to the unusually high density of NVs in these samples, it is necessary to account for cooperative effects in order to fully capture the dipole force from the NV ensemble. In addition, the small size of the nanodiamonds ( nm) allows for a simple description without finite size effects. Consequently, we used a simple model based on the Dicke model SMGross1982 .
Due to the dephazing and the slightly different transition frequency of each NV center, only sub-populations of NVs are expected to act cooperatively. This amounts to “coarse-grain” the ensemble of NV centers into cooperative sub-ensembles. Within one such sub-ensemble containing NVs, we assume the system to be invariant under permutation in order to apply the Dicke model. In this context, the state space in each sub-domain is spanned by Dicke states with . The maximal angular momentum space is appropriate because the spin begin in the ground state . We also assume that the PSB does not impact the excited and ground populations (i.e. ). The raising and lowering operators for the NV defect are defined respectively as:
| (S13) |
end the diagonal operator as:
| (S14) |
For notational clarity we suppress the sub-domain label on the collective spin operators but it is to be understood that the collective spin operators appearing in the equations to follow for the forces and stiffness ratios carry such an index.
Let us now consider one sub-domain containing NVs with a transition . Using the collective operators for the collective sub-domain , and , the symmetrical state can be obtained by repeated action of the lowering operator on the fully excited state:
| (S15) |
with .
This state represents the fully symmetrical collective state with atoms in the excited state and in the ground state . The Hilbert space dimension of this collective spin state is then .
We then consider this system to be driven by a laser at frequency according to the Hamiltonian given, in the the rotating wave approximation, by:
| (S16) |
where is the spin transition frequency and the Rabi frequency. The Louivillian describing the coupling of this system to the laser and the environment is then:
| (S17) | ||||
where the decay rate is the bare single spin decay rate, and is a collective dephasing rate. Since the observed inhomogeneous broadening of NV centers at room temperature has been attributed to phonon processes SMFu2009 , this dephasing mechanism is believed to act on the collective state as it will affect all spins indiscernibly. As a consequence, we used the spontaneous decay rate of the NVs, , as the single spin decay rate and inhomogeneous broadening, as the collective dephasing. In this context, the dipole force is given by:
| (S18) |
where is the expectation value of in the steady state of the collective spin state .
We can numerically compute the reactive force by finding the steady state of the collection of spins as follows. First we vectorize Eq. S17 by writing the density operator as a single vector of dimension : , which is done by stacking the rows of on top of one another (such that the state has a one in the first component and zeros otherwise). The dynamical equation is then
where the Louvillian in the vectorized basis is
| (S19) |
where is the unit vector of dimension . The steady state is contained in the null space of which for this case is one dimensional since the dynamical algebra is irreducible.
We also verified that the positional variance of the nano-diamond in the trap, , does not influence the steady-state population. Under the harmonic trap approximation, the stiffness along for the sub-domain can be obtained numerically as:
| (S20) |
Using this method, we calculated the total “quantum” stiffness as the sum of the stiffness from the different collective domains:
| (S21) |
As the size of the vectorized steady state is , the numerical solution of the steady state populations becomes difficult for large sub domain size. Consequently, we calculated the force obtained with and extrapolated the force for larger sub-domain using polynomial fits.
Note the collective dephasing preserves the total angular momentum because the environment that induces it has interactions which are permutation-symmetric. Local dephasing would couple the system out of this fixed angular momentum subspace, reducing the number of spins in the collective sate over time. In the context of this work focusing on the force, the steady state of the whole system constitute the most important aspect. The underlying assumption is that under continuous drive and in conjunction with local dephasing, the cooperative sub-domains will approach a steady state of fixed mean size. The size of these sub-domains was not determined theoretically, but rather used as the only fitting parameter to reproduce our experimental data.
To define the size of sub-domains, the distribution of NV transition frequencies within a given nanodiamond has been modelled as a normal distribution centered at with a standard deviation (see Extended Figure 1). The coarse-graining then consists in dividing this distribution in sub-ensembles of spectral width . Within each of these ensembles () the NVs are assumed to form a collective state with a transition frequency and a size defined as:
| (S22) | |||||
As the normal distribution of NVs in the nanodiamonds has a finite standard deviation , only the sub-ensembles such that are considered. Using this interval allows one to account for of the NV population, it is also then possible to define the number of sub-ensembles . It is the spectral width of these sub-domains, , or equivalently the number sub-domains , that we used as the sole fitting parameter used to reproduce our experimental data.
Stiffness ratio
In the harmonic approximation, the measurement at a given wavelength yields , where is the stiffness related to the NV centers and the stiffness related to the diamond matrix. By normalizing with the reference wavelength, we obtain the following ratio:
| (S23) |
In the case of the low NV-density NDs, the impact of the NVs on the total force force is neglected. The difference between the two ratios consequently gives:
| (S24) |
The choice of the reference wavelength at the average ZPL was such that the contribution of the NVs on the force is negligible (i.e. ). With this approximation, the difference of ratios between high and low NV-density NDs simply yields the ratio of the stiffness from the NV centers to the stiffness from the diamond matrix at :
| (S25) |
References
- (1) M. M. Breunig, H.-P. Kriegel, R. T. Ng, and J. Sander, LOF: identifying density-based local outliers, SIGMOD Rec. 29 93-104 (2000).
- (2) G. Grynberg, A. Aspect, and C. Fabre, Introduction to Quantum Optics From the Semi-classical Approach to Quantized Light Cambridge University Press, Cambridge (UK).
- (3) F. A. Inam, T. Gaebel, C. Bradac, L. Stewart, M. J. Withford, J. M. Dawes, J. R. Rabeau, and M. J. Steel, Modification of spontaneous emission from nanodiamond colour centres on a structured surface New J. Phys. 13, 073012 (2011).
- (4) P. Siyushev, V. Jacques, I. Aharonovich, F. Kaiser, T. Müller, L. Lombez, M. Atatüre, S. Castelletto, S. Prawer, F. Jelezko, and J Wrachtrup, Low-temperature optical characterization of a near-infrared single-photon emitter in nanodiamonds New J. Phys. 11, 113029 (2009).
- (5) A. Faraon, P. E. Barclay, C. Santori, K.-M. C. Fu, and R. G. Beausoleil, Resonant enhancement of the zero-phonon emission from a colour centre in a diamond cavity Nat. Phot. 5, 301 (2011).
- (6) R. Albrecht, A. Bommer, C. Deutsch, J. Reichel, and C. Becher, Coupling of a Single Nitrogen-Vacancy Center in Diamond to a Fiber-Based Microcavity Phys. Rev. Lett. 110, 243602 (2013).
- (7) V. M. Huxter, T. A. A. Oliver, D. Budker, and G. R. Fleming, Vibrational and electronic dynamics of nitrogen vacancy centres in diamond revealed by two-dimensional ultrafast spectroscopy, Nat. Phys. 9 744-749 (2013).
- (8) K.-M. C. Fu, et al., Observation of the Dynamic Jahn-Teller Effect in the Excited States of Nitrogen-Vacancy Centers in Diamond, Pys. Rev. Lett. 103 265404 (2009).
- (9) Y. Harada, and T. Asakura, Radiation forces on a dielectric sphere in the Rayleigh scattering regime. Optics Communications 124 529-541 (1995).
- (10) J. Gieseler, L. Novotny, and R. Quidant, Thermal nonlinearities in a nanomechanical oscillator, Nat. Phys. 9 806-810 (2013).
- (11) M. Gross and S. Haroche, Superradiance: an essay on the theory of collective spontaneous emission Physics Reports 93 301-396, (1982).