Is flux rope a necessary condition for the progenitor of coronal mass ejections?
Abstract
A magnetic flux rope structure is believed to exist in most coronal mass ejections (CMEs). However, it has been long debated whether the flux rope exists before eruption or is formed during eruption via magnetic reconnection. The controversy has been continuing because of our lack of routine measurements of the magnetic field in the pre-eruption structure, such as solar filaments. However, recently an indirect method was proposed to infer the magnetic field configuration based on the sign of helicity and the bearing direction of the filament barbs. In this paper, we apply this method to two erupting filament events, one on 2014 September 2 and the other on 2011 March 7, and find that the first filament is supported by a magnetic flux rope and the second filament is supported by a sheared arcade, i.e., the first one is an inverse-polarity filament and the second one is a normal-polarity filament. With the identification of the magnetic configurations in these two filaments, we stress that a flux rope is not a necessary condition for the pre-CME structure.
1 Introduction
Coronal mass ejections (CMEs) are the largest-scale and the most intense eruptions in the solar atmosphere. In each event, a bulk of plasma with mass up to – g is expelled out from the low corona to the interplanetary space (Webb & Howard, 2012). A CME is manifested in various wavebands of the electromagnetic spectrum (Gopalswamy et al., 1999), and the widely used observations are from white light. After observations for more than 40 years, the so-called 3-component structure has become the paradigm of CMEs, i.e., a bright frontal loop, an embedded bright core, and the cavity in between (Illing & Hundhausen, 1985). Calling such a composition the paradigm does not mean that all CMEs are seen to have all the 3 components, and in fact, many CMEs do not show all the components, mainly because of the projection effects. The 3-component structure is often explained in terms of an erupting magnetic flux rope, i.e., the piling-up plasma outside the flux rope forms the frontal loop, the expanding flux rope corresponds to the cavity with an erupting filament/prominence suspended at the magnetic dips of the flux rope (Forbes, 2000). Alternatively, the frontal loop and the expanding cavity are explained simultaneously to be due to successive stretching of the magnetic field lines overlying an erupting flux rope (Chen, 2009). Despite various possible models for the CME frontal loop and the cavity, it has been well established that the bright core of the CME corresponds to an erupting filament/prominence (House et al., 1981).
The bright core is sometimes observed to have a helical structure, implying the existence of a flux rope (Dere et al., 1999). After examining the Large Angle and Spectrometric Coronagraph (LASCO, Brueckner et al., 1995) observations from 1997 to 2010, Vourlidas et al. (2013) found that at least 40% of the CMEs have clear flux rope structures. They even suggested that flux ropes might be a common structure in CMEs. This is understandable since no matter a flux rope exists prior to the eruption or not, magnetic reconnection during the eruption as discussed in the standard CME/flare model (Chen, 2011; Shibata & Magara, 2011) would turn poloidal field into toroidal field, generating a helical magnetic field, i.e., a flux rope (Gosling, 1999). However, the ongoing debate is whether the flux rope detected during the eruption phase exists before eruption or is formed during eruption.
Among the proposed models of CME initiations, some assume that a flux rope exists before eruption (Low & Hundhausen, 1995). In particular, for those models related to kink or torus instabilities (Török & Kliem, 2003; Kliem & Török, 2006; Olmedo & Zhang, 2010), which are found by Démoulin & Aulanier (2010) to be equivalent to the catastrophe model (Forbes & Isenberg, 1991; Isenberg et al., 1993; Hu & Jiang, 2001; Lin & Soon, 2004; Wang et al., 2015), the presence of a flux rope is essential. There are some other models, which assume only a sheared arcade (Mikic & Linker, 1994; Antiochos et al., 1999) in their initial conditions. Note that a sheared arcade is not essential in these models, and can be replaced by a flux rope in principle. However, somehow such a difference between the indeliberately classified two types of models evolved into a debate on whether a flux rope is a necessary ingredient of the progenitor of a CME. As a result, a majority of observational papers tend to argue that a flux rope exists before eruption, either well before the eruption (Patsourakos et al., 2013; Yan et al., 2014; Filippov et al., 2015) or just prior to eruption (Cheng et al., 2014; Kumar & Cho, 2014). Very few observations supported the scenario of the formation of a flux rope during deruption (see Song et al., 2014, for an example). However, even based on a logic test, Chen (2011, 2012) proposed that flux ropes exist before eruption in some events and are formed via magnetic reconnection in other events. The reasoning is very straightforward: It has been well established that there are both inverse-polarity and normal-polarity filaments, which are typically described by the Kuperus-Raadu model (Kuperus & Raadu, 1974) and the Kippenhahn-Schlüter model (Kippenhahn & Schlüter, 1957), respectively. In the Kuperus-Raadu model, a flux rope does exist as also shown by Aulanier et al. (1999), whereas in the Kippenhahn-Schlüter model, the filament is supported by a sheared arcade. Considering that both types of filaments would erupt to form CMEs, it can be naturally inferred that in the latter case a flux rope, which might be identified in the extreme ultraviolet (EUV) images or coronagraph images during eruption, is formed presumably via magnetic reconnection during eruption.
Systematic measurements of the vector magnetic field in solar prominences were performed in 1980s (Leroy et al., 1984; Leroy, 1989; Bommier & Leroy, 1998), which revealed that typically higher prominences are mainly of the inverse-polarity type, and lower prominences are mainly of the normal-polarity type. However, despite that thousands of CMEs have been detected since 1996 thanks to the white-light observations from the LASCO coronagraph, we have little information about the magnetic field of the source filaments or prominences of these CMEs because of the lack of direct measurements of the magnetic field inside these prominences. Recently, an indirect method to infer the magnetic configuration of solar filaments was proposed by Chen et al. (2014).
Originally, it was believed that there is one-to-one correspondence between the chirality (hence helicity) of a filament and the bearing of the filament barbs, i.e., a filament with left-bearing barbs has positive helicity and a filament with right-bearing barbs has negative helicity (see Martin, 1998, for a review). Hereafter in this paper, this one-to-one correspondence is called the barb rule. However, Guo et al. (2010) found that along a filament with positive helicity, some barbs are left-bearing, and others are right-bearing. With nonlinear force-free magnetic extrapolations, they demonstrated that the filament segment following the barb rule is supported by a flux rope, whereas the filament segment against the barb rule is supported by a sheared arcade. Chen et al. (2014) proposed a more general paradigm, claiming that a filament following the barb rule is hosted by a flux rope, whereas a filament against the barb rule is hosted by a sheared arcade. Based on this paradigm, once we know the sign of helicity of a filament, e.g., via vector magnetograms, we can judge whether the filament is hosted by a flux rope or a sheared arcade by examining the bearing of the filament barbs in the H or EUV images.
In this paper, we select two examples of filament eruptions in order to illustrate that a flux rope is not necessarily the pre-requisite condition for a CME eruption, i.e., whereas some flux ropes exist prior to eruptions, some might be formed during CME eruptions via magnetic reconnection. This paper is organized as follows. The observations are presented in §2, the results are described in §3, which are discussed in §4.
2 Observations and Data Analysis
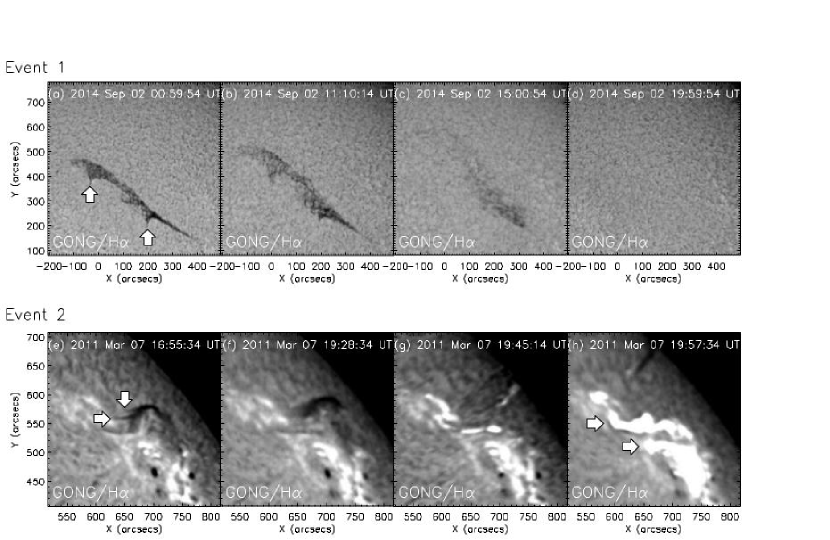
Both filaments under study are located in the northern hemisphere, and both are associated with a solar flare and a CME. The first event, event 1 hereafter, is a candidate filament with the inverse-polarity magnetic configuration, which erupts on 2014 September 2. As shown by the top panels of Figure 1, the filament is rather elongated, extending more than 600″ in the quiet region. Its eruption leads to a partial halo CME and a GOES C2.5-class flare. The corresponding Solar Object Locater is SOL2014-09-02T11:10:03L205C040. The second event, event 2 hereafter, is a candidate filament with the normal-polarity magnetic configuration, which erupts on 2011 March 7. As displayed by the bottom panels of Figure 1, this filament is located in the active region NOAA 11164, curving like an arch bridge along the magnetic polarity inversion line (PIL). It belongs to the active region type (Mackay et al., 2010). The eruption is accompanied by a GOES M3.7-class flare and a halo CME as well. The corresponding Solar Object Locater is SOL2011-03-07T19:00:01L193C050.
Both eruptions are well observed by the ground-based and space-borne telescopes. The evolution of the filaments is clearly monitored by the Global Oscillation Network Group (GONG) in H (Harvey et al., 2011), and is also observed in EUV images obtained by the Atmospheric Imaging Assembly (AIA, Lemen et al., 2012) aboard the Solar Dynamics Observatory (SDO). The Helioseismic and Magnetic Imager (HMI, Scherrer et al., 2012) aboard SDO provides the photospheric vector magnetograms below the erupting filament. The corresponding CMEs are registered by LASCO coronagraph on board the Solar and Heliospheric Observatory (SOHO) spacecraft. The SDO/AIA observes the full solar disk with a pixel size of and a time cadence of 12 s in three UV and seven EUV passbands. In this paper, we use the 193 Å and 304 Å passbands, in addition to the GONG/H images, to trace the evolution of the erupting filament events. For event 1, all the disk images are derotated to the universal time 00:00:00 UT on the day of eruption; for event 2, all the disk images are derotated to 21:30:00 UT on the day of eruption.
3 Results
3.1 Event 1
On 2014 September 2, a quiescent filament is situated across the central meridian in the northern hemisphere, appearing with an inverse-S shape. As shown in the top panels of Figure 1, two right-bearing barbs can be cleared identified at 00:59 UT well before the slowly ascending phase of the filament, as indicated by the white arrows. At 08:00 UT, the northern part of the elongated filament starts to rise slowly, and the southern part follows. The eruption is so slow that the rising filament is discernable in H for more than 7 hr. At 15:00 UT, a major part of the filament vanishes from the H image. As time goes on, the whole filament disappears. However, no clear flare ribbons are discernable in H.
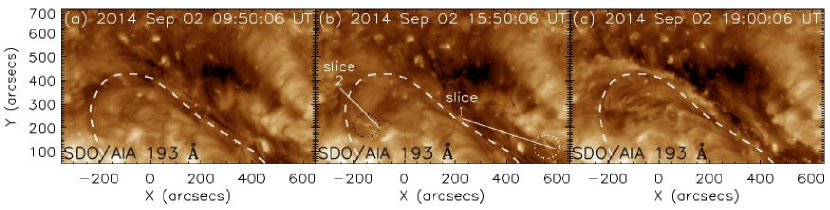
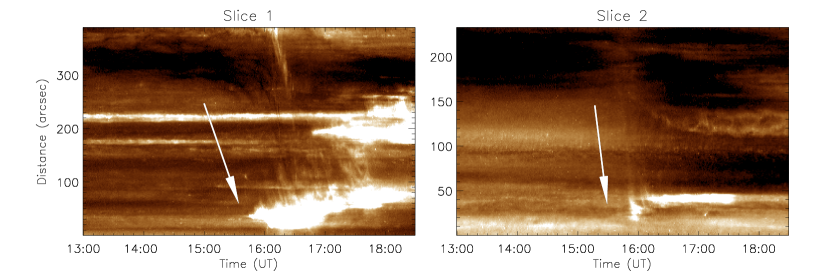
The activation of the filament is better seen from the high-resolution images of the SDO/AIA. The time sequence of the 193 Å images is displayed in Figure 2 and the associated animation. It is seen that as the filament starts to rise, its threads become more and more dynamic. As seen in many other erupting filaments, the ascending of the main body of the filament is accompanied by the drainage of the cool material near the two ends, presumably sliding along the embedded magnetic field lines. At the eastern end, the drainage plasma changes from absorption to emission. After moving along a curved trajectory in an anti-clockwise direction, the draining plasma impacts the base of the corona, forming a bright spot as indicated by the black circle in Figure 2(b). Almost simultaneously, a big bundle of plasma is seen to fall down near the western end of the filament and hits the coronal base, forming a narrow band of brightening as indicated by the white circle in Figure 2(b). In order to see the draining motions clearly, we select two slices near the two ends of the filament respectively, which are marked by the white solid lines in Figure 2(b). The time-slice diagrams of the AIA 193 Å intensity are depicted in Figure 3, where the start points of the two slices are at the western end in both cases. The draining motion of the filament is indicated by the white arrows. It is seen that near the two ends of the filament, plasma drains down and then impacts the solar surface, forming brightenings. It is also noticed that the draining plasma is already heated before the impact, as revealed by the bright threads in Figure 3. By comparing the line connecting the two conjugate drainage sites with the magnetic PIL (dotted line) in Figure 2, it is found that the drainage sites are left-skewed according to the definition in Chen et al. (2014).
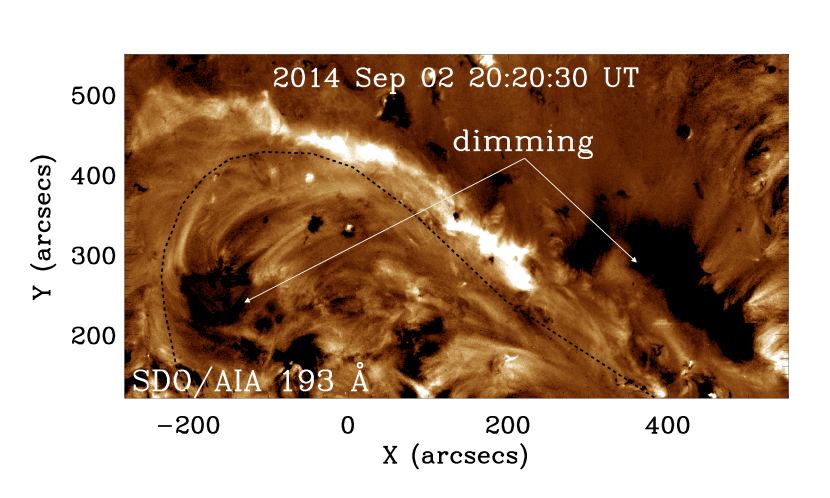
As the filament erupts, both the embedded and the overlying magnetic fields are expected to expand as well, forming twin dimmings near the source region (Sterling & Hudson, 1997; Harrison et al., 2003). Figure 4 displays the SDO/AIA 193 Å base-difference image at 20:20:30 UT, which is subtracted with the pre-eruption image at 11:40:06 UT. A pair of dimmings is seen to be located on the two sides of the magnetic PIL. It is obvious that the twin dimmings are left-skewed compared to the magnetic PIL. It is noted that flaring loops are visible in the 193 Å image in Figure 4, though the northern flare ribbon is much brighter than the southern one. Besides, Figure 4 reveals that the flaring loops are also left-skewed compared to the magnetic PIL.
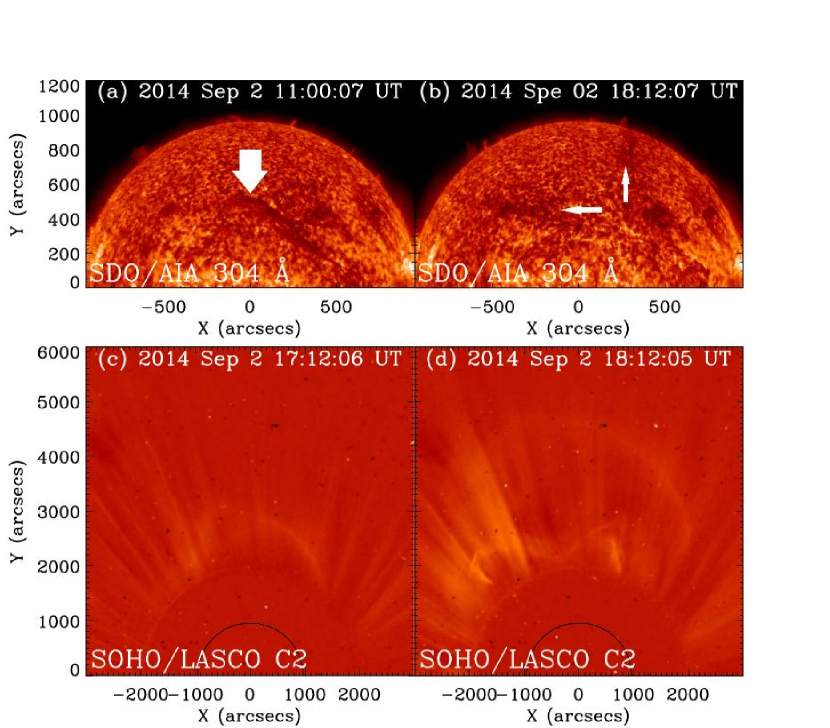
Figure 5 shows the filament eruption observed by SDO/AIA in 304 Å and the accompanied CME observed by the LASCO white-light coronagraph. It is seen that the filament initially resides in the source region (panel a), and rises to a large distance from the source region at 18:12:07 UT as indicated by the white arrow in panel (b). At 17:12:06 UT, the corresponding CME frontal loop first appears in the LASCO C2 field of view, whereas at 18:12:05 UT all the 3 components of the CME, i.e., a frontal loop, a bright core, and a cavity in between, are clearly visible. We compare the position angles of the eastern and western legs of the erupting filament in panel (b) and of the two legs of the CME core in panel (d), and find that the position angles of the filament legs are only larger than that of the CME core. Considering the curved structure of the erupting filament, it would be fair to claim that the bright CME core indeed corresponds to the erupting filament.
3.2 Event 2
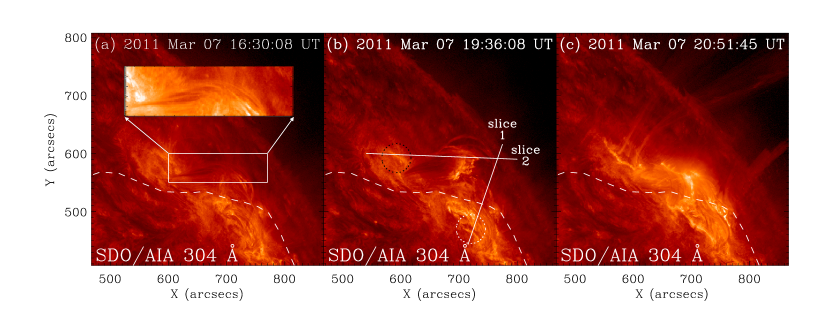
On 2011 March 7, a thick filament is located inside the active region NOAA 11164 in the northern hemisphere, hence it is an active region filament. As shown in panel (e) of Figure 1, the filament looks like an arch bridge, curving with a forward S-shape. Its activation and the ensuing solar flare are observed by SDO/AIA with high spatiotemporal resolution. A time sequence of the 304 Å images is displayed in Figure 6 and the associated animation. Before eruption, the filament is seen as a cluster of threads above the magnetic PIL as shown by Figure 6(a) and its inset. Compared to the the filament spine or the underlying magnetic PIL as marked by the dotted line in Figure 6, the filament threads are right-skewed. The right-skewed barbs are also clearly visible in the H images as shown in Figure 1(e). It should be noted that barbs are a dynamic structure, forming and disappearing from time to time (Li & Zhang, 2013), and the H barbs are not always visible. In this case, we can judge the bearing sense of a filament based on the threads. Actually, threads are even more reliable than H barbs, as demonstrated by Martin et al. (2008).
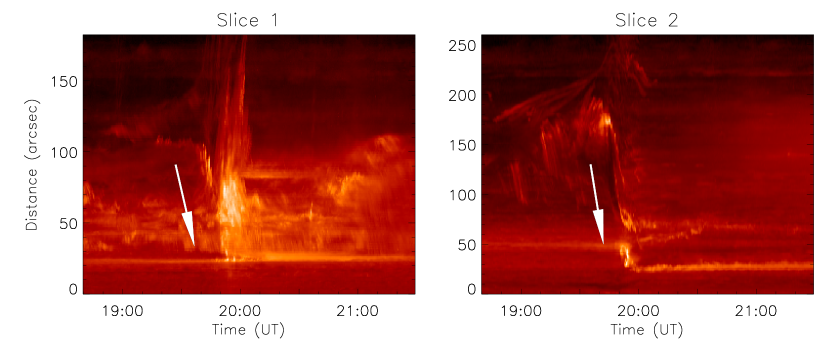
At 19:20 UT, a brightening starts to appear around the western end of the filament. With the brightening increasing in strength and extending eastward. The central part of the filament spine begins to brighten. With that, the filament is broken into two parts. As the western part falls down, the eastern part rises up rapidly. At 19:45 UT, flare ribbons and flaring loops become visible. As the eruption continues, erupts, a small bundle of plasma in absorption is seen to fall down near the western end of the filament at 19:36:08 UT, forming a bright narrow band at the edge of the draining plasma as enclosed by the white circle in Figure 6(b). Soon after, a large amount of filament material falls down to the solar surface along the eastern leg of the filament, forming another drainage site near the eastern end, which is indicated by the black circle in Figure 6(b). Similarly, we select two slices near the two ends of the filament to show the the draining motions, respectively. The two slices are marked by the white solid lines 1 and 2 in Figure 6(b). The time-slice diagrams of the AIA 304 Å intensity are depicted in Figure 7, where the start point of line 1 is the southern end and that of line 2 is the eastern end. The draining motions and the brightening are clearly revealed in the figure, as indicated by Figure 7. By comparing the line connecting the two conjugate drainage sites with the magnetic PIL, it is found that the drainage sites are right-skewed according to the definition in Chen et al. (2014). The flaring loops are also seen to be right-skewed, as revealed by Figure 6(c).
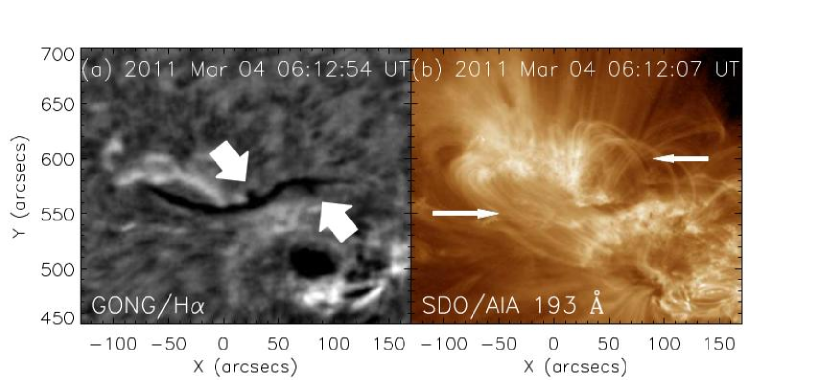
Considering that the bearing sense of the filament barbs and the skew of the flaring loops may suffer from the projection effects since the filament is close to the solar limb, we examine the H and EUV images at 06:12 UT on 2011 March 4 when the filament was passing through the central meridian. As shown by both the H and AIA 193 Å images in Figure 8, the filament appears with an ‘S’ shape with right-bearing barbs as indicated by the thick arrows, and the overlying coronal arcade is right-skewed in comparison with the filament spine, as indicated by the thin arrows. These results confirm that the filament indeed has right-bearing barbs, and the overlying coronal magnetic loops are right-skewed.
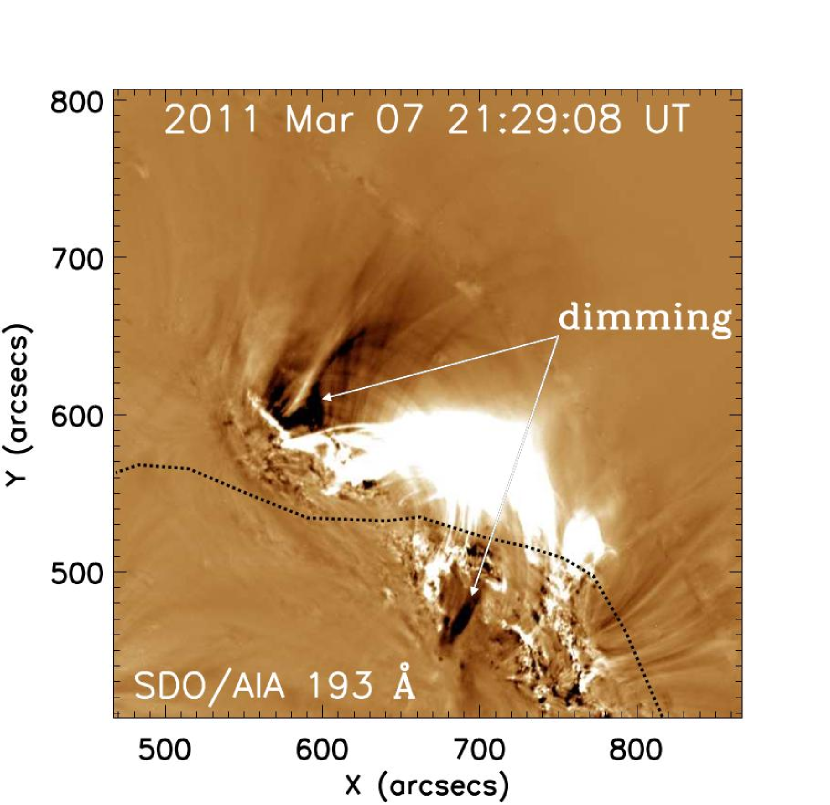
In order to check the skew of the EUV twin dimmings, we display the AIA 193 Å difference image at 21:29:08 UT in Figure 9, which is subtracted with the pre-eruption image at 17:39:08 UT. The twin dimmings are clearly seen to be right-skewed, as indicated by the two arrows. In this figure, the bright flaring loops are also revealed to be right-skewed when compared with the underlying magnetic PIL, consistent with Figures 6 and 8.
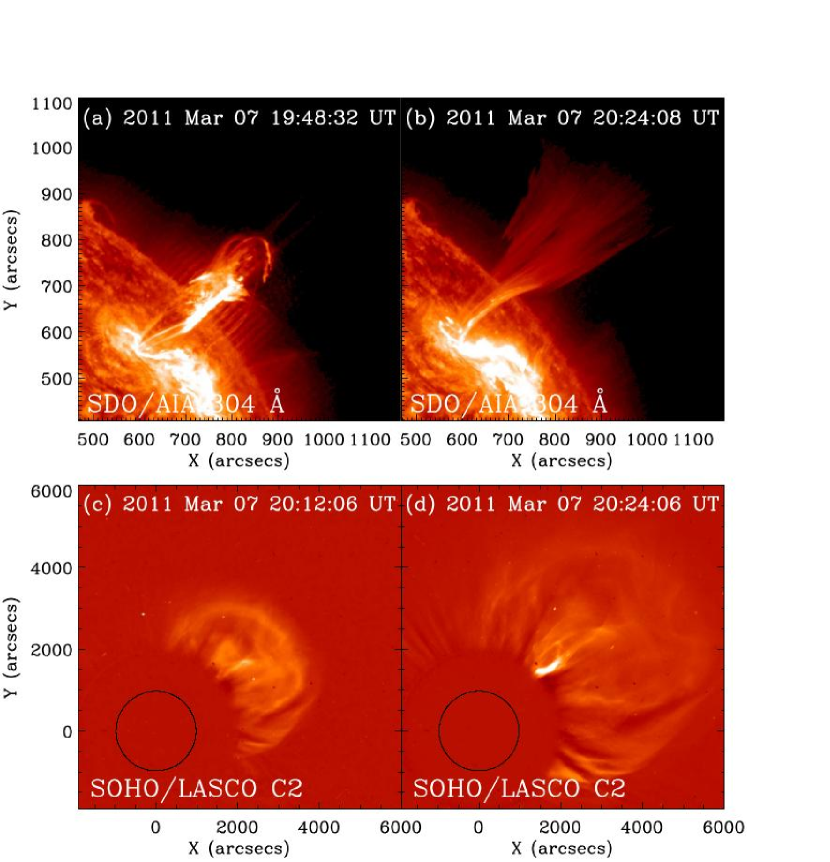
Figure 10 depicts the filament eruption observed by SDO/AIA in 304 Å and the accompanied CME by the LASCO white-light coronagraph. It is seen through the movie that the filament starts to accelerate significantly at 19:44 UT. At 20:12:06 UT when it is close to the flare peak in GOES 1–8 Å, both the CME frontal loop and the bright core are discernable, but the CME cavity is not clear. At 20:24:06 UT, all the 3 components of the CME are visible and the CME evolves into a halo event. We compare the position angle of the northern leg of the erupting filament in panel (b) and that of the northern leg of the CME core in panel (d), and find that they are nearly the same, implying that the bright CME core indeed corresponds to the erupting filament.
4 Discussions
4.1 Helicity of the two filaments
Magnetic field in the solar corona is often sheared or twisted, which offers free energy for solar flares and CMEs (Chen, 2011; Low, 2015). The magnetic twist or shear can be quantitatively measured by helicity, either magnetic helicity or current helicity (Demoulin et al., 1997). It has been found that there is a preferential sign of current helicity in each hemisphere, i.e., negative in the northern hemisphere and positive in the southern hemisphere. Such a preference is valid not only for active regions (Seehafer, 1990; Pevtsov et al., 1994; Rust & Kumar, 1994; Bao & Zhang, 1998), but also for solar filaments (Pevtsov et al., 2003). Generally it is assumed that current helicity and magnetic helicity have the same sign, especially for the direct current system (Demoulin et al., 1997). Since it is much easier to calculate the current helicity density, it is convenient to use the twist parameter to represent the helicity of a magnetic system (e.g., Seehafer, 1990), where is related to the magnetic field by the formula under the assumption of the force-free condition in the photosphere. With photospheric vector magnetograms, we can get the vertical components of both the magnetic field () and the current density () in the local Cartesian coordinates. It is noted in passing that even the full vector of the current density can also be derived under the force-free assumption (Yang et al., 2014). Thus, we can calculate the helicity parameter via , i.e.,
| (1) |
so as to determine the sign of helicity of the filaments studied in this paper. A positive/negative corresponds to a sinistral/dextral filament.
In the case without vector magnetograms, we may have other indirect methods to infer the sign of helicity of a magnetic system, e.g., the sunspot whorls (Zirker et al., 1997). In terms of solar filaments, several indirect methods have been proposed to infer the sign of helicity, e.g., the bearing of the filament barbs (Martin et al., 1994; Martin, 1998), overlying coronal arcades (Martin & McAllister, 1995), EUV twin dimmings (Jiang et al., 2011), and the skew of the conjugate drainage sites upon filament eruptions (Chen et al., 2014). According to these methods, a dextral filament would have right-bearing barbs, left-skewed coronal arcades, and left-skewed twin dimmings and drainage sites upon eruption, whereas a sinistral filament would have left-bearing barbs, right-skewed coronal arcades, and right-skewed twin dimmings and drainage sites upon eruption. If confirmed, these methods may provide an efficient way to determine the sign of helicity of a filament and the corresponding CME after the filament erupts. Since the sign of helicity of CMEs is one important parameter to determine the geo-effectiveness of the CME, and CMEs often have the same sign of helicity as the source filaments (Jing et al., 2004), the quick determination of the sign of helicity for solar filaments will be beneficial for space weather forecasting.
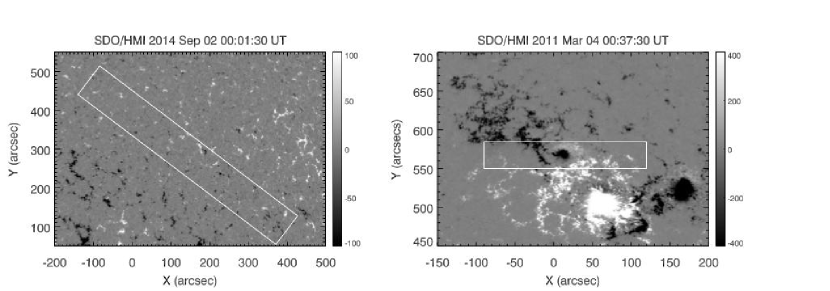
According to our data analysis in §3, it is found that for the 2014 September 2 event, the filament barbs are right-bearing, the twin dimmings are left-skewed, the flaring loops are left-skewed, and the conjugate sites of the filament drainage are left-skewed as well. Note that the skew of all these patterns is judged when compared with the photospheric magnetic PIL or the filament spine. Based on the rules mentioned above, this filament has negative helicity, which is the preferential helicity in the northern hemisphere where the filament is located. In order to check the validity of these indirect methods, we calculate the twist parameter averaged around the filament channel using the vector magnetograms measured by SDO/HMI. The area of calculation is marked as the white box in the left panel of Figure 11, which shows the longitudinal magnetogram in gray-scale. After removing the ambiguity and the projection effects, we use Eq. (1) to calculate at each pixel inside the box. Considering the singularity of Eq. (1), we ignore those pixels with G in order to reduce the error. The averaged in the selected box is -0.078 Mm-1. As the box becomes wider, the averaged changes in the range of -0.01 and -0.08 Mm-1, meaning that the filament channel has a negative helicity. Such a result confirms that all the indirect methods mentioned above succeed in inferring the sign of helicity of the erupting filament event on 2014 September 2.
For the 2011 March 7 event, it is found according to our data analysis in §3 that the twin dimmings are right-skewed, the flaring loops are right-skewed, and the conjugate sites of filament drainage are right-skewed as well. These features all imply that the helicity of this filament has a positive sign. However, the filament barbs are revealed to be right-bearing. If we apply the barb rule mentioned in Martin (1998), we would claim that the helicity of this filament is negative, which is opposite to the results inferred from all other indirect methods. In order to check its real sign of helicity, we use the SDO/HMI vector magnetograms to calculate the twist parameter . With the same method as above, we calculate the averaged for the 2011 March 7 event. In order to avoid the projection effects, the magnetogram of the corresponding active region on March 4 is used, as shown in the right panel of Figure 11. The averaged inside the white box is 0.39 Mm-1, which is nearly independent of the size of the selected area. We also exclude the sunspot patch and consider those pixels with G only, the resulting is 0.40 Mm-1. This means that the erupting filament on 2011 March 7 has a positive helicity, which is the same as the active region. Note that the result is opposite to the preferential sign of helicity in the northern hemisphere where the filament is located. Such a result validates again the indirect methods based on the skew of the flaring loops (Martin & McAllister, 1995), the skew of the twin dimmings (Jiang et al., 2011), and the skew of the conjugate sites of the filament drainage (Chen et al., 2014). However, it contradicts the result derived from the filament barbs under the assumption that there is one-to-one correspondence between the filament chirality and the barb bearing.
The reason of this contradiction is that, as suggested by Chen et al. (2014), the one-to-one correspondence between the filament chirality and the barb bearing reviewed by Martin (1998), i.e., a sinistral/dextral filament has left/right-bearing barbs, is valid only for the inverse-polarity filaments, i.e., those with a flux rope magnetic configuration. For normal-polarity filaments, i.e., those with a sheared arcade magnetic configuration, the correspondence is opposite, i.e., dextral filaments have left-bearing barbs, and sinistral filaments have right-bearing barbs. According to the paradigm proposed by Chen et al. (2014, see their Fig. 7), the sinistral chirality of the 2011 March 7 filament, with a positive helicity, combined with its right-bearing barbs, implies that the corresponding magnetic structure of the 2011 March 7 filament is a sheared arcade, rather than a flux rope. The hot channel structure observed during the eruption of this filament, which was proposed to be the evidence of a flux rope by Cheng et al. (2013), should be formed during the initiation phase of the eruption, e.g., via magnetic reconnection.
4.2 Is flux rope a necessary condition for the CME progenitor?
It is well known that most CMEs derive their energy from the hosting magnetic field (Forbes, 2000; Chen, 2011). Therefore, the pre-eruption structure, sometimes called CME progenitor (Chen, 2011), becomes a key issue to explore in the CME research. Since flux rope structures were widely identified to exist in CMEs or interplanetary CMEs (ICMEs, Burlaga et al., 1981; Cheng et al., 2013; Vourlidas, 2014), a natural question is whether the magnetic flux rope exists prior to eruption, i.e., as a CME progenitor, or it is formed during eruption. A flux rope is an ideal candidate for the CME progenitor since it represents twisted magnetic fields and hence contains free magnetic energy in order to power CMEs and solar flares. Besides, it is easy for a magnetic structure with a flux rope to lose its equilibrium (Forbes, 1993) and be triggered to erupt through various types of instabilities (Török & Kliem, 2003; Kliem & Török, 2006; Olmedo & Zhang, 2010). From the observational point of view, many case studies have already shown that a magnetic flux rope exists before eruption. Whereas these authors presented convincing evidence of a pre-existing flux rope in their observations, we still cannot exclude the possibility of a CME progenitor without a flux rope.
From another line of thought, it is well known that many filaments end up with eruptions, forming the core of CMEs (House & Illing, 1983; Schmieder et al., 2013). Polarization measurements have revealed that there are both inverse-polarity type and normal-polarity type of filaments (Leroy et al., 1984; Leroy, 1989; Bommier & Leroy, 1998). Correspondingly, they are described by the flux rope model (Kuperus & Raadu, 1974) and the sheared arcade model (Kippenhahn & Schlüter, 1957; Aulanier et al., 2000), respectively. Based on a logic test, Chen (2011, 2012) proposed that a flux rope is not a necessary condition for a CME progenitor, and a sheared arcade can also erupt to form a CME. In this case, the strongly sheared core field along the filament channel may not possess those ideal MHD instabilities found in the configuration with a flux rope, it may still erupt when it is triggered by magnetic breakout above the core field (Antiochos et al., 1999) or emerging flux inside or outside the filament channel (Feynman & Martin, 1995; Chen & Shibata, 2000). Besides, it would be expected to see a quasi-separatrix layer along the strongly sheared core field, where magnetic reconnection would play the same role as tether-cutting (Moore et al., 2001), triggering the filament to erupt. The last mechanism probably works for the 2011 March 7 filament eruption event since brightenings are seen in the central part of the filament at 19:20 UT, as evidenced in the attached movie of Figure 6. Such brightenings are indicative of magnetic reconnection in the strongly sheared arcade field. Interestingly, Cheng et al. (2013) analyzed the EUV observations of this event carefully and found that a hot channel, which was interpreted to be a flux rope, starts to be visible also at 19:20 UT. Our results indicate that it is magnetic reconnection that changes a sheared arcade into a flux rope during the CME initiation process.
Unfortunately, there are no routine magnetic field measurements for solar filaments, except sparse individual ones (e.g., Kuckein et al., 2009; Xu et al., 2012; Orozco Suárez et al., 2014; Sasso et al., 2014). However, the paradigm presented in Figure 7 of Chen et al. (2014) offers an indirect method to diagnose the magnetic configuration of a filament by combining the information of the sign of helicity and the barb bearing of the filament, i.e., a sinistral filament with left-bearing barbs should have a flux rope magnetic configuration, and a sinistral filament with right-bearing barbs should have a sheared arcade magnetic configuration. For dextral filaments, the correspondence is opposite. Note that a filament may have barbs with mixed bearings. In this case the dominating bearing is considered (Pevtsov et al., 2003; Hao et al., 2015). Applying this model to the erupting filaments on 2014 September 2 and 2011 March 7, we conclude that the former filament has a magnetic flux rope before eruption, and the latter filament has a sheared arcade magnetic configuration before eruption. With these two cases representing two types of magnetic configurations of solar filaments, i.e., inverse-polarity and normal-polarity filaments, we stress that a flux rope is not a necessary condition as a pre-eruption structure leading to a CME. Of course, as a filament rises, no matter with a flux rope or a sheared arcade, the ensuing magnetic reconnection below the core field would turn poloidal magnetic field to toroidal field (Qiu et al., 2007; Hu et al., 2014), forming a new flux rope or growing the pre-existing flux rope. This is why the 3-component structure, which implies the existence of a flux rope, was observed in both CME eruptions.
References
- Antiochos et al. (1999) Antiochos, S. K., DeVore, C. R., & Klimchuk, J. A. 1999, ApJ, 510, 485
- Aulanier et al. (1999) Aulanier, G., Démoulin, P., Mein, N., et al. 1999, A&A, 342, 867
- Aulanier et al. (2000) Aulanier, G., Schmieder, B., van Driel-Gesztelyi, L., et al. 2000, Advances in Space Research, 26, 485
- Bao & Zhang (1998) Bao, S., & Zhang, H. 1998, ApJ, 496, L43
- Bommier & Leroy (1998) Bommier, V., & Leroy, J. L. 1998, IAU Colloq. 167: New Perspectives on Solar Prominences, 150, 434
- Brueckner et al. (1995) Brueckner, G. E., Howard, R. A., Koomen, M. J., et al. 1995, Sol. Phys., 162, 357
- Burlaga et al. (1981) Burlaga, L. F., Hundhausen, A. J., & Zhao, X.-P. 1981, J. Geophys. Res., 86, 8893
- Chen & Shibata (2000) Chen, P. F., & Shibata, K. 2000, ApJ, 545, 524
- Chen (2009) Chen, P. F. 2009, ApJ, 698, L112
- Chen (2011) Chen, P. F. 2011, LRSP, 8, 1
- Chen (2012) Chen, P. F. 2012, Hinode-3: The 3rd Hinode Science Meeting, 454, 265
- Chen et al. (2014) Chen, P. F., Harra, L. K., & Fang, C. 2014, ApJ, 784, 50
- Cheng et al. (2013) Cheng, X., Zhang, J., Ding, M. D., Liu, Y., & Poomvises, W. 2013, ApJ, 763, 43
- Cheng et al. (2014) Cheng, X., Ding, M. D., Zhang, J., et al. 2014, ApJ, 789, 93
- Demoulin et al. (1997) Demoulin, P., Bagala, L. G., Mandrini, C. H., Henoux, J. C., & Rovira, M. G. 1997, A&A, 325, 305
- Démoulin (2007) Démoulin, P. 2007, Advances in Space Research, 39, 1674
- Démoulin & Aulanier (2010) Démoulin, P., & Aulanier, G. 2010, ApJ, 718, 1388
- Dere et al. (1999) Dere, K. P., Brueckner, G. E., Howard, R. A., Michels, D. J., & Delaboudiniere, J. P. 1999, ApJ, 516, 465
- Feynman & Martin (1995) Feynman, J., & Martin, S. F. 1995, J. Geophys. Res., 100, 3355
- Filippov et al. (2015) Filippov, B., Srivastava, A. K., Dwivedi, B. N., et al. 2015, MNRAS, 451, 1117
- Forbes (1993) Forbes, T. G. 1993, IAU Colloq. 141: The Magnetic and Velocity Fields of Solar Active Regions, 46, 415
- Forbes (2000) Forbes, T. G. 2000, J. Geophys. Res., 105, 23153
- Forbes & Isenberg (1991) Forbes, T. G., & Isenberg, P. A. 1991, ApJ, 373, 294
- Gopalswamy et al. (1999) Gopalswamy, N., Yashiro, S., Kaiser, M. L., Thompson, B. J., & Plunkett, S. 1999, Proceedings of the Nobeyama Symposium, 207
- Gosling (1999) Gosling, J. T. 1999, Washington DC American Geophysical Union Geophysical Monograph Series, 111, 205
- Guo et al. (2010) Guo, Y., Schmieder, B., Démoulin, P., et al. 2010, ApJ, 714, 343
- Hao et al. (2015) Hao, Q., Guo, Y., Fang, C., Chen, P. F., & Cao, W. 2015, arXiv:1506.08490
- Harrison et al. (2003) Harrison, R. A., Bryans, P., Simnett, G. M., & Lyons, M. 2003, A&A, 400, 1071
- Harvey et al. (2011) Harvey, J. W., Bolding, J., Clark, R., et al. 2011, Bulletin of the American Astronomical Society, 1745
- House et al. (1981) House, L. L., Wagner, W. J., Hildner, E., Sawyer, C., & Schmidt, H. U. 1981, ApJ, 244, L117
- House & Illing (1983) House, L. L., & Illing, R. M. E. 1983, Solar Radio Storms, 99
- Hu & Jiang (2001) Hu, Y. Q., & Jiang, Y. W. 2001, Sol. Phys., 203, 309
- Hu et al. (2014) Hu, Q., Qiu, J., Dasgupta, B., Khare, A., & Webb, G. M. 2014, ApJ, 793, 53
- Illing & Hundhausen (1985) Illing, R. M. E., & Hundhausen, A. J. 1985, J. Geophys. Res., 90, 275
- Isenberg et al. (1993) Isenberg, P. A., Forbes, T. G., & Demoulin, P. 1993, ApJ, 417, 368
- Jiang et al. (2011) Jiang, Y., Yang, J., Zhang, J., & Wang, J. 2011, J. of Phys. Sci. & Application, 1, 148
- Jing et al. (2004) Jing, J., Yurchyshyn, V. B., Yang, G., Xu, Y., & Wang, H. 2004, ApJ, 614, 1054
- Kliem & Török (2006) Kliem, B., Török, T. 2006, Physical Review Letters, 96, 255002
- Kuperus & Raadu (1974) Kuperus, M., & Raadu, M. A. 1974, A&A, 31, 189
- Kuckein et al. (2009) Kuckein, C., Centeno, R., Martínez Pillet, V., et al. 2009, A&A, 501, 1113
- Kumar & Cho (2014) Kumar, P., & Cho, K.-S. 2014, A&A, 572, A83
- Kippenhahn & Schlüter (1957) Kippenhahn, R., & Schlüter, A. 1957, ZAp, 43, 36
- Lemen et al. (2012) Lemen, J. R., Title, A. M., Akin, D. J., et al. 2012, Sol. Phys., 275, 17
- Leroy et al. (1984) Leroy, J. L., Bommier, V., & Sahal-Brechot, S. 1984, A&A, 131, 33
- Leroy (1989) Leroy, J. L. 1989, Dynamics and Structure of Quiescent Solar Prominences, 150, 77
- Li & Zhang (2013) Li, L., & Zhang, J. 2013, Sol. Phys., 282, 147
- Lin & Soon (2004) Lin, J., & Soon, W. 2004, New A, 9, 611
- Low & Hundhausen (1995) Low, B. C., & Hundhausen, J. R. 1995, ApJ, 443, 818
- Low (2015) Low, B. C. 2015, Science China Physics, Mechanics, and Astronomy, 58, 015201
- Mackay et al. (2010) Mackay, D. H., Karpen, J. T., Ballester, J. L., Schmieder, B., & Aulanier, G. 2010, Space Sci. Rev., 151, 333
- Martin et al. (1994) Martin, S. F., Bilimoria, R., & Tracadas, P. W. 1994, NATO Advanced Science Institutes (ASI) Series C, 433, 303
- Martin et al. (2008) Martin, S. F., Lin, Y., & Engvold, O. 2008, Sol. Phys., 250, 31
- Martin & McAllister (1995) Martin, S. F., & McAllister, A. H. 1995, Bulletin of the American Astronomical Society, 27, 961
- Martin (1998) Martin, S. F. 1998, Sol. Phys., 182, 107
- Mikic & Linker (1994) Mikic, Z., & Linker, J. A. 1994, ApJ, 430, 898
- Moore et al. (2001) Moore, R. L., Sterling, A. C., Hudson, H. S., & Lemen, J. R. 2001, ApJ, 552, 833
- Olmedo & Zhang (2010) Olmedo, O., & Zhang, J. 2010, ApJ, 718, 433
- Orozco Suárez et al. (2014) Orozco Suárez, D., Asensio Ramos, A., & Trujillo Bueno, J. 2014, A&A, 566, A46
- Patsourakos et al. (2013) Patsourakos, S., Vourlidas, A., & Stenborg, G. 2013, ApJ, 764, 125
- Pevtsov et al. (2003) Pevtsov, A. A., Balasubramaniam, K. S., & Rogers, J. W. 2003, ApJ, 595, 500
- Pevtsov et al. (1994) Pevtsov, A. A., Canfield, R. C., & Metcalf, T. R. 1994, ApJ, 425, L117
- Qiu et al. (2007) Qiu, J., Hu, Q., Howard, T. A., & Yurchyshyn, V. B. 2007, ApJ, 659, 758
- Rust & Kumar (1994) Rust, D. M., & Kumar, A. 1994, Sol. Phys., 155, 69
- Sasso et al. (2014) Sasso, C., Lagg, A., & Solanki, S. K. 2014, A&A, 561, A98
- Scherrer et al. (2012) Scherrer, P. H., Schou, J., Bush, R. I., et al. 2012, Sol. Phys., 275, 207
- Schmieder et al. (2013) Schmieder, B., Démoulin, P., & Aulanier, G. 2013, Advances in Space Research, 51, 1967
- Seehafer (1990) Seehafer, N. 1990, Sol. Phys., 125, 219
- Shibata & Magara (2011) Shibata, K., & Magara, T. 2011, Living Reviews in Solar Physics, 8, 6
- Song et al. (2014) Song, H. Q., Zhang, J., Chen, Y., & Cheng, X. 2014, ApJ, 792, L40
- Sterling & Hudson (1997) Sterling, A. C., & Hudson, H. S. 1997, ApJ, 491, L55
- Török & Kliem (2003) Török, T., & Kliem, B. 2003, A&A, 406, 1043
- Vourlidas et al. (2013) Vourlidas, A., Lynch, B. J., Howard, R. A., & Li, Y. 2013, Sol. Phys., 284, 179
- Vourlidas (2014) Vourlidas, A. 2014, Plasma Physics and Controlled Fusion, 56, 064001
- Wang et al. (2015) Wang, H.-J., Liu, S.-Q., Gong, J.-C., & Lin, J. 2015, RAA, 15, 363
- Webb & Howard (2012) Webb, D. F., & Howard, T. A. 2012, LRSP, 9, 3
- Yan et al. (2014) Yan, X. L., Xue, Z. K., Liu, J. H., Kong, D. F., & Xu, C. L. 2014, ApJ, 797, 52
- Yang et al. (2014) Yang, Y.-H., Chen, P. F., Hsieh, M.-S., et al. 2014, ApJ, 786, 72
- Zirker et al. (1997) Zirker, J. B., Martin, S. F., Harvey, K., & Gaizauskas, V. 1997, Sol. Phys., 175, 27
- Xu et al. (2012) Xu, Z., Lagg, A., Solanki, S., & Liu, Y. 2012, ApJ, 749, 138