On the OVI Abundance in the Circumgalactic Medium of Low-Redshift Galaxies
Abstract
We analyze the mass, temperature, metal enrichment, and OVI abundance of the circumgalactic medium (CGM) around galaxies of mass in the Illustris simulation. Among star-forming galaxies, the mass, temperature, and metallicity of the CGM increase with stellar mass, driving an increase in the OVI column density profile of dex with each dex increase in stellar mass. Observed OVI column density profiles exhibit a weaker mass dependence than predicted: the simulated OVI abundance profiles are consistent with those observed for star-forming galaxies of mass , but underpredict the observed OVI abundances by dex for lower-mass galaxies. We suggest that this discrepancy may be alleviated with additional heating of the abundant cool gas in low-mass halos, or with increased numerical resolution capturing turbulent/conductive mixing layers between CGM phases. Quenched galaxies of mass are found to have 0.3-0.8 dex lower OVI column density profiles than star-forming galaxies of the same mass, in qualitative agreement with the observed OVI abundance bimodality. This offset is driven by AGN feedback, which quenches galaxies by heating the CGM and ejecting significant amounts of gas from the halo. Finally, we find that the inclusion of the central galaxy’s radiation field may enhance the photoionization of the CGM within kpc, further increasing the predicted OVI abundance around star-forming galaxies.
keywords:
circumgalactic medium – intergalactic medium – galaxies: formation – methods: hydrodynamic simulations1 Introduction
O5+, or OVI, is the most commonly-observed metal line absorber in cosmological sightlines (e.g. Simcoe et al., 2004; Danforth & Shull, 2008; Tripp et al., 2008; Wakker & Savage, 2009). There are two important reasons for its prominence. First, after hydrogen and helium, oxygen is the third most abundant element in the Universe. Second, OVI produces a strong absorption doublet redward of 1000 Å( 1031, 1037 Å), which greatly aids spectral identification. OVI traces plasma in a wide variety of environments, from ionized metals in the intergalactic medium to high velocity cloud complexes within the Galactic halo. The highest column-density OVI absorbers ( cm-2) are predicted to be associated with gas within a few hundred kpc of galaxies (Oppenheimer & Davé, 2009; Smith et al., 2011).
Using the Cosmic Origins Spectrograph on the Hubble Space Telescope, Tumlinson et al. (2011) (henceforth T11) studied the abundance of OVI around galaxies by carrying out a survey of QSO sightlines passing close, in projection, to a sample of galaxies. The selected galaxies span a wide range of stellar masses () and specific star-formation rates (including red galaxies and star-forming galaxies with specific star formation rates (sSFRs) up to yr-1). T11 found that above their typical column density detection limit of cm-2, the 30 star-forming galaxies in the sample were mostly detected, but not so for the majority of the 12 passive galaxies observed. The velocity centroids and widths of the OVI absorbers typically lie within the inferred halo escape velocity, suggesting that the OVI arises from bound gas within the virial radius. Two important results follow. First, star-forming galaxies have a roughly uniform OVI column density profile with radius over two orders of magnitude in stellar mass (). Second, the incidence of cm-2 absorption is significantly higher around star-forming galaxies than passive galaxies in the stellar mass range .
To understand these two results, the origin of the OVI-tracing gas must be understood. The interpretation is complicated by the fact that OVI typically features a significantly broader velocity profile than nearby HI absorbers, making it difficult to constrain the total mass or metallicity of the gas which is traced by OVI. Furthermore, the important ionization states OVII and OVIII may only be seen in absorption in the X-ray range, which limits their detectability with current instruments, thus making it difficult to constrain the ionization state of the OVI-tracing gas.
Various suggestions have been made for where the OVI “phase” originates. First, it is possible that OVI traces material shocked and entrained by supernova ejecta, which cools adiabatically as it propagates from the central galaxy (e.g. Thompson et al., 2015). Second, OVI may trace the shock-heated/virialized warm-hot intergalactic medium (WHIM) (Cen & Ostriker, 1999; Davé et al., 2001; Narayanan et al., 2012). Third, OVI may be the result of hot halo gas cooling through a thermal instability (Heckman et al., 2002; Maller & Bullock, 2004). Fourth, OVI may trace the interfaces between cold clouds and the hot virialized halo, either in a turbulent mixing layer (Begelman & Fabian, 1990) or a conduction layer (Sembach et al., 2003). A fifth alternative is that the OVI is actually cooler gas ( K) that is photoionized by the local galactic radiation field (Tripp et al., 2008).
The abundance of OVI around galaxies has been examined in a number of studies which focused on cosmological zoom-in simulations of one or two halos. Within this context, the galactic feedback can be tuned to successfully match the observed OVI profile, with each study finding that their strongest feedback model was the most successful (e.g., Stinson et al., 2012). Hummels et al. (2013) came to a similar conclusion upon examination of the OVI profile around a single simulated MW-like halo, ultimately inferring that it was impossible to reproduce the observed OVI profile without modifying the temperature of the CGM by hand. Liang et al. (2015) studied the ion abundances around a single MW-mass halo with various feedback prescriptions, finding that the feedback required to match the observed OVI profile was sufficiently strong that it made the stellar component of the galaxy unrealistically large and spheroid-dominated. Since these studies each examined only one or two halos, they have not shown that these feedback prescriptions successfully generate a galactic population which matches observational constraints when applied to a full cosmological sample. Moreover, all these investigations neglected AGN feedback.
Ford et al. (2015) carried out a larger, statistical comparison with a cosmological hydrodynamic simulation, similar in spirit to our work. They found that their model underpredicts the amount of OVI in the CGM. However, it is unclear whether the discrepancy arises universally for all galaxies in the simulation or only for galaxies in a small mass range. Furthermore, they found no significant difference in the OVI absorption around passive and star-forming galaxies within the simulation. This may be due to their use of an “artificial” quenching mechanism which has negligible impact on the circumgalactic gas, unlike an explicit AGN feedback model (e.g., Costa et al., 2015). The simulations of Ford et al. (2015) may also suffer from numerical issues with their adopted hydrodynamic solver (e.g., Sijacki et al., 2012; Kereš et al., 2012; Nelson et al., 2013; Zhu et al., 2015).
In this paper, we use the Illustris simulation (Vogelsberger et al., 2014a, b; Nelson et al., 2015b) to explore the relationship between galaxies and the CGM, with the goal of understanding the T11 results. Illustris has a subgrid model for processes thought to be relevant to galaxy formation, including galactic winds driven by supernovae as well as AGN feedback. The simulation contains a large statistical sample of galaxies having a wide range of environments, histories, and star-formation rates, and shows reasonable agreement with observed galactic scaling relations such as the galaxy mass function and the star-formation main sequence. In particular, since the galactic wind model of Illustris has a velocity scaling with halo mass such that the majority of wind material is retained within the halo (Suresh et al., 2015), the simulation offers a “maximal” scenario for metal enrichment of small galaxies. Conversely, for more massive galaxies, the powerful AGN feedback model of Illustris offers the opportunity to test whether the same mechanism that quenches massive galaxies also has a significant impact on the CGM.
2 Methods
2.1 Simulation Details
The Illustris simulation (Vogelsberger et al., 2014b) is a large cosmological hydrodynamic simulation run with the moving-mesh arepo code (Springel, 2010), using the galaxy formation model presented in Vogelsberger et al. (2013) (henceforth V13). arepo employs a finite-volume scheme over a grid of cells defined using a Voronoi tessellation of space. The mesh-generating points which are employed to construct the tessellation move approximately with the bulk motion of the fluid. This allows the code to benefit from the strengths of both Eulerian and Lagrangian approaches (Springel, 2010; Vogelsberger et al., 2012; Torrey et al., 2012).
The size of the periodic simulation volume in Illustris is 75 Mpc, and has dark matter particles and initial gas resolution elements. This latter number can vary over time as the code adaptively refines or de-refines gas cells, in order to keep a roughly fixed mass resolution. The dark matter mass resolution is and the initial gas mass resolution is . The Illustris simulation adopts the WMAP-7 cosmology (, , , and ). Illustris provides a good match to the low-redshift galaxy population, especially the stellar mass function, star formation main sequence, and Hubble sequence (Vogelsberger et al., 2014b; Genel et al., 2014; Sparre et al., 2015). In addition, the Illustris physics model has been shown to give good agreement with damped Lyman- absorber abundances, metallicities, and kinematics at higher redshifts (Bird et al., 2014, 2015).
For details of the numerical and feedback parameters used in this paper, we refer the reader to V13. Here we briefly review some salient features. Primordial and metal line cooling are included in the presence of a spatially uniform, time-varying UV background (Katz et al., 1996a; Wiersma et al., 2009; Faucher-Giguère et al., 2009), accounting for gas self-shielding following Rahmati et al. (2013). Star particles are formed using a two-phase description of the interstellar medium (ISM) (Springel & Hernquist, 2003). Stellar evolution and chemical enrichment are followed as described in V13, explicitly tracking the following 9 elements: H, He, C, N, O, Ne, Mg, Si, Fe. The cooling prescription assumes ionization equilibrium, which is reasonable at low redshifts, by which time any AGN-induced non-equilibrium “fossil zones” have likely re-equilibrated (Oppenheimer & Schaye, 2013).
Winds are launched from star-forming regions, with the wind speed set at 3.7 times the 1D local halo velocity dispersion. This choice was made to ensure that the wind material is largely recycled, maintaining a sufficient cosmic star formation rate at (see V13). Another, related consequence of this choice is that the winds typically do not escape the halo (Suresh et al., 2015). The mass loading (ratio of the wind mass flux to the SFR) is , where is the local one-dimensional DM velocity dispersion.
In order to ensure that the winds escape the dense ISM, wind cells are hydrodynamically decoupled and allowed to propagate as particles until they either travel for a set time, or reach sufficiently low-density regions (the winds typically recouple hydrodynamically within a few kpc of the galaxy). The wind particle mass, momentum, energy, and metals are then deposited into the nearest gas cell. The winds are launched cold; however we have found that the wind particles immediately shock on the ambient gas and thermalize, re-distributing their energy between kinetic and thermal components. In other words, a cold fast wind and a hot slow wind with the same overall energy per unit mass will have a similar impact on the phase structure of the CGM; what matters more is the overall energy per unit mass of the wind (Suresh et al., 2015).
Each wind particle is assigned a metallicity equal to some fraction of that of the ambient ISM from which it was launched. The fiducial wind metal-loading factor of 0.4 was chosen to allow the simulations to match the galaxy mass-metallicity relation. We note that the winds are effective enough that the CGM is enriched at a level comparable to observational estimates (see Section 3.1).
The Illustris physics model also includes AGN feedback from supermassive black holes. Black hole (BH) particles are seeded at early times and allowed to grow through accretion and merging events. Since the scale of the event horizon is always well below the resolution of the simulation, a sub-grid feedback model is employed which is based on methods developed in earlier studies (Di Matteo et al., 2005, 2008; Springel et al., 2005; Sijacki et al., 2007). BH feedback has two modes, depending on the accretion rate. At high accretion rates, the BH enters a “quasar-mode”, in which a fraction of the accretion energy is thermally coupled to the nearby gas. At lower accretion rates, the BH enters “radio-mode” feedback, which mimics observations of radio jets injecting energy on larger scales, by inflating hot bubbles which are hydrodynamically buoyant. In our implementation, this is carried out by injecting energy in randomly-distributed bubbles at a distance offset of tens of kpc away from the center of the galaxy. Finally, we approximate the effect of AGN irradiation by modifying the heating and cooling rates for gas cells near the BH.
The time an average BH spends in the quasar mode is short compared to the time spent in the low-accretion radio mode (Sijacki et al., 2015). V13 found that the radio mode feedback has, by far, the most significant impact on the cosmic star-formation rate compared to the other elements of the AGN physics model. This is due to the AGN feedback becoming increasingly more important in large halos (), playing a major role in the quenching of massive galaxies at late times.
Since our work deals primarily with the metal enrichment of the circumgalactic medium, we briefly review the relevant subgrid model in Illustris. Each star particle which forms in our simulation corresponds to a single-age stellar population (SSP), which produces metals over time depending on its IMF and age (for example, an SSP with a top-heavy IMF will deposit its metals at a higher rate as the more massive stars evolve faster). We assume a Chabrier IMF. Enrichment from AGB stellar mass loss, core-collapse supernovae, and Type Ia supernovae are included, as these are the primary channels by which a stellar population’s metal production enriches the nearby ISM (assumed yields are discussed in Vogelsberger et al., 2013). As metals are generated over time by a star particle, they are deposited into nearby gas cells, after which the metals are treated as a passive tracer which is hydrodynamically advected with the gas. This mixing scheme is a strength of the code in the context of CGM studies and is not shared by most smoothed-particle hydrodynamic implementations (Oppenheimer et al., 2012). Feedback processes thus transport metals into the CGM by ejecting enriched gas from the galaxy into the halo.
2.2 Identifying and Selecting Galaxies
Dark matter halos are identified using the subfind algorithm (Springel et al., 2001), with a friends-of-friends (FoF) group-finding approach, adopting a linking length of 0.2 times the mean interparticle separation. In this paper we limit our analysis to “central galaxies”, or the galaxies which inhabit the largest halo of each FoF group. This allows us to incorporate the effects of any satellite galaxies on the shared CGM (e.g. small satellites helping to enrich the CGM through stellar outflows or tidal stripping). We select all central galaxies with stellar mass within twice the half-mass radius, which are resolved galaxies with star particles. We define the virial radius of each central galaxy as the radius within which the average density exceeds 200 times the critical density (we will refer to this radius as ). When computing global CGM properties, we define the CGM as all gas which is not star-forming and which is outside of twice the half-mass radius of any galaxy (central or satellite) in the halo. Conversely, when computing OVI maps around the halo, we include all gas, including the galaxies’ ISM.
Tumlinson et al. (2011) selected a galaxy sample with a median redshift close to known quasar sightlines. The galaxies were chosen to sample a wide range of stellar masses () and specific star formation rates. In Figure 1 we compare the stellar masses and specific star-formation rates of the Illustris central-galaxy population and the COS-Halos galaxy sample. In the few cases where their follow-up galactic spectroscopy revealed a more massive galaxy at the same redshift, they changed their adopted impact parameter to reflect that of the more massive galaxy. Specifically, they select the most massive galaxy within 300 kpc transverse, and (which corresponds to about Mpc along the line of sight). This is similar but entirely equivalent to our approach of considering only central galaxies of the FoF groups, and treating the satellite contributions as part of the CGM. We test whether our method differs significantly from T11’s by choosing 10000 random positions (analogous to quasar sightlines) within our simulation volume, and checking whether the most massive galaxy and the closest galaxy are the same within the observational “cylinder” (radius 300 kpc, length 14 Mpc). For galaxies with , the closest galaxy and the most massive galaxy in the cylinder are mismatched only of the time. Hence, our central galaxy-focused approach is largely equivalent to the observational galaxy-selection technique.
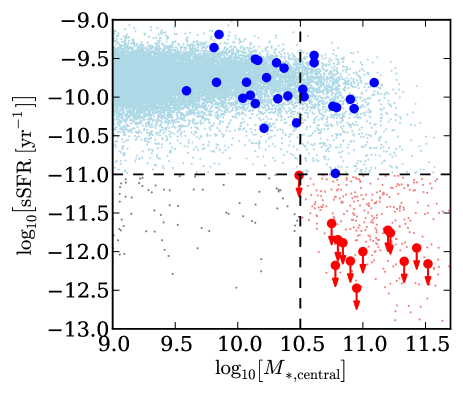
are not shown, as they do not have have measured star-formation rates, only the distinction of “early-type” or “late-type” based on emission line diagnostics.
We also include relevant measurements from Johnson et al. (2015). These authors compiled an observational dataset from their own absorption-blind survey, combined with quasar sightlines around 11 massive galaxies in the Sloan Digital Sky Survey (York et al., 2000), as well as the COS-Halos sample. Since their focus was to study the role of environment in circumgalactic OVI and HI abundances, many of the galaxies in their sample are identified as being “non-isolated”, which they define as having a spectroscopic neighbor within a projected distance of less than 500 kpc, a radial velocity difference of km s-1, and with stellar mass of at least one-third of that of the survey galaxy. We include only isolated galaxies from Johnson et al. (2015) in our comparisons.
Johnson et al. (2015) do not explicitly derive SFRs as in the COS-Halos survey, but instead identify galaxies as “late-type” or “early-type” derived from absorption/emission line diagnostics, based on methods developed in Chen & Mulchaey (2009). We include the “late-type” (“early-type”) points along with the star-forming (passive) galaxies of T11, and the two datasets typically exhibit similar trends. Finally, we note that apart from the COS-Halos data, which are at impact parameters of kpc, most of the sightlines of Johnson et al. (2015) are at much larger distances, out to Mpc. However, since virtually all of the sightlines at large distances are non-detections in OVI for both star-forming and passive galaxies, we focus only on sightlines within 300 kpc when comparing to the the simulation.
Finally, we include also measurements from Prochaska et al. (2011), who carried out a survey of QSO sightlines around galaxies of luminosity with known redshifts. As for the other datasets, we exclude non-isolated galaxies by selecting only the brightest galaxy within 200 kpc and km s-1, as given in their paper. Unfortunately, they did not have sufficient photometry to determine galaxy masses, so the galaxies are tagged by their luminosity and by being “early-type” or “late-type” based on absorption/emission line diagnostics. Not knowing the precise masses of the galaxies in this sample makes detailed interpretation difficult, but when possible we include them with the other observations.
2.3 Computing OVI Abundances
The total oxygen abundance in each gas cell is a direct output of the simulation. We calculate the ionization fraction of the oxygen using Cloudy 13.03 (Ferland et al., 2013), with the extragalactic ultraviolet background spectral energy distribution (UVB SED) (for which we adopt Faucher-Giguère et al., 2009) used as an input to the code, assuming ionization equilibrium. Both photo-ionization and collisional ionization are accounted for. All of the results in our paper implement only the extragalactic UVB, except for Section 3.3 where we explore the effect of adding a local galaxy SED on top of the extragalactic background. We run Cloudy in single-zone mode, which treats the gas as a single slab illuminated on one side by the given radiation field. We use slightly modified versions of Simeon Bird’s Cloudy scripts, which are freely available at https://github.com/sbird/cloudy_tables.
With the OVI content of each gas cell in hand, we compute radial OVI profiles in order to compare to observations. We project the cells onto a uniform grid around each halo of extending transverse proper kpc. Interpolation of the gas density onto the grid is performed using an SPH kernel with size corresponding to the gas cell size as in Bird et al. (2013). We treat each grid cell as a single sight line, analogous to the random locations of quasar sightlines around physically unrelated galaxies (e.g., Katz et al., 1996b).
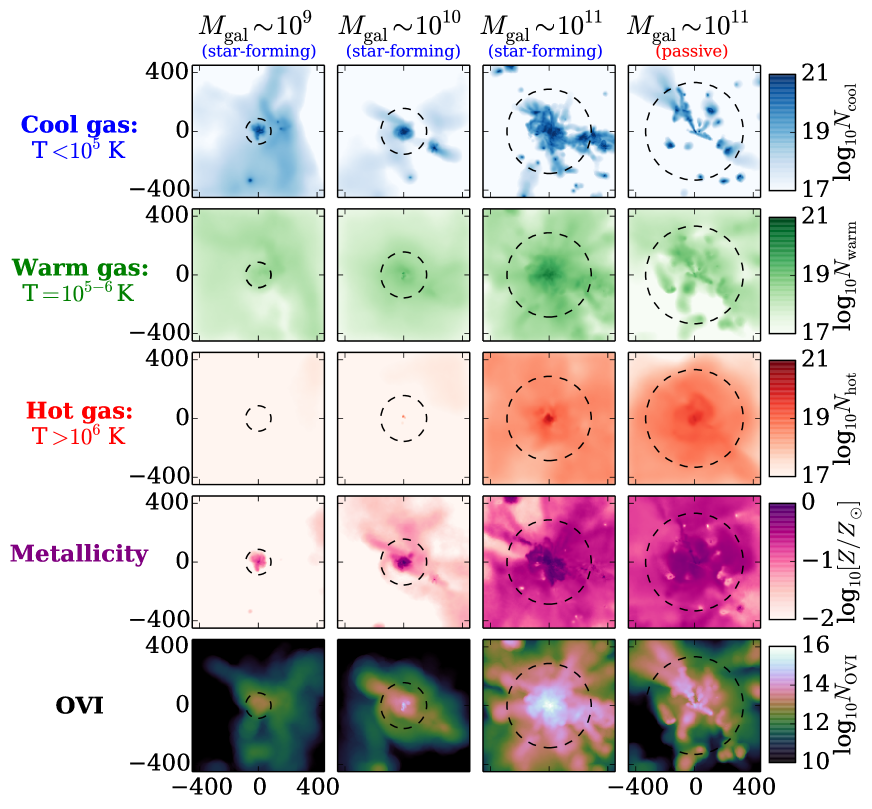
We include all gas cells within a line-of-sight velocity window around the galaxy position, with the velocity width chosen to roughly correspond to that used by the observational experiments. In the COS-Halos sample, the velocity centroid of the observed OVI absorbers is typically within km/s of the galactic redshift. This velocity window corresponds to a large line-of-sight distance in a pure Hubble flow ( Mpc), so it is not clear a priori that the gas must be located within the halo simply by velocity arguments. Nevertheless, we have confirmed that, in the simulation, even when including all gas within this large line-of-sight distance, the vast majority of the OVI absorption occurs within the virial radius of the halo. The only exception is at impact parameters kpc (which exceeds the maximum impact parameter of 150 kpc probed by T11), where interloper absorbers at large distances from the halo can boost the inferred OVI absorption, especially around small galaxies. We adopt the velocity window km/s when computing all OVI radial profiles. Figure 2 shows gas properties around four representative galaxies in the simulation, specifically the total column density in three temperature bins, the metallicity, and the total OVI abundance. Once we have computed the grid of OVI column densities for each galaxy, we compile all grids for a given galaxy population. We then compute a radial profile for the population by taking the median column density of all the sightlines in radial bins of 20 kpc.
3 Results
The mass of the th ionization state of element in a gas cell is given by:
| (1) |
This means that the total CGM OVI abundance depends on: 1) CGM mass, 2) CGM metallicity, 3) oxygen-to-metal ratio, and 4) OVI ionization fraction. We now explore how each of the above factors varies with stellar mass and star-formation rate in order to determine the origin of the observed dependence of OVI abundance on these galaxy properties.
3.1 The Star Formation Main Sequence:
We begin by focusing on the star-forming galaxies at over a wide range in galaxy stellar mass: . Here we define “star-forming” by a simple cut in the specific star formation rate: sSFR yr-1, which is the same threshold used in the COS-Halos survey. None of the results in this section include passive galaxies (sSFR yr-1).
3.1.1 Global CGM properties
In this subsection, we define the CGM as all gas within that is not star-forming and that is outside of twice the half-mass radius of any galaxy (central or satellite) in the halo.
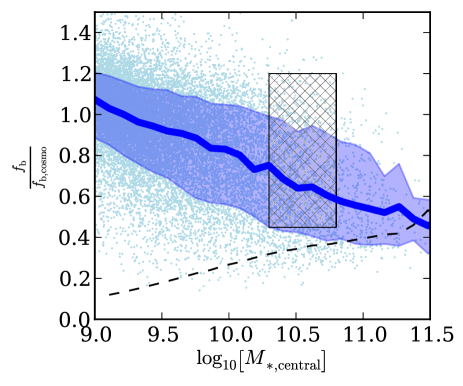
Figure 3 shows the baryon fraction as a ratio of the cosmic baryon fraction within versus galaxy stellar mass. (Note that baryon fractions can exceed unity since gas is dissipative while dark matter is collisionless.) Our wind model is tuned such that the winds typically do not escape the halo (Suresh et al., 2015), which means that in small halos, where AGN feedback is not significant, the halo baryon fraction is close to unity. Conversely for higher mass galaxies, the AGN can eject baryons out of the halo through radio-mode feedback over time (Genel et al., 2014; Suresh et al., 2015). Hence more massive galaxies tend to have lower baryon fractions, with values around in halos which host star-forming galaxies. This range in baryon fractions is consistent with the findings of Werk et al. (2014), who found that star-forming galaxies in halos of mass (and galaxy mass of ) have retained somewhere between of their baryons; this range is denoted by the hatched region in Figure 3. We note that this agreement is not a trivial result, and is feedback-dependent. For example, the dashed curve in Figure 3 shows the baryon fraction derived from the EAGLE simulation, as published in Schaller et al. (2015), where we have converted from halo mass to stellar mass using the relation given in Behroozi et al. (2013). Schaller et al. (2015) find the opposite relationship, where smaller galaxies have lower baryon fractions than larger galaxies. We discuss the implications of this difference in Section 4.
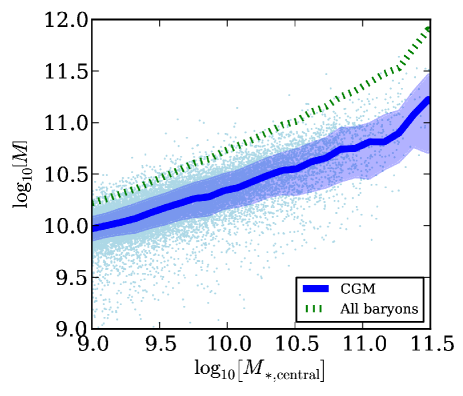
Figure 4 shows the corresponding CGM (i.e. non-ISM) mass within as a function of galaxy stellar mass. The median curve is well-approximated by the following linear fit: . The CGM is a significant reservoir of baryons for all galaxy masses, which is unsurprising, given that the halos of star-forming galaxies retain their baryons to within a factor of (see Figure 3). The “break-even point” where the CGM mass is comparable to the stellar mass of the galaxy occurs for galaxies with . Below (above) this galaxy mass, the is greater than (less than) .
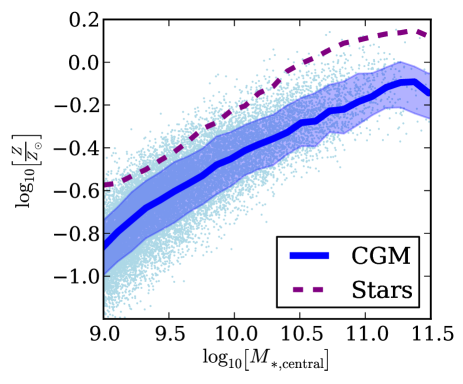
Figure 5 shows the CGM metallicity within as a function of galaxy stellar mass. The CGM metallicity is clearly “aware” of the galaxy mass-metallicity relationship. We find that the CGM metallicity mirrors the galaxy metallicity: over 2.5 decades in galaxy mass, the median CGM metallicity lies below the median galaxy metallicity at a constant offset of dex.
The total metal content of the CGM and galaxies agree well with the estimates of Peeples et al. (2013), who compiled observational measurements of the total metal content in the low-ion, OVI-traced, X-ray, and dust components of the CGM. Peeples et al. (2013) found that for star-forming galaxies within the stellar mass range , the total CGM metal mass is . Over the same range in stellar mass, the simulation gives a CGM metal mass of .
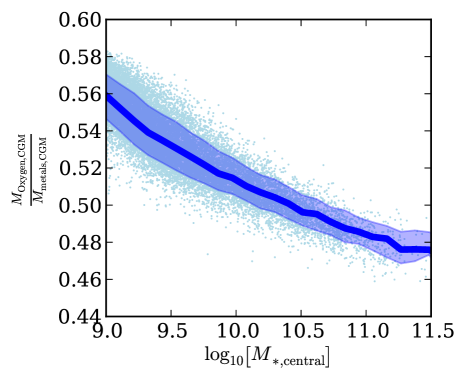
At fixed metallicity, the relative abundance of individual elements can vary based on, for example, the relative numbers of core-collapse and Type Ia supernovae that have occurred. In Figure 6, we show the mass-weighted oxygen-to-metal ratio within . There is a monotonic decrease in the amount of oxygen per unit metal with increasing stellar mass. This trend is driven by the fact that larger galaxies have had more time for Type Ia supernovae to contribute significant amounts of iron to the CGM, which lowers the alpha enhancement. Comparing to Figures 4, 5, and 6, we find that the variation in the alpha-enhancement of the CGM is a small effect compared to the trends of CGM mass, metallicity, and ionization state with galaxy stellar mass.
In Figure 7, we show the mass fractions of CGM gas in different temperature ranges. This figure highlights that the CGM has a multiphase character at all galaxy masses (e.g., Nelson et al., 2015a). Larger galaxies inhabit more massive halos with deeper gravitational potential wells, so that they have a higher fraction of hotter gas. Nevertheless, there is a substantial fraction of cool (), non-ISM gas within , from of all gas in galaxy halos to in galaxy halos. This gas likely originates from ongoing accretion, galactic fountains, and from cooling instabilities in the warm gas due to the upturn of the cooling function at K. We find that the metallicity of the warmer gas is typically lower than that of the cool gas, but that the metallicity of these phases converges at higher galaxy mass. For example, the metallicity of the K gas is about 0.7 dex below that of the K gas for galaxies, 0.4 dex below at , and 0.05 dex below at .
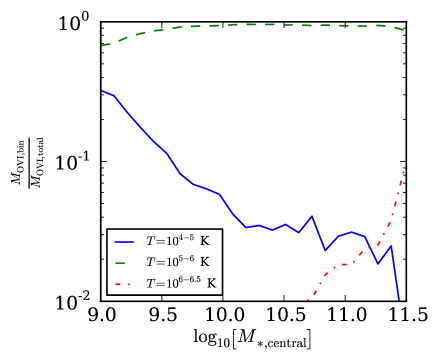
However, OVI does not trace the full range of circumgalactic gas temperatures. Figure 8 shows the mass fraction of circumgalactic OVI in different temperature bins. At all galaxy masses, OVI is found primarily in gas in the temperature range K. Indeed, the K bin dominates the total OVI budget to the extent that the total amount of OVI in the CGM essentially reflects how much K gas is in the halo. This implies that collisional ionization is the most important ionization mechanism, in agreement with earlier works which found that the high-column OVI absorbers associated with galactic halos are predominantly collisionally ionized (e.g., Smith et al., 2011). That said, especially in lower mass halos, a non-negligible contribution to the OVI column arises in cooler, photo-ionized gas. This photo-ionized OVI typically occurs within lower column density absorbers towards the outskirts of the CGM or at the CGM-IGM interface (see Figure 2).
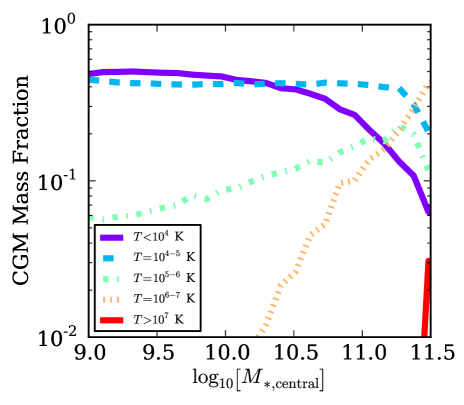
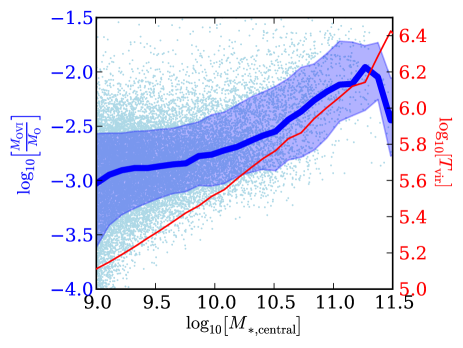
Figure 7 and Figure 8 aid interpretation of how the global circumgalactic OVI ionization fraction scales with galaxy mass, shown in Figure 9. Figure 9 shows a monotonic increase in the OVI ionization fraction between and , above which it decreases. From Figure 8, this can be understood as an increase in the abundance of K gas, except for the highest galaxy masses where there is a downturn. This is precisely what Figure 7 shows, with the increase in K gas being matched by a simultaneous decrease in the abundance of K gas. In other words, more of the cool gas in the multiphase halos is being heated into the OVI “phase”. Note that since there is always a significant reservoir of cool gas, regardless of halo mass, this trend can continue despite halo virial temperatures that are higher than the peak collisional excitation temperature of OVI. This increase of OVI ionization fraction with galaxy mass finally ends at the highest masses, where Figure 7 shows that the abundance of K gas decreases as more gas moves to hotter temperatures. OVI poorly traces gas at K, where OVII, OVIII, and OIX dominate; at these high galaxy masses there is far more oxygen in OVII, OVIII, and OIX than in OVI. Unfortunately these higher species absorb in the soft X-ray range, which limits their observability.
3.1.2 Radial OVI profiles
In Section 3.1.1, we presented global CGM properties around star-forming galaxies. Now we examine the radial profiles of OVI computed around these galaxies, including both CGM and ISM gas. The OVI column densities shown below are derived from all gas within a line-of-sight velocity cut of km/s of the central galaxy.
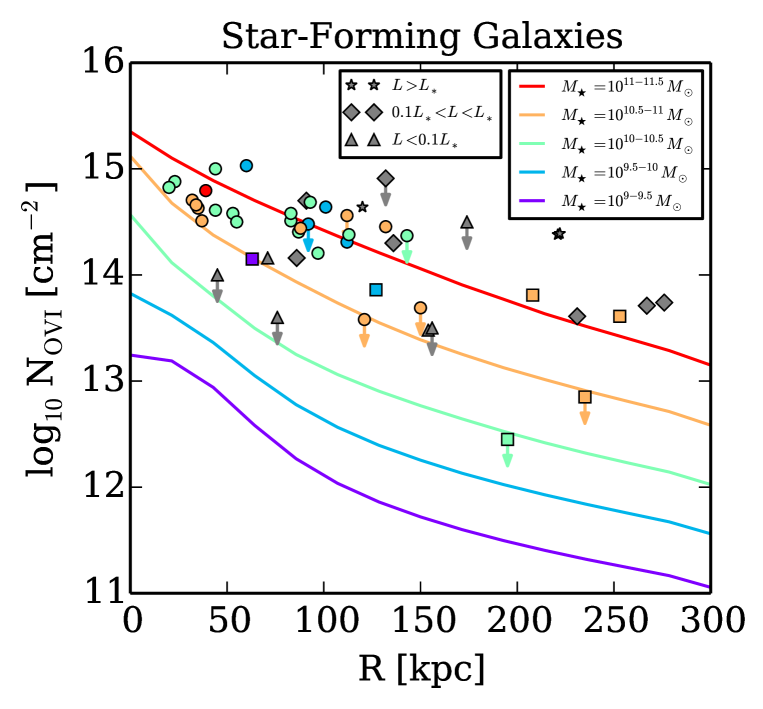
In Figure 10, we give our model predictions for OVI abundance profiles around star-forming galaxies with mass . The model shows a clear monotonicity where lower mass galaxies have less OVI in their CGM. This trend does not appear to be reflected in the observations, although the number of observed sightlines in each galaxy mass bin is small. We report the results of log-rank two-sample tests between the simulations and the observational measurements, computed over radial bins of width 100 kpc. The OVI abundance around the two most massive star-forming galaxies bins (, shown in orange and red in Figure 10) are consistent with the observations. Conversely, the simulated galaxies in the two lower mass bins (, shown in green and blue) have a very low probability of being drawn from the same population as the observations (), in any radial bin. Finally, few conclusions can be drawn about how the OVI profile around galaxies in the lowest mass bin considered (, shown in purple) compares to observations, since there is only one point (a log-rank test in the inner 100 kpc gives a probability ).
The strong galaxy mass dependence of the circumgalactic OVI abundance can be qualitatively understood from Figures 4, 5, and 9. First, low mass galaxies have less circumgalactic gas around them, since they inhabit less massive halos. Second, the smaller galaxies also have less enriched CGM gas. Finally, even at fixed oxygen mass, the low mass galaxies have a lower OVI ionization fraction since their virial temperature is lower. All of these effects act to decrease the OVI abundance, resulting in significantly lower OVI abundances around low-mass star-forming galaxies compared to massive ones.
The apparent lack of such a clear relationship between OVI abundance and galaxy mass in the observations is puzzling. One would naively expect that all of the conditions we find in the simulation would hold in the real Universe: smaller galaxies should have less CGM gas, this gas would be relatively less enriched (if the CGM reflects the mass-metallicity relation of galaxies), and OVI should be a less abundant ionization state in smaller halos with lower virial temperatures. Hence, we would expect smaller galaxies to have less OVI. However, this expectation rests on the assumption that OVI gas traces well-mixed halo gas. The fact that galaxies across two orders of magnitude in stellar mass show the same rough OVI profile with radius (despite significantly different virial radii) implies that OVI must trace gas which does not reflect the mean physical state of the global CGM; e.g. gas which is more enriched or denser. Since Illustris underpredicts the OVI abundance around low-mass galaxies, we can infer that physical processes which the simulation cannot capture may be important (e.g. conduction layers or turbulent mixing layers at the boundaries between cold and hot phases). We will return to these issues in Section 4.
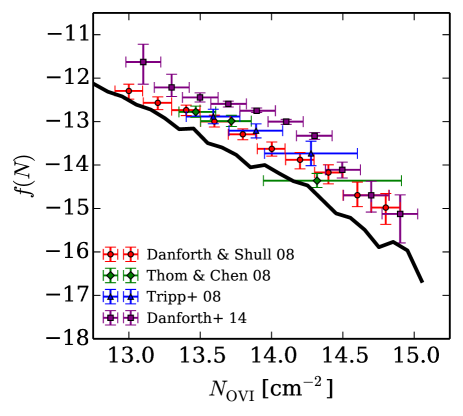
We note that the OVI column density distribution function (CDDF) generated by the simulation at underpredicts observational constraints (see Figure 11). Since small galaxies are much more numerous than large ones, this CDDF underprediction is another manifestation of the problem that there is too little OVI around small galaxies. In Section 4 we explore possible ways for low-mass star-forming galaxies to generate as much circumgalactic OVI as their more massive counterparts.
3.2 Star-forming vs. Quenched Galaxies:
In Section 3.1 we investigated the manner in which the mass, enrichment, and OVI abundance of the CGM depend on stellar mass for star-forming galaxies. We now explore the way these CGM properties depend on the galactic star formation rate, at fixed stellar mass. Since the COS-Halos survey includes only passive galaxies with mass , we focus on the differences between star-forming and passive galaxies in this same range. Again, we split the simulated galaxies into categories of “star-forming” or “quenched” with a simple cut sSFR yr-1; the same as used in the COS-Halos survey (T11; Werk et al., 2013).
In the Illustris simulation, quenched galaxies reside in halos that are preferentially more massive than those of star-forming galaxies, at fixed stellar mass (compare, e.g., the right two panels of Figure 2). This implies that the CGM should generally be hotter around passive galaxies, since the virial temperature is higher. We also find that the passive galaxies in our simulation have systematically more massive central black holes than do the star-forming galaxies (see also Sijacki et al., 2015) of the same stellar mass. This is not coincidental, since it is the AGN feedback that quenches massive galaxies at late times. Specifically, V13 showed that the “radio mode” of the AGN feedback is most important for quenching galaxies at low redshift. As we discuss below, our implementation of the radio mode physics also has a significant impact on the circumgalactic gas.
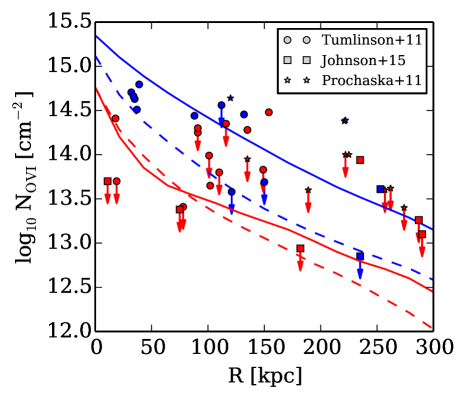
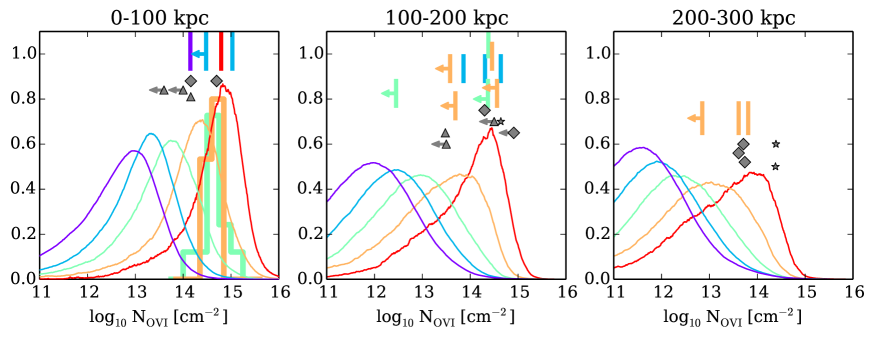
Figure 12 shows the analog of Figure 10, but split instead by passive and star-forming galaxies (red and blue, respectively), and only for massive galaxies with . As in Figure 10, the observational points are from T11, Johnson et al. (2015), and Prochaska et al. (2011) (indicated by circles, squares, and stars, respectively). The solid curves show the median simulation result for the mass range , while the dashed curves provide the same for .
When we focus on OVI measurements around star-forming and passive galaxies in the same stellar mass range (), as in Figure 12, the two observed populations appear fairly similar. Nevertheless, T11 found that a Kolmogorov-Smirnov test rejects the null hypothesis that they are drawn from the same parent distribution at confidence. Binning into radial bins of 100 kpc and performing 1-D log-rank tests (which can account for upper limits/non-detections), we find that the most significant difference between the two populations occurs within the inner 100 kpc. For example, for sightlines with impact parameter kpc, a log-rank test rejects the null hypothesis that passive and star-forming galaxies are drawn from the same parent population at (the difference is especially striking for kpc, even by eye). Conversely, for both the impact parameter bins kpc and kpc, the log-rank test gives probabilities of , implying that at kpc the passive and star-forming galaxy sightlines are consistent with being drawn from a single parent population. In other words, the strongest difference in OVI abundance around star-forming and passive galaxies appears to occur at low impact parameter (50-100 kpc). We return to the possible significance of this in Section 3.3.
The simulation reproduces this decrease in the abundance of OVI around passive galaxies compared to star-forming galaxies. We will infer the origin of this bimodality, and why the offset between the OVI abundance around passive and star-forming galaxies is larger at higher galaxy mass, by repeating the analysis we performed in Section 3.1.
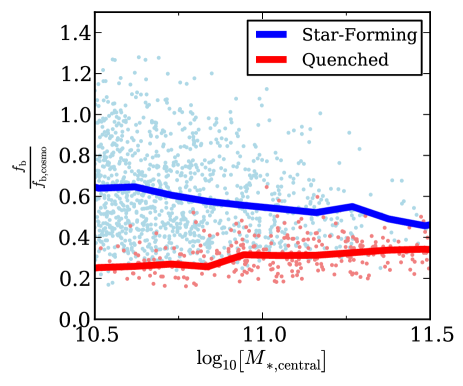
Figure 13 shows that the baryon fraction of quenched galaxies is significantly lower than those that are star-forming. The depletion of baryons around passive galaxies in the Illustris simulation is due to the radio-mode component of our AGN physics model. The radio-mode efficiently heats the CGM gas and ultimately displaces a significant amount of this gas from the inner halo (see also Genel et al., 2014). Conversely, the galactic winds, which are present in both star-forming and passive galaxies, are mostly unable to escape the halo, which allows the star-forming galaxies to retain high baryon fractions in their halos (see Figure 3). As a result of this radio-mode feedback, we find that for galaxies with stellar mass , the median CGM mass of quenched galaxies is dex below that of star-forming galaxies, despite the fact that quenched galaxies inhabit more massive halos than their star-forming counterparts at fixed stellar mass.
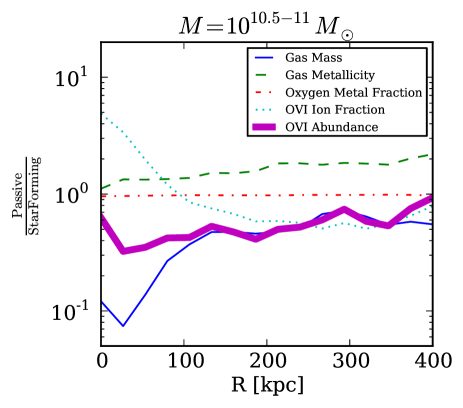
In addition to the difference in CGM mass between star-forming and passive galaxies, other factors, as shown in Eq. (1), may also contribute to the OVI abundance offset. We show the median of the ratios of each contributing factor, as a function of radius, in Figure 14. For clarity, the curves denote the following (where “SF” denotes star-forming):
-
•
Blue solid curve:
-
•
Green dashed curve:
-
•
Red dot-dashed curve:
-
•
Cyan dotted curve:
-
•
Purple bold curve:
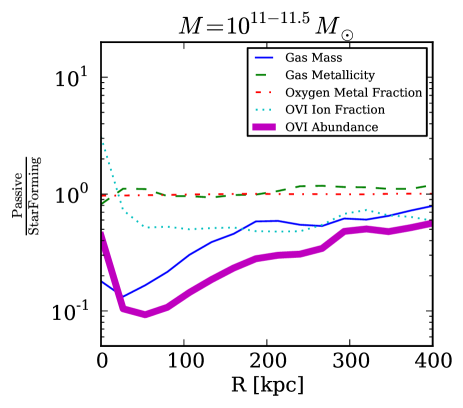
Note that the thick purple curve, which shows the total ratio of the OVI abundance as a function of radius, is simply the product of the other four. The two panels of Figure 14 show the two mass bins on the left and on the right.
Figure 14 allows us to separate out the effects of: 1) CGM mass, 2) CGM metallicity, 3) oxygen-to-metal ratio, and 4) OVI ionization fraction. We see that the mass depletion of the CGM gas, caused by the AGN radio mode (blue solid curve), is the primary driver of the difference in the OVI abundance. The variation in CGM enrichment between the two galaxy populations (green dashed curve) is relatively small, within a factor of , with the passive galaxies actually having a slightly more enriched CGM on average than star-forming ones (which can also be seen in the example shown in Figure 2). The difference in the oxygen-to-metal ratio (red dot-dashed curve) is completely negligible compared to the other factors. Finally, the OVI ionization fraction (cyan dotted curve) varies with radius, such that the passive-galaxy CGM has a higher OVI ionization fraction than the star-forming-galaxy CGM at small radii, but has a lower ionization fraction at large distances.
Since passive galaxies reside in more massive halos and also have more massive black holes, at all radii their circumgalactic gas tends to be hotter than the corresponding gas around star-forming galaxies. The change in the OVI ionization fraction ratio with radius is due to the multiphase nature of the CGM gas, and where the different phases are generally located. There is typically more cool CGM gas close to the galaxy. This gas is significantly warmer around passive galaxies than star-forming ones, leading to a higher fraction of gas in the temperature range K, which, in turn, boosts the OVI ionization fraction. Conversely, gas at larger distances from the central galaxy is typically virialized, hot gas. At these distances, primarily due to AGN heating, the passive-galaxy CGM gas is hot enough ( K) to move out of the OVI phase; hence passive galaxies have a lower effective ionization fraction of OVI than star-forming ones at large radii.
The boosted ionization fraction at small radii around passive galaxies competes with the significant gas depletion. For the lower mass bin (), the two effects largely cancel, such that the high ionization fraction at kpc “masks” the depleted CGM, and the total OVI abundance is not significantly different between the two galaxy populations. However, in the higher mass bin (), all of the gas is hotter, so the boosting of the ionization fraction at small radii is less important, except near the galaxy. Therefore, the masking due to a boosted OVI ionization fraction is less effective, and the resulting OVI abundance is lower. This explains why Figure 12 shows a larger difference in the higher mass bin (solid curves) than the lower mass one (dashed curves). In summary, the simulations predict that the OVI profile around passive galaxies is primarily driven by a mass-depleted CGM and a radius-dependent ionization fraction (which is itself a consequence of a multiphase CGM, with cooler gas at low radii, and hotter gas at larger radii).
3.3 The Role of Local Photo-ionization from the Central Galaxy
In Section 3.2 we showed that strong AGN feedback could be a driver for the difference in OVI abundance around passive and star-forming galaxies. However, we know from other observational probes that the Illustris AGN physics model is too energetic and is known to expel too much gas from inner halos at masses greater than . The differences in Section 3.2 were largely driven by the radio mode feedback heating and excavating the inner halo regions of halo gas. Fig. 10 of Genel et al. (2014) shows that for the most massive objects in Illustris, the inner halo is too gas-poor. Furthermore, Figure 12 indicates that the AGN imprints a bimodality in OVI abundance around passive and star-forming galaxies which extends out to even kpc, whereas the observations, while not able to rule out such a scenario, suggest that the bimodality may only occur within kpc. Hence, while AGN feedback may indeed have a significant impact on properties of the CGM, we also explore a distinct mechanism to explain the passive/star-forming OVI abundance bimodality: the effect of the different local galactic radiation fields on the CGM around the two galaxy populations.
Star-forming galaxies may naturally produce more OVI in their CGM simply because their stars emit a harder collective SED. For example, the population of young stars in star-forming galaxies can generate an excess of soft x-rays from shock heated gas due to stellar winds and supernovae (Cerviño et al., 2002). These soft X-rays can directly photoionize gas into high ionization states such as OVI (Cantalupo, 2010; Kannan et al., 2014), naturally explaining why the CGM of star-forming galaxies has an excess of OVI over that of passive galaxies (see also Werk et al. 2015, in prep.).
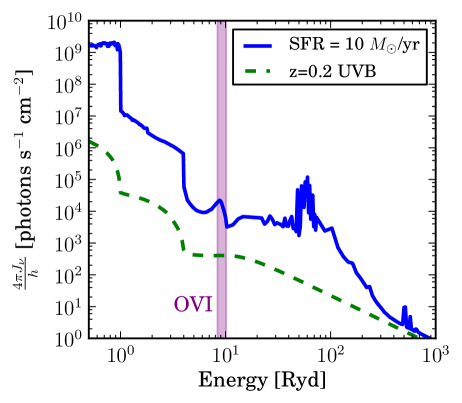
In order to examine the potential significance of this effect, we irradiate a single halo of gas extracted from the simulation with a galaxy SED of varying amplitude to determine how much the local radiation field influences the OVI abundance. The galaxy SED we use is the 5 Myr old stellar population SED of Cerviño et al. (2002). This SED includes the blackbody radiation from O and B stars, as well as soft x-rays from shock heated gas due to stellar winds and supernovae. We adopt an escape fraction of 5% for the lower energy photons, which have a negligible impact on the OVI ionization fraction in any case. For the soft x-rays we assume an escape fraction of 100% (i.e. that the ISM and CGM is optically thin to photons of these energies). In effect, this is an extreme model which gives an upper limit to the consequences of the radiation field. The amplitude of the inferred SED scales with the number of young stars, which we assume varies linearly with the galaxy star-formation rate.
We calculate the effects of the additional, local radiation field on the simulation in post-processing, again using Cloudy 13.03 (Ferland et al., 2013) (see Figure 15). The galaxy SED is treated as originating from a point-source located at the halo potential minimum, which is reasonable since the size of the galaxy is small compared to the scales of interest for the CGM. This galactic contribution is then added to the extragalactic UVB from Faucher-Giguère et al. (2009) used in the previous sections.
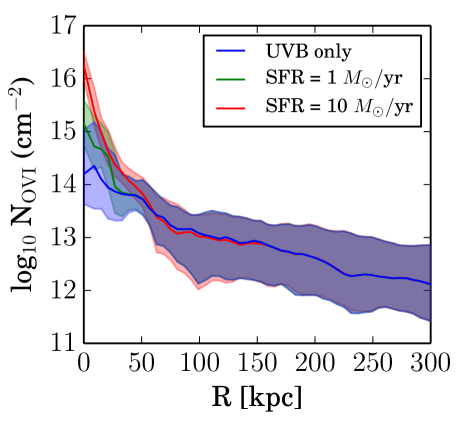
The object we consider is a single halo at from Illustris, with 3 different SEDs corresponding to SFRs of zero (extragalactic UVB only), 1 /yr, and 10 /yr. The result is shown in Figure 16. We find that while the local radiation field has little impact beyond about 50 kpc, there can be substantial enhancement of the OVI within this radius, due to photoionization from the galaxy. When we applied the same simple approach to all galaxies in the sample, we found a similar result: an enhancement of OVI around star-forming galaxies within a few tens of kpc. This scenario appears consistent with the observations, which show a stronger bimodality at kpc than at larger distances. We discuss the difference between this effect and the AGN in terms of the OVI bimodality in Section 4.
4 Discussion
In this work, we have studied the CGM properties and OVI abundance around galaxies in the Illustris simulation, examining how they vary with stellar mass and star-formation rate. We now discuss some of the implications of our results.
4.1 Constraints on Galactic Feedback from Star Formation and the Halo Baryon Fraction
We found that the baryon fraction of galaxies is a function of both stellar mass and star-formation rate. The baryon fraction decreases monotonically with increasing stellar mass, and more strongly quenched galaxies have lower baryon fractions. These are both feedback-dependent outcomes. The baryon fraction is high in lower-mass galaxies because the wind speed scales with the halo mass, and the winds are typically not energetic enough to escape the halo (Suresh et al., 2015). We have confirmed this result by inspecting the baryon fraction within smaller simulation volumes which have varying galactic wind speeds. Conversely, our AGN model is energetic enough to launch gas out of the halo, and since more massive (and more quenched) galaxies typically have larger black holes, these galaxies lose a more substantial fraction of gas and have lower baryon fractions. If we had instead employed stronger or very stochastic winds which could escape the halo at early times, or an AGN model which did not significantly affect the halo gas abundance, the baryon fraction relation with stellar mass could be inverted (which is the case, for example, in the EAGLE simulation, as shown in Schaller et al., 2015). In other words, the amplitude and slope of the baryon fraction versus galaxy mass depends sensitively on whether feedback is capable of driving gas out of halos (and, if so, on the galaxy mass scales affected).
The stars and CGM at high and low redshift provide several complementary constraints on galactic feedback. In Suresh et al. (2015), we found that early enrichment of the outskirts of massive halos, as observed in, e.g., Turner et al. (2014), requires metals to escape halos very early on, which can subsequently expand through the Hubble flow (Oppenheimer & Davé, 2006). However, Vogelsberger et al. (2013) found that with overly energetic winds, the low-redshift cosmic star-formation rate is too low, since there is insufficient recycling of halo gas to fuel late-time star formation. Now we additionally point out that stronger winds also systematically lower the baryon fraction of the halo, which is conservatively estimated to be 40% in halos (Werk et al., 2014).
The high measured baryon fractions of Werk et al. (2014) argue against very strong winds, such as those employed in the EAGLE simulation (Schaller et al., 2015). Unfortunately, the baryon fraction measurement of Werk et al. (2014) is at , which lies roughly at a transition point where both galactic winds and AGN are important, making it difficult to directly place strong constraints on either feedback channel. A future baryon fraction measurement for lower halo masses () would put a stringent limit on the strength of galactic winds specifically, since AGN feedback is expected to have little effect in this mass range.
4.2 The Puzzling Independence of CGM OVI abundance from Galaxy Mass
One of the aims of our work has been to understand the origin of OVI absorption around galaxies. However, we found that the simulation predicts a much stronger mass-dependence of the OVI column density profile with radius than is observed. The apparent lack of mass-dependence in the observations is surprising, and appears to require that the OVI abundance be somehow decoupled from the more global properties of halo gas. If the OVI abundance actually reflects the mass, metallicity, and ionization state of the virialized and well-mixed gas in halos, then it should scale strongly with galaxy mass, as each of these three quantities increases with galaxy mass. Since our simulations match observations at higher galaxy masses, the question seems to be how low-mass galaxies can generate as much OVI as galaxies which are tens or even a hundred times more massive.
Furthermore, why is it that this seemingly “universal” OVI profile for all galaxy masses scales with physical radius in roughly the same manner, not depending on the virial radius of the galaxies in question? We discuss a few leading alternatives as to what may be driving the OVI excitation around star-forming galaxies, offering various scenarios for the origin of the OVI absorbers: 1) recent winds, 2) shock-heated WHIM or gas cooling out of the hot CGM, or 3) photoionization from a soft X-ray feature in the SED of star-forming galaxies. Finally, we discuss possible limitations of our simulation arising from our finite mass resolution and the assumption of ionization equilibrium.
The first scenario, that the OVI originates in highly enriched, recent outflows, is appealing because it could naturally explain the bimodality between star-forming and passive galaxies, if active star formation generates enriched winds. Thompson et al. (2015) recently proposed a model in which hot winds, propagating adiabatically, cool rapidly as they reach the upturn in the cooling function, likely spending some time in the OVI phase. However, the cooling time at this point is short (e.g. the very steep drop in temperature seen in all models in Fig. 2 of their paper), and hence the OVI phase would not last long. It is, therefore, unclear if this mechanism can explain the high observed column density and covering fraction of OVI.
As to the reason that the star-forming galaxies across all masses have nearly the same OVI profile, perhaps the smaller galaxies, although less enriched than larger ones, are able to launch more gas in winds due to their shallower potential wells (i.e. they have a higher wind mass-loading). It may be that the two competing effects of metallicity and wind mass-loading cancel out, yielding similar profiles at all galaxy masses. This scenario seems somewhat contrived, however, particularly considering that the observed “universal” OVI profile does not appear to be sensitive to the virial radii of the galaxies in question, whereas observed wind speeds are weakly correlated with the depth of the potential (Martin, 2005; Weiner et al., 2009; Rubin et al., 2014; Chisholm et al., 2015). Furthermore, this effect should be present in the Illustris simulation. Our theoretical model features a significantly larger wind mass-loading factor for smaller galaxies as well as maximal enrichment since the winds typically remain bound to the halo. That the simulation nevertheless predicts a strong galaxy mass scaling casts doubt on the recent-enrichment scenario.
Another possibility is that the OVI represents the tail end of an even hotter CGM phase (e.g., Heckman et al., 2002), which may be gas that has been shock-heated through hierarchical structure formation (Davé et al., 1999; Cen & Ostriker, 1999; Davé et al., 2001). (Note that typically discussion of the WHIM involves gravitational shocks on up to Mpc scales, but here we specifically mean virialized hot gas localized within .) This could explain a “decoupling” between the metallicity of the OVI phase and that of the aggregate halo gas, since the cooling time is sensitive to the level of enrichment, so that gas cooling out of this hot phase into OVI will be preferentially enriched. Such a scenario may be especially viable for the more massive galaxies, which contain significant amounts of gas at temperatures above K that is better traced by OVII, OVIII, and sometimes OIX. As it cools, this massive reservoir of metal-enriched gas can replenish the OVI phase. Furthermore, if gas entering this phase continues to cool, it may accrete into the galaxy and fuel star-formation, partly accounting for the passive/star-forming OVI bimodality. However, this mechanism is far less effective in low-mass galaxies, since they have significantly less hot gas (see Figure 7). Therefore, if this is the only physical mechanism driving the OVI phase, it is likely that smaller galaxies would still have a significantly lower OVI abundance than larger ones, in conflict with the observations. Furthermore, Yao et al. (2009) did not detect OVII and OVIII in stacked spectra of 19 OVI absorbers in six QSO sightlines, implying that at least some OVI absorbers are not associated with a hotter gas phase.
Although collisional ionization can account for a significant amount of OVI at gas temperatures of 105.4-5.7K (the range where the fraction of oxygen in OVI is maximal) it is possible that a significant amount of OVI is cooler, photoionized gas. As we showed in Section 3.3, for example, if there is a significant though as-yet undetected strong excess of soft X-ray photons around 100 eV from star-forming galaxies, they could serve to efficiently photoionize OVI at large distances from the galaxy disk (Cantalupo et al. 2010, Werk et al. 2015, submitted). This scenario is appealing because a local ionizing radiation field from sources within a galaxy could naturally explain the correlation between OVI and galaxy SFR, and thus the dearth of OVI around non-star-forming galaxies. However, this mechanism alone is insufficient to explain the “universal” OVI profile for star-forming galaxies, since more massive galaxies, which have more circumgalactic gas and higher metallicity than low-mass galaxies, would likely also have more photo-excited OVI as well. Second, this effect will be strongest in the most massive galaxies, since their absolute star-formation rates are highest. Furthermore, as we showed in Figure 16, the enhancement of OVI by this effect likely does not extend beyond a few tens of kpc from the galaxy. Finally, Werk et al. (2015, submitted) show that such models must be highly tuned to explain other aspects of the observations, including universally undetected NV absorption () and an excess of SiIV absorption compared to lower-ionization state counterparts (e.g. SiII and SiIII).
Could resolution be the issue? Since the simulation code is adaptive and the CGM consists of relatively low density gas (typically ), the typical cell size in the CGM is a few proper kpc. If the OVI is primarily tracing gas which is diffuse and spans the halo (e.g. the warm gas seen in Figure 2), then our resolution should not be a major concern. However, it may be that a significant fraction of OVI gas arises in interfaces between cold and hot phases. These layers may be described by a turbulent mixing or a thermal conduction layer, depending on the magnetic field (which dictates how well electrons are able to conduct thermal energy from the hot gas to cooler regions). These processes are not resolved in the Illustris simulation and magnetic fields were not included. Could these possibly explain the universal OVI profile? It is difficult to imagine that these interfaces would provide the whole solution. Even in this case, the total OVI produced likely scales with the overall abundance and metallicity of the gas, which, again, both increase with galaxy mass. The importance of conductive/turbulent mixing layers between cool and hot regions can only be addressed with much higher resolution simulations.
Could our assumption of ionization equilibrium be at fault? We would expect this to be more of an issue for larger galaxies, where AGN fossil zones may be relevant (Oppenheimer & Schaye, 2013). However, the OVI profiles of massive galaxies in the simulation are consistent with observations; the problem is that the simulation underpredicts the abundance of OVI around low-mass galaxies. Even if small galaxies do have some periods of time when they are out of ionization equilibrium, we expect these periods to be relatively short. And since we have a large statistical sample of these smaller galaxies, it seems unlikely that short periods of non-equilibrium ionization would significantly change the overall distribution of the column density profiles for this population.
Most fundamentally, the problem likely stems from the phase structure of the CGM. Our wind velocity scaling affords a maximal enrichment scenario where the bulk of metals produced by small galaxies are retained in the CGM, a picture that agrees well with the estimates of Peeples et al. (2014). Furthermore, we expect that the mass and metallicity of the CGM should scale with galaxy mass. Hence, the only way to recover a roughly uniform OVI profile at all galaxy masses is for smaller galaxies to have a significantly higher global OVI excitation than more massive galaxies. In other words, the observations seem to require that that smaller galaxies push more of their limited oxygen into OVI, while more massive galaxies hide more of their huge oxygen reservoirs in higher ionization states. For example, if the real CGM were systematically hotter than in the simulation, it could boost the OVI abundance around small galaxies (which have large reservoirs of cool gas around them), while pushing more of the warm gas in more massive halos over the K threshold, out of OVI and into OVII, OVIII, and OIX.
One way to move in this direction would be to simply add more energy into the CGM, for example, by invoking higher energy winds. However, the wind strength is a parameter which is strongly constrained by the stellar mass function and global star-formation rate, as well as by the halo baryon fraction (see Section 4.1). Another possibility, explored by Kannan et al. (2014), is that the local radiation field can couple effectively to the CGM gas and add a photo-heating term to the thermal balance of the CGM, keeping more of the gas heated. Another, more speculative idea is that cosmic-ray heating could be significant; a process which is not captured in our present simulation. We leave exploration of these possibilities to future theoretical work.
4.3 The Passive/Star-forming OVI Bimodality and the Role of AGN in the CGM
From other studies, we know that the Illustris AGN feedback model is too extreme. Fig. 10 of Genel et al. (2014) shows that for the most massive systems the inner halo is too gas-poor. This is caused by the AGN radio mode implementation, which at late times heats the inner CGM significantly, driving out significant amounts of gas, especially around passive galaxies. X-ray observations, which are particularly sensitive to the abundance of this inner halo gas ( scales roughly as gas density squared), indicate that the AGN model is too vigorous, especially in massive ellipticals (Bogdan et al., 2015).
Given this caveat, it is interesting to note that the OVI bimodality we predict between passive and star-forming galaxies is mainly a consequence of AGN feedback. The bimodality disappears in smaller simulation volumes without AGN feedback. Indeed, Ford et al. (2015), who carried out a similar study using a physics model which incorporates a quenching mechanism that has little effect on the CGM gas, were unable to reproduce the difference in OVI equivalent width between passive and star-forming galaxies. This seems to suggest that while our AGN model is too extreme, black hole feedback may still play a role in the reduced OVI abundance around passive galaxies. In our model, AGN affect the CGM by heating the gas as well as driving gas out of the CGM. The gas excavation uniformly lowers the OVI abundance, especially at small impact parameters. The gas heating increases the average OVI ionization fraction at low impact parameter (heating cool gas into the OVI phase), while having the opposite effect at large impact parameter (heating warm virialized gas out of the OVI phase). We leave a detailed study of the OVI abundance and possible constraints on AGN feedback to future work.
In Section 3.3, we showed that local photoionization could also help explain the bimodality between passive and star-forming galaxies. AGN and local photoionization both produce a bimodality, but they act on different galaxy populations. AGN feedback acts to preferentially suppress the OVI abundance around passive galaxies, by the mechanisms described above. Conversely, local photo-ionization acts to boost the OVI abundance around star-forming galaxies by photo-ionizing the cool gas located within several tens of kpc from the galaxy. However, since the largest star-forming galaxies in the simulation already match the observed OVI column density profile (see Figure 10), this implies that the OVI boost from local radiation is small. Furthermore, the local photo-ionization scenario cannot help boost our low-mass galaxies to the observed “universal” profile, since the absolute star-formation rates of these small galaxies are generally too low to have a significant impact on circumgalactic scales.
5 Summary
In this work, we have studied the mass, temperature, and enrichment of the circumgalactic medium around galaxies of mass and with sSFR yr-1 in the Illustris simulation. We then use this analysis to explain the abundance of OVI in these environments. Our main findings are:
1. The baryon fraction of material within the virial radius of these halos decreases with increasing stellar mass. The high predicted baryon fractions () around star-forming galaxies in halos of mass matches observational constraints from Werk et al. (2014). While the baryon fraction declines with increasing stellar mass, the overall CGM mass (i.e. the mass of gas within the virial radius that is not associated with galaxies) increases monotonically with stellar mass. The baryon fraction of the halos hosting quenched galaxies is significantly lower than that of halos hosting star-forming galaxies of the same mass, owing to the more vigorous AGN radio mode which not only suppresses star formation but also drives out significant amounts of gas from the inner CGM.
2. The CGM metallicity reflects the galactic mass-metallicity relationship, with a similar slope and offset by roughly dex at all galaxy masses. However, the CGM metallicity does not vary significantly with galactic specific star-formation rate. While the simulation predicts that the CGM of more massive galaxies have a lower oxygen-to-metal ratio than low-mass systems, this difference is negligible compared to the scalings of CGM mass, metallicity, and ionization state with galaxy mass.
3. The CGM has a multiphase character at all galaxy masses. More massive galaxies reside in larger, hotter halos and also possess larger central AGN, such that they have a higher mass fraction of gas at higher temperatures. Nevertheless, even for halos with virial temperatures of K, the CGM mass fraction of gas with K is .
4. More massive galaxies have higher global OVI ionization fractions as more of the cool K gas is heated into the K range. This trend is reversed at the highest galaxy masses (), where the abundance of K gas decreases as the abundance of K material begins to dominate.
5. Since the CGM mass, metallicity, and OVI ionization fraction all increase with stellar mass, the simulation predicts that the net OVI abundance of star-forming galaxies increases significantly with stellar mass (by dex increase in OVI column density within 300 kpc of the galaxy position, for each dex increase in stellar mass). This dependence is not observed. Our model predictions match the observed OVI profiles for star-forming galaxies with , and underpredict the OVI abundance for lower-mass galaxies by dex.
6. We reproduce the observed bimodality in the OVI abundance between star-forming and quenched galaxies for galaxies of mass . This is caused by AGN feedback, which heats and drives out gas from the inner CGM. In the inner regions, cool gas is heated into the OVI phase by the AGN, while at larger radii, the virialized gas is pushed out of the OVI phase by AGN heating (as well as by the fact that at fixed stellar mass, massive quenched galaxies inhabit larger halos than do star-forming galaxies). We argue that while our AGN model is known to be too vigorous, some impact of the AGN on the CGM may be required to recover the observed bimodality.
7. The observational data suggests that the largest difference between the passive and star-forming galaxy OVI abundances occurs at kpc from the central galaxy. We argue that, distinct from the effects of AGN, another mechanism influencing the OVI bimodality may be the harder SEDs of star-forming galaxies compared to passive ones. Specifically, soft X-rays originating from processes related to young stars may enhance photoionization of cool gas near the galaxy, out to distances of tens of kpc.
We have identified a few promising observational probes which could further constrain theoretical models of galaxy formation. First, a measurement of the baryon fraction at lower halo masses would limit the strength of galactic winds (and, hence, constrain the importance of galactic recycling). Second, more measurements of the OVI column density around low-mass galaxies () would tighten constraints on the mass-dependence of the OVI absorption profile. Third, more measurements of the OVI column density are needed at intermediate distances ( 100-200 kpc) from massive star-forming and passive galaxies, to assess whether the OVI bimodality extends to these impact parameters, or is limited to kpc; such measurements would help determine if the bimodality is driven primarily by AGN feedback or local galactic radiation fields.
Acknowledgements
JS thanks Dylan Nelson for many helpful discussions and Simeon Bird for proofreading an earlier draft of this manuscript. LH acknowledges support from NASA grant NNX12AC67G and NSF grant AST-1312095.
References
- Begelman & Fabian (1990) Begelman M. C., Fabian A. C., 1990, Monthly Notices of the Royal Astronomical Society (ISSN 0035-8711), 244, 26P
- Behroozi et al. (2013) Behroozi P. S., Wechsler R. H., Conroy C., 2013, The Astrophysical Journal, 770, 57
- Bird et al. (2015) Bird S., Haehnelt M., Neeleman M., Genel S., Vogelsberger M., Hernquist L., 2015, Monthly Notices of the Royal Astronomical Society, 447, 1834
- Bird et al. (2014) Bird S., Vogelsberger M., Haehnelt M., Sijacki D., Genel S., Torrey P., Springel V., Hernquist L., 2014, Monthly Notices of the Royal Astronomical Society, 445, 2313
- Bird et al. (2013) Bird S., Vogelsberger M., Sijacki D., Zaldarriaga M., Springel V., Hernquist L., 2013, MNRAS, 429, 3341
- Bogdan et al. (2015) Bogdan A. et al., 2015, The Astrophysical Journal, 804, 72
- Cantalupo (2010) Cantalupo S., 2010, Monthly Notices of the Royal Astronomical Society: Letters, 403, L16
- Cen & Ostriker (1999) Cen R., Ostriker J. P., 1999, The Astrophysical Journal, 519, L109
- Cerviño et al. (2002) Cerviño M., Mas-Hesse J. M., Kunth D., 2002, Astronomy and Astrophysics, 392, 19
- Chen & Mulchaey (2009) Chen H.-W., Mulchaey J. S., 2009, The Astrophysical Journal, 701, 1219
- Chisholm et al. (2015) Chisholm J., Tremonti C. A., Leitherer C., Chen Y., Wofford A., Lundgren B., 2015, The Astrophysical Journal, 811, 149
- Costa et al. (2015) Costa T., Sijacki D., Haehnelt M. G., 2015, Monthly Notices of the Royal Astronomical Society: Letters, 448, L30
- Danforth et al. (2014) Danforth C. W. et al., 2014, arXiv, 1402.2655v2
- Danforth & Shull (2008) Danforth C. W., Shull J. M., 2008, The Astrophysical Journal, 679, 194
- Davé et al. (2001) Davé R. et al., 2001, The Astrophysical Journal, 552, 473
- Davé et al. (1999) Davé R., Hernquist L., Katz N., Weinberg D. H., 1999, The Astrophysical Journal, 511, 521
- Di Matteo et al. (2008) Di Matteo T., Colberg J., Springel V., Hernquist L., Sijacki D., 2008, ApJ, 676, 33
- Di Matteo et al. (2005) Di Matteo T., Springel V., Hernquist L., 2005, Nature, 433, 604
- Faucher-Giguère et al. (2009) Faucher-Giguère C.-A., Lidz A., Zaldarriaga M., Hernquist L., 2009, ApJ, 703, 1416
- Ferland et al. (2013) Ferland G. J. et al., 2013, Revista Mexicana de Astronomía y Astrofísica Vol. 49, 49, 137
- Ford et al. (2015) Ford A. B. et al., 2015, arXiv, 2084, 1503.02084
- Genel et al. (2014) Genel S. et al., 2014, Monthly Notices of the Royal Astronomical Society, 445, 175
- Heckman et al. (2002) Heckman T. M., Norman C. A., Strickland D. K., Sembach K. R., 2002, The Astrophysical Journal, 577, 691
- Hummels et al. (2013) Hummels C. B., Bryan G. L., Smith B. D., Turk M. J., 2013, Monthly Notices of the Royal Astronomical Society, 430, 1548
- Johnson et al. (2015) Johnson S. D., Chen H.-W., Mulchaey J. S., 2015, arXiv, 3263, 1503.04199v2
- Kannan et al. (2014) Kannan R. et al., 2014, Monthly Notices of the Royal Astronomical Society, 437, 2882
- Katz et al. (1996a) Katz N., Weinberg D. H., Hernquist L., 1996a, ApJ Suppl., 105, 19
- Katz et al. (1996b) Katz N., Weinberg D. H., Hernquist L., Miralda-Escude J., 1996b, ApJ, 457, L57
- Kereš et al. (2012) Kereš D., Vogelsberger M., Sijacki D., Springel V., Hernquist L., 2012, MNRAS, 425, 2027
- Liang et al. (2015) Liang C. J., Kravtsov A. V., Agertz O., 2015, arXiv, 7002, 1507.07002
- Maller & Bullock (2004) Maller A. H., Bullock J. S., 2004, Monthly Notices of the Royal Astronomical Society, 355, 694
- Martin (2005) Martin C. L., 2005, The Astrophysical Journal, 621, 227
- Narayanan et al. (2012) Narayanan A., Savage B. D., Wakker B. P., 2012, The Astrophysical Journal, 752, 65
- Nelson et al. (2015a) Nelson D., Genel S., Pillepich A., Vogelsberger M., Springel V., Hernquist L., 2015a, arXiv, 2665, 1503.02665
- Nelson et al. (2015b) Nelson D. et al., 2015b, arXiv, 362, 1504.00362
- Nelson et al. (2013) Nelson D., Vogelsberger M., Genel S., Sijacki D., Kereš D., Springel V., Hernquist L., 2013, MNRAS, 429, 3353
- Oppenheimer & Davé (2006) Oppenheimer B. D., Davé R., 2006, MNRAS, 373, 1265
- Oppenheimer & Davé (2009) Oppenheimer B. D., Davé R., 2009, MNRAS, 395, 1875
- Oppenheimer et al. (2012) Oppenheimer B. D., Davé R., Katz N., Kollmeier J. A., Weinberg D. H., 2012, MNRAS, 420, 829
- Oppenheimer & Schaye (2013) Oppenheimer B. D., Schaye J., 2013, Monthly Notices of the Royal Astronomical Society, 434, 1063
- Peeples et al. (2013) Peeples M. S., Werk J., Tumlinson J., Oppenheimer B. D., Prochaska J. X., Team C.-H., 2013, American Astronomical Society, 221
- Peeples et al. (2014) Peeples M. S., Werk J. K., Tumlinson J., Oppenheimer B. D., Prochaska J. X., Katz N., Weinberg D. H., 2014, The Astrophysical Journal, 786, 54
- Prochaska et al. (2011) Prochaska J. X., Weiner B., Chen H. W., Mulchaey J., Cooksey K., 2011, ApJ, 740, 91
- Rahmati et al. (2013) Rahmati A., Pawlik A. H., Raičević M., Schaye J., 2013, MNRAS, 430, 2427
- Rubin et al. (2014) Rubin K. H. R., Prochaska J. X., Koo D. C., Phillips A. C., Martin C. L., Winstrom L. O., 2014, The Astrophysical Journal, 794, 156
- Schaller et al. (2015) Schaller M. et al., 2015, Monthly Notices of the Royal Astronomical Society, 451, 1247
- Sembach et al. (2003) Sembach K. R. et al., 2003, The Astrophysical Journal Supplement Series, 146, 165
- Sijacki et al. (2007) Sijacki D., Springel V., Di Matteo T., Hernquist L., 2007, MNRAS, 380, 877
- Sijacki et al. (2015) Sijacki D., Vogelsberger M., Genel S., Springel V., Torrey P., Snyder G. F., Nelson D., Hernquist L., 2015, Monthly Notices of the Royal Astronomical Society, 452, 575
- Sijacki et al. (2012) Sijacki D., Vogelsberger M., Kereš D., Springel V., Hernquist L., 2012, MNRAS, 424, 2999
- Simcoe et al. (2004) Simcoe R. A., Sargent W. L. W., Rauch M., 2004, The Astrophysical Journal, 606, 92
- Smith et al. (2011) Smith B. D., Hallman E. J., Shull J. M., O’Shea B. W., 2011, The Astrophysical Journal, 731, 6
- Sparre et al. (2015) Sparre M. et al., 2015, Monthly Notices of the Royal Astronomical Society, 447, 3548
- Springel (2010) Springel V., 2010, Monthly Notices of the Royal Astronomical Society, 401, 791
- Springel et al. (2005) Springel V., Di Matteo T., Hernquist L., 2005, MNRAS, 361, 776
- Springel & Hernquist (2003) Springel V., Hernquist L., 2003, MNRAS, 339, 289
- Springel et al. (2001) Springel V., White S. D. M., Tormen G., Kauffmann G., 2001, MNRAS, 328, 726
- Stinson et al. (2012) Stinson G. S. et al., 2012, Monthly Notices of the Royal Astronomical Society, 425, 1270
- Suresh et al. (2015) Suresh J., Bird S., Vogelsberger M., Genel S., Torrey P., Sijacki D., Springel V., Hernquist L., 2015, Monthly Notices of the Royal Astronomical Society, 448, 895
- Thom & Chen (2008) Thom C., Chen H.-W., 2008, The Astrophysical Journal Supplement Series, 179, 37
- Thompson et al. (2015) Thompson T. A., Quataert E., Zhang D., Weinberg D., 2015, arXiv, 1507.04362v1
- Torrey et al. (2012) Torrey P., Vogelsberger M., Sijacki D., Springel V., Hernquist L., 2012, MNRAS, 427, 2224
- Tripp et al. (2008) Tripp T. M., Sembach K. R., Bowen D. V., Savage B. D., Jenkins E. B., Lehner N., Richter P., 2008, The Astrophysical Journal Supplement Series, 177, 39
- Tumlinson et al. (2011) Tumlinson J. et al., 2011, Science, 334, 948
- Turner et al. (2014) Turner M. L., Schaye J., Steidel C. C., Rudie G. C., Strom A. L., 2014, Monthly Notices of the Royal Astronomical Society, 445, 794
- Vogelsberger et al. (2013) Vogelsberger M., Genel S., Sijacki D., Torrey P., Springel V., Hernquist L., 2013, MNRAS, 436, 3031
- Vogelsberger et al. (2014a) Vogelsberger M. et al., 2014a, Nature, 509, 177
- Vogelsberger et al. (2014b) Vogelsberger M. et al., 2014b, Monthly Notices of the Royal Astronomical Society, 444, 1518
- Vogelsberger et al. (2012) Vogelsberger M., Sijacki D., Kereš D., Springel V., Hernquist L., 2012, MNRAS, 425, 3024
- Wakker & Savage (2009) Wakker B. P., Savage B. D., 2009, The Astrophysical Journal Supplement, 182, 378
- Weiner et al. (2009) Weiner B. J. et al., 2009, The Astrophysical Journal, 692, 187
- Werk et al. (2013) Werk J. K., Prochaska J. X., Thom C., Tumlinson J., Tripp T. M., O’Meara J. M., Peeples M. S., 2013, The Astrophysical Journal Supplement, 204, 17
- Werk et al. (2014) Werk J. K. et al., 2014, The Astrophysical Journal, 792, 8
- Wiersma et al. (2009) Wiersma R. P. C., Schaye J., Theuns T., Dalla Vecchia C., Tornatore L., 2009, MNRAS, 399, 574
- Yao et al. (2009) Yao Y., Tripp T. M., Wang Q. D., Danforth C. W., Canizares C. R., Shull J. M., Marshall H. L., Song L., 2009, The Astrophysical Journal, 697, 1784
- York et al. (2000) York D. G. et al., 2000, The Astronomical Journal, 120, 1579
- Zhu et al. (2015) Zhu Q., Hernquist L., Li Y., 2015, The Astrophysical Journal, 800, 6