Evidence against star-forming galaxies as the dominant source of
IceCube neutrinos
Abstract
The cumulative emission resulting from hadronic cosmic-ray interactions in star-forming galaxies (SFGs) has been proposed as the dominant contribution to the astrophysical neutrino flux at TeV to PeV energies reported by IceCube. The same particle interactions also inevitably create -ray emission that could be detectable as a component of the extragalactic -ray background (EGB), which is now measured with the Fermi-LAT in the energy range from 0.1 to 820 GeV. New studies of the blazar flux distribution at -ray energies above 50 GeV place an upper bound on the residual non-blazar component of the EGB. We show that these results are in strong tension with models that consider SFGs as the dominant source of the diffuse neutrino backgrounds. A characteristic spectral index for parent cosmic rays in starburst galaxies of for is consistent with the observed scaling relation between -ray and IR luminosity for SFGs, the bounds from the non-blazar EGB, and the observed -ray spectra of individual starbursts, but underpredicts the IceCube data by approximately an order of magnitude.
Subject headings:
galaxies: starburst — gamma rays: diffuse background — neutrinos1. Introduction
Extragalactic rays and high-energy neutrinos represent a census of particle acceleration and other non-thermal processes throughout the observable universe. Neutrinos in particular trace the interactions of relativistic nuclei, which are the energetically dominant component of cosmic rays (CRs). The IceCube Collaboration has now measured an astrophysical flux of neutrinos at energies from 10 TeV to PeV. This signal has been detected in various analyses and found to be consistent with an isotropic and equal-flavor flux of neutrinos that is expected from extragalactic source populations. The combined best-fit power-law flux in all flavors in the 25 TeV to 2.8 PeV energy range is (Aartsen et al., 2015a).
There are many proposed candidate sources of TeV to PeV astrophysical neutrinos. Extragalactic source candidates include galaxies with intense star formation (Loeb & Waxman, 2006; Stecker, 2007; Murase et al., 2013; He et al., 2013; Anchordoqui et al., 2014; Chang & Wang, 2014; Chang et al., 2015; Senno et al., 2015; Emig et al., 2015), cores of active galactic nuclei (AGN) (Stecker et al., 1991; Stecker, 2013; Kalashev et al., 2014), low-luminosity AGN (Bai et al., 2014; Kimura et al., 2015), blazars (Tavecchio & Ghisellini, 2015; Padovani & Resconi, 2014; Dermer et al., 2014; Padovani et al., 2015), low-power -ray bursts (GRBs) (Waxman & Bahcall, 1997; Murase & Ioka, 2013; Ando & Beacom, 2005; Tamborra & Ando, 2015), cannonball GRBs (Dado & Dar, 2014), intergalactic shocks (Kashiyama & Mészáros, 2014), and active galaxies embedded in structured regions (Berezinsky et al., 1997; Murase et al., 2008, 2013). However, no individual high-energy neutrino sources have been identified yet in a variety of different searches. Constraints from up-going track event searches in IceCube (Aartsen et al., 2014c, 2015e) imply that the source population responsible for the observed astrophysical neutrino flux has a density of Mpc-3 if the constituents are continuous emitters (Ahlers & Halzen, 2014).
Given that the same particle interactions that produce high-energy neutrinos also inevitably generate high-energy rays, multi-messenger studies can provide further insight on the origins of the IceCube signal. For example, the inelastic collisions of CR nucleons with ambient matter in interstellar and intergalactic space create pions whose decay products include energetic rays and neutrinos. This process is expected to be the dominant high-energy emission mechanism in star-forming galaxies (SFGs) and may be relevant for other hadronuclear sources, such as galaxy clusters. Several authors have jointly considered the cumulative neutrino and -ray emissions of extragalactic source populations in light of recent results from IceCube and the Large Area Telescope (LAT) on board the Fermi Gamma-ray Space Telescope (Fermi) (e.g., Murase et al., 2013; Chang & Wang, 2014; Chang et al., 2015; Tamborra et al., 2014; Ando et al., 2015).
In this study, we critically examine the hypothesis that CR induced emission in SFGs can account for a majority of the astrophysical neutrino flux measured with IceCube. We find that such a scenario is difficult to reconcile with new studies of the extragalactic -ray background (EGB) composition at energies above 50 GeV (Ackermann et al., 2016b), which are briefly reviewed in the next section. In Section 3, we compute the cumulative -ray and neutrino emission expected from the evolving population of SFGs and compare these fluxes to the -ray and neutrino data. We then consider generic CR calorimeter models in Section 4. General considerations and systematic uncertainties are discussed Section 5. Finally, we consider the implications of these multi-messenger constraints for the origin of the IceCube signal in Section 6.
2. Non-blazar component of the EGB
Significant advances have been made in our understanding of the EGB in recent years. The spectrum of the EGB has now been measured with the Fermi-LAT in the energy range from 0.1 to 820 GeV (Ackermann et al., 2015a). Meanwhile, more than one thousand extragalactic -ray sources have been individually detected, mostly blazars (Acero et al., 2015; Ackermann et al., 2015b), and multiple source classes are known to contribute to the EGB at varying levels across this broad energy range (Ajello et al., 2015; Di Mauro, 2015).
Especially rapid progress has been made in the energy range above 10 GeV, where the LAT has unprecedented sensitivity due to a combination of large collecting area ( m2), excellent angular resolution ( deg), and high background rejection efficiency. The Second Fermi Hard Source List (2FHL) includes 360 sources that are significantly detected at energies above 50 GeV in 80 months of sky-survey data (Ackermann et al., 2016a). At high Galactic latitudes (), the 2FHL catalog is dominated by AGN, which account for of the sources; are associated to specific BL Lac type blazars, and the total blazar fraction is estimated to be .
In addition to the individually resolved 2FHL sources, which comprise percent of the total EGB intensity, the flux distribution of sources fainter than the detection threshold of about ph cm-2 s-1 has been constrained by the statistical distribution of individual photons (Ackermann et al., 2016b). Specifically, the number of spatial pixels containing varying numbers of photons can provide information of the number of sources at fluxes down to about ph cm-2 s-1. The 2FHL catalog sources and pixel counting method together yield a best-fit flux distribution which is well parameterized by a broken power law with a flux break in the range ph cm-2 s-1 and a slope above and below the break equal to and , with .
The integral of this flux distribution is ph cm-2 s-1 sr-1 compared to the total EGB intensity above 50 GeV of ph cm-2 s-1 sr-1. In other words, blazars comprise of the total EGB intensity (Ackermann et al., 2016b).111Point sources with fluxes ph cm-2 s-1 produce ph cm-2 s-1 sr-1 (61% of the EGB), while ph cm-2 s-1 sr-1 (25% of the EGB) is produced by sources below that flux (Ackermann et al., 2016b). The best-fit cumulative intensity of residual emission, from both discrete extragalactic sources and truly diffuse processes, is , corresponding to an intensity of ph cm-2 s-1 sr-1 above 50 GeV. Taking uncertainties into account, the upper bound for the non-blazar fraction of the EGB is ( ph cm-2 s-1 sr-1).
Lisanti et al. (2016) performed a similar Non-Poissonian Template Fit (NPTF) of LAT data in the GeV energy range and found that point sources account for at least ( systematic uncertainty) of the total EGB intensity. The NPTF method loses sensitivity to sources below the single-photon limit, corresponding to a flux of ph cm-2 s-1 in the Lisanti et al. (2016) analysis, and therefore represents a lower bound on the point-source contribution, as a realistic source population would include contributions from members of the same population significantly below that flux threshold. We note that the contribution of sub-threshold sources inferred from the photon fluctuation analysis of Ackermann et al. (2016b) is consistent with expectations based on blazar luminosity functions (Ajello et al., 2015; Di Mauro et al., 2014b; Giommi & Padovani, 2015). Given the consistency between the results of Ackermann et al. (2016b) and Lisanti et al. (2016) above the single-photon flux threshold, we conclude that an upper bound on the non-blazar EGB fraction of 28% is reasonable.
Another photon-fluctuation analysis of LAT data in the 1 to 10 GeV energy range has been used by Zechlin et al. (2016) to constrain the abundance of sources about an order of magnitude fainter than the flux threshold of the 3FGL catalog (Acero et al., 2015). That analysis found that the high-latitude -ray sky () is composed of Galactic foreground, point sources brighter than ph cm-2 s-1, and isotropic diffuse emission (including misclassified CR backgrounds). These results further support the claim that a majority of the EGB can be attributed point sources.
3. Cumulative gamma-ray and neutrino flux from SFGs
The hadronic emission of SFGs is thought to originate from CR interactions in interstellar space, analogous to the diffuse emission observed from our own Galaxy. The residency time of CRs in a given galaxy is determined by the timescale of diffusive escape, transport by advective outflows, and hadronic interactions with ambient gas. If the loss time is dominated by diffusive escape, the hadronic emission follows a spectrum where is the effective index of the injected CR nucleon spectrum and is the index of the energy dependence of the diffusion tensor. For diffusive shock acceleration, we expect that on average , although individual accelerators in special environments might have harder spectra (Bykov et al., 2015). Typical values of considered for Galactic CR diffusion are (Kraichnan) or (Kolmogorov). Note that if CRs are accelerated in multiple source populations with different rigidity cutoffs and mass compositions, the resulting effective nucleon spectrum can have additional spectral features.
On the other hand, starburst galaxies, a subset of SFGs that undergo an episode of vigorous star formation in their central regions, have gas densities that are much higher than observed in quiescent galaxies (Tacconi et al., 2006; Sargent et al., 2012). Diffusion in starburst galaxies might also become weaker due to strong magnetic turbulence (Thompson et al., 2009; Batejat et al., 2011), while advective processes might be enhanced (Lehnert & Heckman, 1996). Since losses by inelastic collisions and advection are nearly independent of energy, the hadronic emission of starbursts is expected to follow more closely the injected CR nucleon spectrum, . Indeed, the nearby starburst galaxies detected at GeV and TeV energies (Acciari et al., 2009; Ackermann et al., 2012a; Abramowski et al., 2012; Tang et al., 2014; Peng et al., 2016; Griffin et al., 2016) exhibit harder -ray spectral indices than that of the Milky Way and other quiescent galaxies, as summarized in Table 1. Due to the harder emission and higher pion production efficiency, the starburst subset is predicted to dominate the total diffuse -ray emission of SFGs beyond a few GeV (Tamborra et al., 2014). Provided that the CR accelerators in starburst galaxies are capable of reaching per-nucleon energies exceeding PeV, the hadronic emission can also contribute significantly to the diffuse neutrino emission at PeV energies (Loeb & Waxman, 2006).
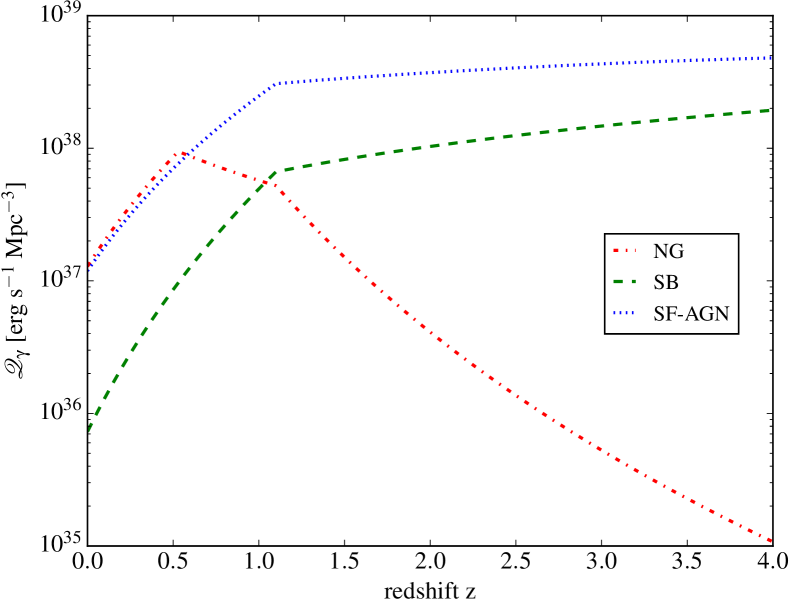
In this section we consider hadronic -ray and neutrino production in SFGs following the model of Tamborra et al. (2014). In this model the contributions of normal galaxies (NG), starburst galaxies (SB) and star-forming galaxies containing an active galactic nucleus (SF-AGN) are treated with separate luminosity functions and emission spectra. The individual -ray luminosity functions are normalized to the observed infrared (IR) luminosity function from Herschel (Gruppioni et al., 2013) using the IR--ray luminosity correlation derived by Ackermann et al. (2012a). The -ray emission spectrum for an individual source of population is assumed to follow
| (1) |
As discussed above, starburst galaxies are expected to have a hard spectral index, , whereas normal galaxies are expected to produce softer emission, . In our calculations we fix assuming a Kolmogorov-like energy dependence of CR diffusion. For the case of SF-AGN galaxies we follow the procedure of Tamborra et al. (2014) and divide the population into two sub-populations of NG-like galaxies with index and SB-like galaxies with index according to the weighting factors shown in their Table 2.
After integrating over the IR luminosity distributions of the three populations one arrives at the -ray luminosity densities that are shown in Figure 1. The -ray emission rate density can then be expressed as
| (2) |
with normalization222Our normalization condition differs from that of Tamborra et al. (2014) in that we fix the -ray luminosity in the 0.1–100GeV interval in the source reference frame. However, this has only a negligible effect for the calcuation.
| (3) |
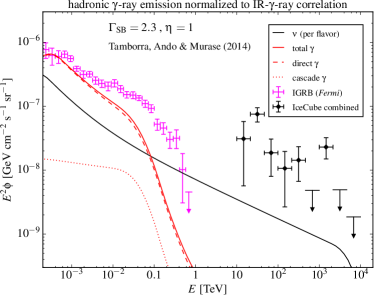
In the following, we also allow for a scaling factor in the overall normalization. The model of Tamborra et al. (2014) corresponds to , based on the observed IR--ray correlation at and the observed IR luminosity function.
rays and neutrinos are produced together in SFGs via the production and decay of energetic pions from hadronic CR interactions. The two emission rates are related as
| (4) |
where we introduce the relative charged-to-neutral pion rate . For proton-gas () collisions, we assume , corresponding to an equal contribution of , and . The average energies of rays and neutrinos are related as .
The corresponding diffuse flux of neutrinos observed at Earth is then given by the redshift integral
| (5) |
where corresponds to the Hubble parameter at redshift and we assume maximum redshift of in our calculations.
In the case of rays, we must account for interactions with cosmic radiation backgrounds between the source and the observer. Pair production from rays via scattering off photons of the cosmic microwave background (CMB) peaks at PeV energies with an absorption length of only 10 kpc. Inverse-Compton scattering of high-energy electrons and positrons with the same photon background creates secondary high-energy rays that are again above the pair-production threshold. Therefore, the super-TeV electromagnetic energy gets quickly shifted into the sub-TeV range observable with Fermi. Whereas the CMB is the main driver of these electromagnetic cascades, the final spectrum depends also on pair-production on the extragalactic background light (EBL). In the following, we adopt the model of Domínguez et al. (2011), which provides tables of the EBL spectrum in the redshift range .
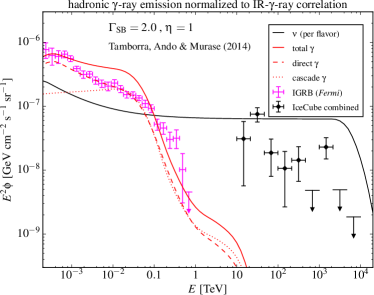
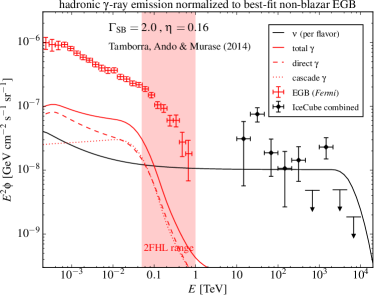
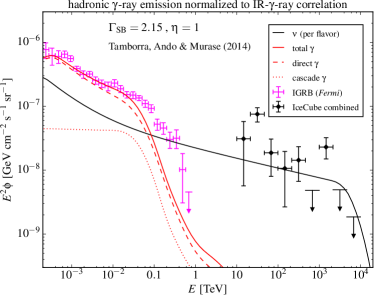
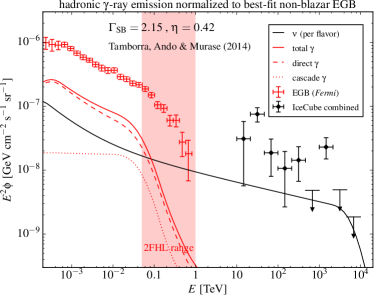
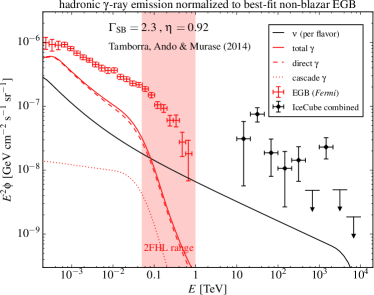
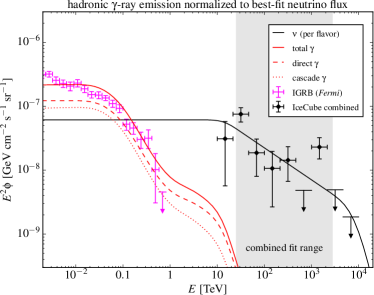
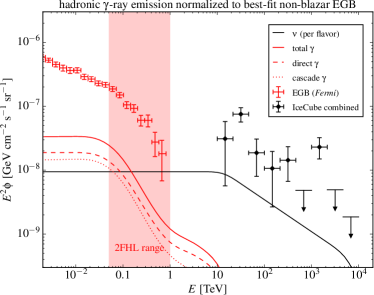
The left panels of Figure 2 show the -ray and neutrino emission for the cases with . The direct -ray and per-flavor neutrino predictions are in good agreement with the results shown in Figure 5 of Tamborra et al. (2014). Here, we also show the contribution from cascade rays that can enhance the overall emission if high-energy rays escape the galactic environment unattenuated. This extra contribution, which was not included in the Tamborra et al. (2014) analysis, becomes important for hard emission () as shown in the top left panel of Figure 2. The right panels of Figure 2 show the required renormalization () that would saturate the best-fit non-blazar EGB constraint in the energy range 0.05–1 TeV.
In the hard-spectrum scenario with , starbursts could explain the PeV neutrino data while satisfying the non-blazar EGB constraint if one allows for a rescaling of the hadronic emission by compared to the IR--ray luminosity correlation. is also harder than the observed spectra of all -ray-detected starbursts, including the ultra-luminous infrared galaxy Arp 220 (Table 1). Even in this case, the neutrino data below 100 TeV exceed the prediction. On the other hand, a soft spectrum with is consistent with , the non-blazar EGB constraint, and the -ray spectra of individual starbursts, but the TeV–PeV neutrino flux is one order of magnitude below the IceCube signal.
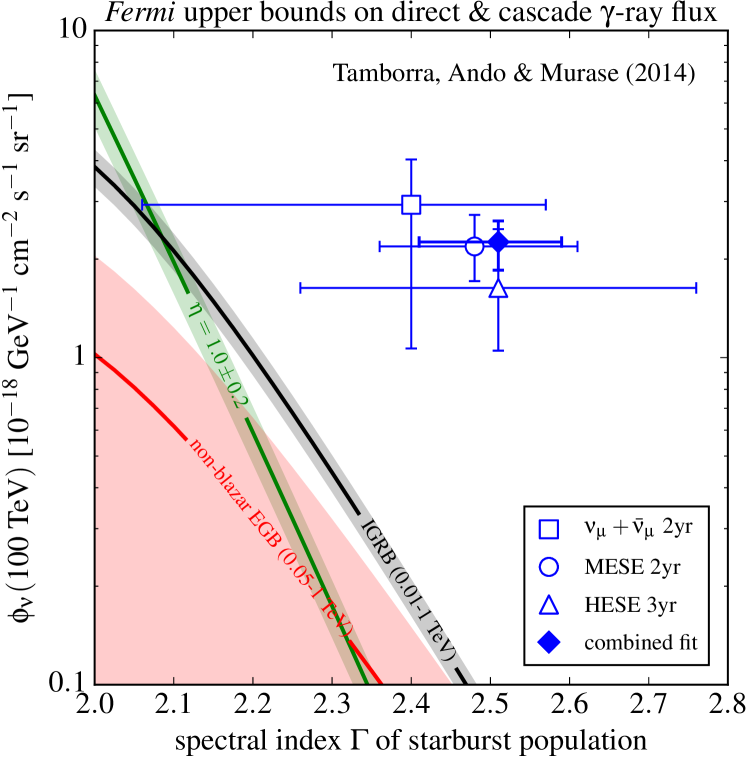
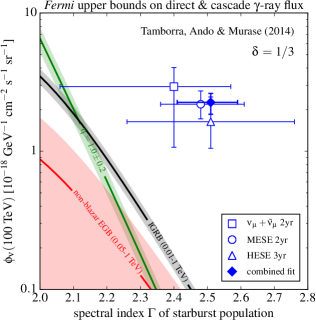
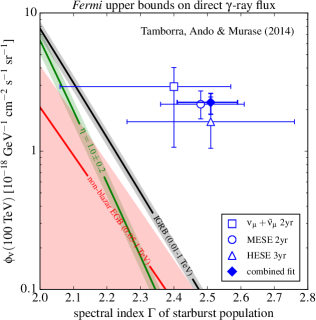
The predicted neutrino spectrum above TeV is dominated by the hard emission from starburst and SF-AGN galaxies and practically follows a power law with index . We can therefore compare the high-energy tail of the neutrino emission to the best-fit power-law model of IceCube in the following. Figure 3 shows the scan of this model over different spectral indices and per-flavor neutrino flux normalizations at TeV. In this scan we allow the scaling factor to float in order to illustrate the tension with the neutrino observation. The black and red lines show the upper limits from the IGRB (0.01–1 TeV) and from the non-blazar EGB (0.05–1 TeV), respectively, within their uncertainty bands. The data points in Figure 3 show the best-fit power-law neutrino spectrum including the 68% C.L. range in terms of the spectral index and astrophysical normalization at 100 TeV estimated by IceCube analysis: the high-energy starting event (HESE) analysis (Aartsen et al., 2014b), the medium-energy starting event (MESE) analysis (Aartsen et al., 2015b) and the classical search for up-going tracks (Aartsen et al., 2015c). The combined fit of this data is also shown as the filled data point (Aartsen et al., 2015a).
The model of Tamborra et al. (2014) with is indicated in Figure 3 as a green line, where we allow for a 20% uncertainty on the normalization of the IR--ray luminosity correlation (Ackermann et al., 2012a). As was already visible in Figure 2, the non-blazar EGB constraint (within 68% C.L.) requires softer emission with . This index is also consistent with the -ray spectra of individual starburst galaxies summarized in Table 1. In any case, the neutrino data in the 25 TeV–2.8 PeV energy range (Aartsen et al., 2015a) favors a softer power-law index and higher normalization than allowed by the non-blazar EGB constraint.
4. Generic Cosmic Ray Calorimeters
In the previous section we examined the specific case of hadronic -ray and neutrino emission from SFGs following the model of Tamborra et al. (2014). We now turn to the more general case of CR calorimeters, focusing on models motivated by the IceCube measurements. Importantly, our generic CR calorimeter scenario is not based on multiwavelength scaling relations or luminosity functions, and could be applied to any population of hadronuclear () neutrino sources that are optically thin to rays in the LAT energy range.
We approximate the cumulative neutrino spectrum (per flavor) of the population to follow a broken power law with an exponential cutoff:
| (6) |
This model is designed to give a minimal contribution to the EGB at GeV energies, assuming that the parent CR spectral index below the break is . The spectral break at 25 TeV is tuned to match the low-energy end of the neutrino data; a break at lower energies would increase the GeV -ray emission and the bounds from the non-blazar EGB would become stronger. For this generic calorimeter model we assume that the emission rate can be expressed as the product where is the redshift evolution following the star formation rate in the redshift range (Yuksel et al., 2008).
Figure 4 shows the contributions of diffuse neutrinos and the sum of direct and cascade rays for the emission spectrum of Equation (6). The left panel shows the normalization corresponding to the combined fit of neutrino data from 25 TeV to PeV (gray-shaded region) from Aartsen et al. (2015a). We find that even for a fine-tuned spectrum with a break at 25 TeV, the hadronic -ray emission is only marginally consistent with the isotropic -ray background (IGRB). The right plot shows the same emission model, but normalized to the best-fit non-blazar contribution to the EGB in the 0.05–1 TeV energy range (red-shaded region). This new limit provides a stronger bound on the maximally allowed neutrino flux.
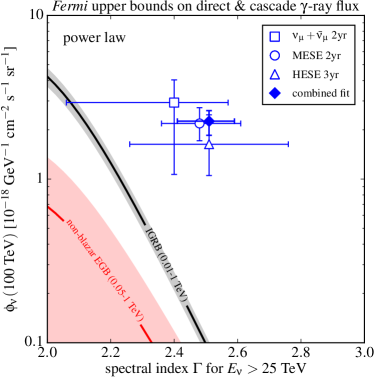
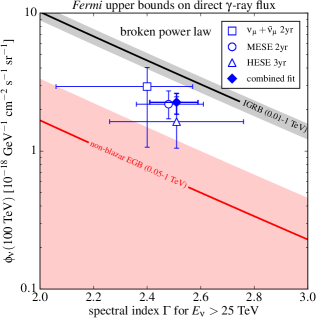
Figure 5 shows the limits on the neutrino flux normalization for different spectral indices . The left panel shows results for a simple power-law model without a break at TeV. This scenario corresponds to the method of Murase et al. (2013) and Tamborra et al. (2014) that derived strong limits on the spectral index () to explain the IceCube signal without overproducing the IGRB.
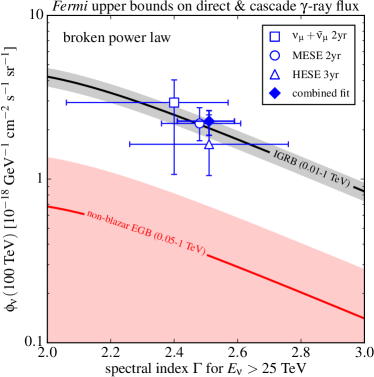
For the broken power-law model of Equation (6) with a spectral break tuned to the low-energy end of the neutrino data at 25 TeV, the limits become weaker, as shown in the right panel of Figure 5. Whereas the IGRB limit is marginally consistent with the neutrino data, the maximally allowed non-blazar EGB contribution places a strong constraint on this model.
5. General Considerations and Systematic Uncertainties
The constraints discussed in the previous two sections are conservative in several respects. First, the broken power law model for generic CR calorimeters considered in Section 4 was specifically designed to account for the IceCube signal while producing a minimal contribution to the EGB. As shown in Section 3, a realistic population of SFGs would include non-negligible contributions from quiescent galaxies with softer spectral indices, in addition to the hard component from starbursts that is most relevant for the IceCube signal (Tamborra et al., 2014). Second, any leptonic emission from SFGs would result in additional -ray emission without a neutrino counterpart. Finally, other extragalactic source populations, such as mis-aligned AGN are expected to have comparable EGB contributions to SFGs (Inoue, 2011a; Di Mauro et al., 2014a; Hooper et al., 2016). Each of these factors would imply a more stringent upper bound on the cumulative hadronic -ray emission of SFGs at energies above 50 GeV, and accordingly, a more stringent upper bound on their neutrino emission at TeV to PeV energies.
We tested several variations to our fiducial models to explore the impacts of systematic uncertainties and changing different model parameters. For the Tamborra et al. (2014) model, we considered a variation with diffusion index instead of for normal galaxies, shown in the top left panel of Figure 6. The IGRB as well as non-blazar EGB bounds become slightly stronger in this case.
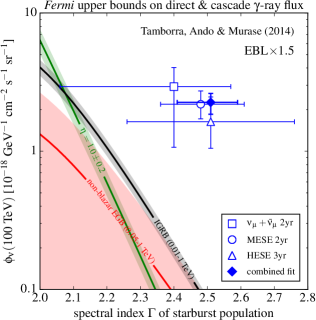
A higher EBL density at low redshift could deplete the GeV -ray spectrum and reduce the tension with the non-blazar EGB bound. We have checked that enlarging the EBL density by 50% at all redshifts — the maximum increase allowed by observations of individual blazars (Ackermann et al., 2012b) — does not substantially affect our conclusions. The corresponding bounds for the model of Tamborra et al. (2014) are illustrated in the top right panel of Figure 6.
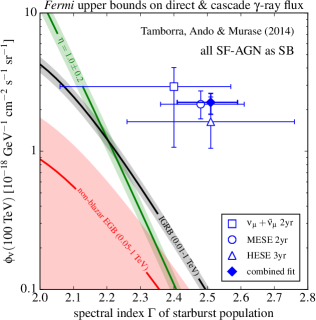
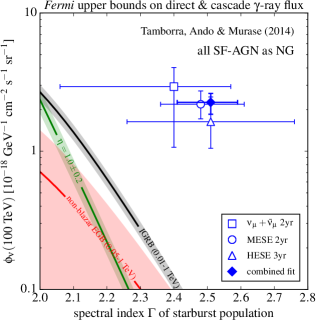
A larger fraction of soft emitting SF-AGN galaxies could also reduce the tension with the non-blazar EGB constraint. The middle right panel of Figure 6 shows a calculation assuming that all SF-AGN galaxies in the model by Tamborra et al. (2014) are treated as normal galaxies. Indeed, for this case the benchmark model is even compatible with the non-blazar EGB bound for a spectral index . However, with this model variation the predicted neutrino emission of SFGs is still in strong tension with the neutrino data. On the other hand, the middle left panel of Figure 6 shows the case of treating all SF-AGN galaxies as SB galaxies with hard emission. This model variation increases the tension of the benchmark model with -ray bounds.
Even if we only consider contributions from direct -ray emission and neglect cascade contributions, the neutrino data is only marginally consistent with the non-blazar EGB limit, as shown in the bottom panels of Figure 6 for the Tamborra et al. (2014) model (left), and the generic CR calorimeter model (right). Suppression of the cascade component could result from pair production in the intense radiation fields within the starburst itself that prevent very high energy photons from escaping (Torres, 2004; Inoue, 2011b; Chang & Wang, 2014; Yoast-Hull et al., 2015). However, the -ray opacity within starbursts is only expected to be significant at multi-TeV energies and is therefore not expected to strongly affect our constraints based on the cumulative emission of SFGs above 50 GeV. Alternatively, it has been suggested that plasma instabilities in intergalactic space might suppress cascade development (Broderick et al., 2012).
6. Conclusions
New studies of the EGB composition at energies above 50 GeV find a dominant contribution from blazars, leaving only a % residual component attributed to all other source classes, including SFGs. Motivated by this bound, we studied the cumulative hadronic -ray and neutrino emission of SFGs. Figure 3 summarizes our main result that SFGs are now disfavored as a dominant component of the IceCube astrophysical neutrino signal. Hadronic emission from SFGs that is consistent with both the IR--ray luminosity correlation and the non-blazar EGB bound requires soft emission with , matching the observed spectra of individual -ray-detected starburst galaxies. Taking the case as an example, the maximal contribution of SFGs to the best-fit diffuse neutrino background of Aartsen et al. (2015a) is at 100 TeV and at 1 PeV when saturating the upper bound (28%) on the non-blazar fraction of the EGB.
We have also studied the emission of generic CR calorimeters, allowing for hard -ray emission below 25 TeV to avoid the non-blazar EGB limit. These results are summarized in Figure 5. Following the model of Equation (6) and assuming the best-fit normalization and spectral index of Aartsen et al. (2015a), the maximal contribution of SFGs to the diffuse neutrino background between 25 TeV and 2.8 PeV is , again saturating the upper bound on the non-blazar EGB component.
The astrophysical neutrino signal reported by IceCube is the component that remains after accounting for atmospheric backgrounds, which are increasingly important towards lower energies. If the IceCube signal were substantially contaminated by unaccounted atmospheric backgrounds, our constraints on the relative contribution of SFGs to astrophysical neutrino emission would be weakened, while the absolute limits on their neutrino emission would be unchanged. However, multiple empirical (e.g., Aartsen et al., 2015b) and theoretical (e.g., Halzen & Wille, 2016) arguments disfavor this scenario, and a deep study of atmospheric backgrounds in IceCube is beyond the scope of this work.
We draw two main conclusions from the results above:
(i) The high-energy neutrino emission of several of the most prominent non-thermal extragalactic source classes is now bounded by an ensemble of multi-messenger constraints. A joint-likelihood search targeting -ray blazars finds that this population can account for 19–27% of the IceCube flux (Aartsen et al., 2016). A similar search towards GRBs excludes a contribution larger than 1% (Aartsen et al., 2015d). In this work, we argue that a third class of extragalactic sources, SFGs, is also likely a sub-dominant component. Together, these bounds imply that the sources of high-energy IceCube neutrinos are not readily traced by extragalactic -ray emitters, with the possible exception of radio galaxies. Given the tight expected connection between neutrino and -ray emission, one possibility is that the neutrinos originate from environments with high -ray opacity (Murase et al., 2016), or that the neutrinos mainly come from entirely different source classes. For example, the above constraints would be alleviated if a large Galactic contribution were present, although many of these scenarios are also disfavored (Ahlers et al., 2016). It is also possible that multiple distinct source classes have leading contributions over different parts of the TeV to PeV energy range.
(ii) An upper bound on the emission of SFGs may be encouraging for those seeking the first individual high-energy neutrino sources. Starburst galaxies are among the most numerous candidate neutrino sources (local density of Mpc-3) and therefore must be individually faint in order not to overproduce the measured neutrino flux. Given this high local density, and accounting for cosmic evolution, the cumulative emission of SFGs is predicted to be nearly isotropic even on small angular scales (Ahlers & Halzen, 2014). Also, the neutrino emission of individual SFGs is expected to be steady over Myr timescales given the lifetime of CRs in the interstellar medium, and therefore no distinctive signatures in the time domain are available to enhance sensitivity to individual sources. For these reasons, if SFGs were the main component of the diffuse neutrino background, the prospects for detecting individual neutrino sources would be rather bleak, requiring an exposure substantially larger than can be achieved with IceCube or even proposed next-generation neutrino telescopes such as IceCube-Gen2 (Aartsen et al., 2014a) and KM3NeT (Adrian-Martinez et al., 2016). The present results largely exclude that scenario, and therefore keep open the possibility that source classes with more conspicuous small-angle anisotropy signals and/or temporal variations may be found in the near future.
Note Added.—After the submission of this work, Kistler (2015) also pointed out the difficulty of reconciling the high neutrino intensity observed at TeV energies and the limits set by the EGB for extragalactic sources.
Acknowledgments.—We acknowledge helpful discussions with Kohta Murase and Markus Ackermann. We also thank two anonymous referees who encouraged us to broaden the scope of this work to include a more realistic SFG population model. A third referee gave constructive feedback on the presentation of these results. MA is supported by the National Science Foundation under grants OPP-0236449 and PHY-0236449.
References
- Aartsen et al. (2014a) Aartsen, M. G., Ackermann, M., Adams, J., et al. 2014a, ArXiv e-prints, arXiv:1412.5106
- Aartsen et al. (2014b) —. 2014b, Physical Review Letters, 113, 101101
- Aartsen et al. (2014c) —. 2014c, ApJ, 796, 109
- Aartsen et al. (2015a) Aartsen, M. G., Abraham, K., Ackermann, M., et al. 2015a, ApJ, 809, 98
- Aartsen et al. (2015b) Aartsen, M. G., Ackermann, M., Adams, J., et al. 2015b, Phys. Rev. D, 91, 022001
- Aartsen et al. (2015c) Aartsen, M. G., Abraham, K., Ackermann, M., et al. 2015c, Physical Review Letters, 115, 081102
- Aartsen et al. (2015d) Aartsen, M. G., Ackermann, M., Adams, J., et al. 2015d, ApJ, 805, L5
- Aartsen et al. (2015e) —. 2015e, Astroparticle Physics, 66, 39
- Aartsen et al. (2016) Aartsen, M. G., Abraham, K., Ackermann, M., et al. 2016, ArXiv e-prints, arXiv:1611.03874
- Abramowski et al. (2012) Abramowski, A., Acero, F., Aharonian, F., et al. 2012, ApJ, 757, 158
- Acciari et al. (2009) Acciari, V. A., Aliu, E., Arlen, T., et al. 2009, Nature, 462, 770
- Acero et al. (2015) Acero, F., Ackermann, M., Ajello, M., et al. 2015, ApJS, 218, 23
- Ackermann et al. (2012a) Ackermann, M., Ajello, M., Allafort, A., et al. 2012a, ApJ, 755, 164
- Ackermann et al. (2012b) —. 2012b, Science, 338, 1190
- Ackermann et al. (2015a) Ackermann, M., Ajello, M., Albert, A., et al. 2015a, ApJ, 799, 86
- Ackermann et al. (2015b) Ackermann, M., Ajello, M., Atwood, W. B., et al. 2015b, ApJ, 810, 14
- Ackermann et al. (2016a) —. 2016a, ApJS, 222, 5
- Ackermann et al. (2016b) Ackermann, M., Ajello, M., Albert, A., et al. 2016b, Physical Review Letters, 116, 151105
- Adrian-Martinez et al. (2016) Adrian-Martinez, S., et al. 2016, arXiv:1601.07459
- Ahlers et al. (2016) Ahlers, M., Bai, Y., Barger, V., & Lu, R. 2016, Phys. Rev., D93, 013009
- Ahlers & Halzen (2014) Ahlers, M., & Halzen, F. 2014, Phys. Rev., D90, 043005
- Ajello et al. (2015) Ajello, M., Gasparrini, D., Sánchez-Conde, M., et al. 2015, Astrophys.J., 800, L27
- Anchordoqui et al. (2014) Anchordoqui, L. A., Paul, T. C., da Silva, L. H. M., Torres, D. F., & Vlcek, B. J. 2014, Phys.Rev., D89, 127304
- Ando & Beacom (2005) Ando, S., & Beacom, J. F. 2005, Phys.Rev.Lett., 95, 061103
- Ando et al. (2015) Ando, S., Tamborra, I., & Zandanel, F. 2015, Phys. Rev. Lett., 115, 221101
- Bai et al. (2014) Bai, Y., Barger, A., Barger, V., et al. 2014, Phys.Rev., D90, 063012
- Batejat et al. (2011) Batejat, F., Conway, J. E., Hurley, R., et al. 2011, Astrophys. J., 740, 95
- Berezinsky et al. (1997) Berezinsky, V., Blasi, P., & Ptuskin, V. 1997, Astrophys J., 487, 529
- Broderick et al. (2012) Broderick, A. E., Chang, P., & Pfrommer, C. 2012, Astrophys. J., 752, 22
- Bykov et al. (2015) Bykov, A. M., Ellison, D. C., Gladilin, P. E., & Osipov, S. M. 2015, Mon. Not. Roy. Astron. Soc., 453, 113
- Chang et al. (2015) Chang, X.-C., Liu, R.-Y., & Wang, X.-Y. 2015, Astrophys. J., 805, 95
- Chang & Wang (2014) Chang, X.-C., & Wang, X.-Y. 2014, Astrophys.J., 793, 131
- Dado & Dar (2014) Dado, S., & Dar, A. 2014, Phys.Rev.Lett., 113, 191102
- Dermer et al. (2014) Dermer, C. D., Murase, K., & Inoue, Y. 2014, JHEAp, 3-4, 29
- Di Mauro (2015) Di Mauro, M. 2015, Phys.Rev., D91, 123001
- Di Mauro et al. (2014a) Di Mauro, M., Calore, F., Donato, F., Ajello, M., & Latronico, L. 2014a, Astrophys. J., 780, 161
- Di Mauro et al. (2014b) Di Mauro, M., Donato, F., Lamanna, G., Sanchez, D. A., & Serpico, P. D. 2014b, Astrophys. J., 786, 129
- Domínguez et al. (2011) Domínguez, A., Primack, J. R., Rosario, D. J., et al. 2011, MNRAS, 410, 2556
- Emig et al. (2015) Emig, K., Lunardini, C., & Windhorst, R. 2015, JCAP, 1512, 029
- Giommi & Padovani (2015) Giommi, P., & Padovani, P. 2015, Mon. Not. Roy. Astron. Soc., 450, 2404
- Griffin et al. (2016) Griffin, R. D., Dai, X., & Thompson, T. A. 2016, arXiv:1603.06949
- Gruppioni et al. (2013) Gruppioni, C., Pozzi, F., Rodighiero, G., et al. 2013, MNRAS, 432, 23
- Halzen & Wille (2016) Halzen, F., & Wille, L. 2016, Phys. Rev. D, 94, 014014
- He et al. (2013) He, H.-N., Wang, T., Fan, Y.-Z., Liu, S.-M., & Wei, D.-M. 2013, Phys.Rev., D87, 063011
- Hooper et al. (2016) Hooper, D., Linden, T., & Lopez, A. 2016, arXiv:1604.08505
- Inoue (2011a) Inoue, Y. 2011a, Astrophys. J., 733, 66
- Inoue (2011b) —. 2011b, Astrophys. J., 728, 11
- Kalashev et al. (2014) Kalashev, O., Semikoz, D., & Tkachev, I. 2014, JETP, 147, arXiv:1410.8124
- Kashiyama & Mészáros (2014) Kashiyama, K., & Mészáros, P. 2014, Astrophys.J., 790, L14
- Kimura et al. (2015) Kimura, S. S., Murase, K., & Toma, K. 2015, Astrophys. J., 806, 159
- Kistler (2015) Kistler, M. D. 2015, arXiv:1511.01530
- Lehnert & Heckman (1996) Lehnert, M. D., & Heckman, T. M. 1996, ApJ, 462, 651
- Lisanti et al. (2016) Lisanti, M., Mishra-Sharma, S., Necib, L., & Safdi, B. R. 2016, ArXiv e-prints, arXiv:1606.04101
- Loeb & Waxman (2006) Loeb, A., & Waxman, E. 2006, JCAP, 0605, 003
- Murase et al. (2013) Murase, K., Ahlers, M., & Lacki, B. C. 2013, Phys.Rev., D88, 121301
- Murase et al. (2016) Murase, K., Guetta, D., & Ahlers, M. 2016, Phys. Rev. Lett., 116, 071101
- Murase et al. (2008) Murase, K., Inoue, S., & Nagataki, S. 2008, Astrophys.J., 689, L105
- Murase & Ioka (2013) Murase, K., & Ioka, K. 2013, Phys.Rev.Lett., 111, 121102
- Padovani et al. (2015) Padovani, P., Petropoulou, M., Giommi, P., & Resconi, E. 2015, Mon. Not. Roy. Astron. Soc., 452, 1877
- Padovani & Resconi (2014) Padovani, P., & Resconi, E. 2014, Mon.Not.Roy.Astron.Soc., 443, 474
- Peng et al. (2016) Peng, F.-K., Wang, X.-Y., Liu, R.-Y., Tang, Q.-W., & Wang, J.-F. 2016, Astrophys. J., 821, L20
- Sargent et al. (2012) Sargent, M. T., Bethermin, M., Daddi, E., & Elbaz, D. 2012, Astrophys. J., 747, L31
- Senno et al. (2015) Senno, N., Mészáros, P., Murase, K., Baerwald, P., & Rees, M. J. 2015, Astrophys. J., 806, 24
- Stecker et al. (1991) Stecker, F., Done, C., Salamon, M., & Sommers, P. 1991, Phys.Rev.Lett., 66, 2697
- Stecker (2007) Stecker, F. W. 2007, J. Phys. Conf. Ser., 60, 215
- Stecker (2013) —. 2013, Phys.Rev., D88, 047301
- Tacconi et al. (2006) Tacconi, L. J., Neri, R., Chapman, S. C., et al. 2006, ApJ, 640, 228
- Tamborra & Ando (2015) Tamborra, I., & Ando, S. 2015, JCAP, 1509, 036
- Tamborra et al. (2014) Tamborra, I., Ando, S., & Murase, K. 2014, JCAP, 1409, 043
- Tang et al. (2014) Tang, Q.-W., Wang, X.-Y., & Thomas Tam, P.-H. 2014, Astrophys. J., 794, 26
- Tavecchio & Ghisellini (2015) Tavecchio, F., & Ghisellini, G. 2015, Mon. Not. Roy. Astron. Soc., 451, 1502
- Thompson et al. (2009) Thompson, T. A., Quataert, E., & Murray, N. 2009, Mon. Not. Roy. Astron. Soc., 397, 1410
- Torres (2004) Torres, D. F. 2004, Astrophys. J., 617, 966
- Waxman & Bahcall (1997) Waxman, E., & Bahcall, J. N. 1997, Phys.Rev.Lett., 78, 2292
- Yoast-Hull et al. (2015) Yoast-Hull, T. M., Gallagher, J. S., & Zweibel, E. G. 2015, Mon. Not. Roy. Astron. Soc., 453, 222
- Yuksel et al. (2008) Yuksel, H., Kistler, M. D., Beacom, J. F., & Hopkins, A. M. 2008, Astrophys.J., 683, L5
- Zechlin et al. (2016) Zechlin, H.-S., Cuoco, A., Donato, F., Fornengo, N., & Vittino, A. 2016, ApJS, 225, 18