Stable hybrid stars within a SU(3) Quark-Meson-Model
Abstract
The inner regions of the most massive compact stellar objects might be occupied by a phase of quarks. Since the observations of the massive pulsars PSR J1614-2230 and of PSR J0348+0432 with about two solar masses, the equations of state constructing relativistic stellar models have to be constrained respecting these new limits. We discuss stable hybrid stars, i.e. compact objects with an outer layer composed of nuclear matter and with a core consisting of quark matter (QM). For the outer nuclear layer we utilize a density dependent nuclear equation of state and we use a chiral SU(3) Quark-Meson model with a vacuum energy pressure to describe the objects core. The appearance of a disconnected mass-radius branch emerging from the hybrid star branch implies the existence of a third familiy of compact stars, so called twin stars. Twin stars did not emerge as the transition pressure has to be relatively small with a large jump in energy density, which could not be satisfied within our approach. This is, among other reasons, due to the fact that the speed of sound in QM has to be relatively high, which can be accomplished by an increase of the repuslive coupling. This increase on the other hand yields too high transition pressures for twins stars to appear.
I Introduction
A proto-compact star is formed in the aftermath of a supernova explosion,
which is one of the most extreme events to occur in the universe. At low
temperature and finite baryon density these objects contain the densest matter
known to mankind, which exceeds even nuclear density
( g/cm3).The recent measurements of the
massive pulsars PSR J1614-2230 Demorest et al. (2010) and of PSR J0348+0432
Antoniadis et al. (2013) with about two solar masses exceed the highest
measured pulsar mass of PSR 1913+16 with by far
Hulse and Taylor (1975). This new mass limit sets constraints on the equation of state of
dense matter within compact stellar objects. The repulsive effect of the strong
interaction triples the maximum obtainable mass compared to a non-interacting
Fermi gas of neutrons Zdunik and Haensel (2013a). An appropriate EoS therefore should
yield solutions for compact stars with and illustrates
likewise the importance of the incorporated interactions.
Spherically symmetric compact stars are generally described by
the Tolman-Oppenheimer-Volkoff equations (TOV equations) Tolman (1934).
These equations can be derived by solving the Einstein field equations
| (1) |
where is the Einstein tensor, a contraction of the Rieman curvature tensor, called Ricci tensor, R being the curvature scalar and the energy-momentum tensor of a relativistic fluid. Under the above mentioned assumptions one arrives at
| (2) | |||||
in units where .
The solutions of these equations are determined by different equations of state
(EoS), and the entire collection of masses and corresponding radii is called the
mass-radius
relation (MR) of compact stars Sagert et al. (2006).
For each EoS, , where p is the pressure and
the corresponding energy density at a given radius r, exists a
solution which is parametrized by , the central pressure of the star.
Two different types of compact stars containing quark matter ought to be
considered. The first one is based on the idea that the appearence of the
strange quark lowers the energy per baryon and consequently forms the true
ground state of nuclear matter, i.e. forms the whole star
Itoh (1970); Bodmer (1971); Witten (1984). The resulting object is
called a pure quark star and has been entirely discussed within the SU(3) model
in Zacchi et al. (2015).
The second one is called a hybrid star, where a quark matter (QM) core is
surrounded by an outer crust of hadronic matter (HM). The transition from
nuclear matter to quark matter can occur either in a mixed phase (Gibbs
construction) or, assuming that there exists a first order
phase transition at , at a sharp transition (Maxwell construction).
Now, the particle transformations described by the EoS may influence the compressibility of
the star, which can affect the stability. Is this effect
significantly enough to alter the properties of the resulting
compact object, i.e. give rise to a third family of degenerate stars, so called twin stars?
These objects would again be stable at a smaller radius but similar mass as the former compact star.
A possible evidence of twin stars goes along with a discontinuity in the EoS.
Kämpfer (1981a, b, 1982, 1983a, 1983b, 1985); Glendenning and Kettner (2000); Schertler et al. (2000); Blaschke and Alvarez-Castillo (2015).
In this article we study various EoS and their solutions within the TOV
equations using a Maxwell construction. A stable hybrid star configuration with
is given, if the mass of the star continues to increase after the quark matter
core appears Alford et al. (2014, 2015); Alford and Han (2015).
As soon as the mass decreases with larger central pressures, the configurations become unstable.
If the mass then, after decreasing, increases again with
larger , a stable twin star configuration would have been established.
This behaviour is determined by the energy discontinuity
between the two EoS and the speed of sound within the object.
The works of Alford et. al Alford et al. (2014, 2015); Alford and Han (2015)
confirmed that a stable connected hybrid star branch
emerges from the hadronic branch if the energy density discontinuity is less
than a critical value. They used a
constant speed of sound parametrization within the fields correlator
method for the QM EoS to provide a general framework for empirical testing
and comparison. The recent observations of the -stars
Demorest et al. (2010); Antoniadis et al. (2013) constraints
the constant speed of sound parametrization. A stiffer HM EoS and
for the QM EoS yields solutions with star sequences
in their approach. In this work we will work with a density dependent (DD2)
nuclear matter EoS Typel et al. (2010) for the outer layers of the star and a
chiral SU(3) EoS derived from the Quark-Meson model Zacchi et al. (2015) for
the stars core. In Zacchi et al. (2015) pure quark star
configurations for a small parameter rage were found, in this model all other solutions
were hybrid stars completely buildt of a mixed phase of HM and QM.
We scan the same parameters of the SU(3) EoS as in Zacchi et al. (2015)
to look for possible twin stars emerging from a stable hybrid star.
II The models
According to lattice QCD calculations, the phase transition at high baryonic densities is of first order Fodor and Katz (2002); Fodor (2007); Alvarez-Castillo and Blaschke (2013). Based on this assumption the transition from hadronic matter to quark matter is described via a Maxwell construction Glendenning (1992); Bhattacharyya et al. (2004, 2010). The quark-meson model couples mesons as mediators of the strong interaction to quarks utilizing chiral symmetry Koch (1997) via a Yukawa type coupling. The coupled equations of motions of the meson fields derived from the grand canonical potential have to be solved self-consistently and determine finally the EoS. Possible resulting pure quark stars emerging from the chiral SU(3) Quark Meson model have been discussed entirely in Zacchi et al. (2015) such as the derivation of the EoS.
II.0.1 Chiral Quark Meson Model
The SU(3) Lagrangian of the chiral quark-meson model reads
for chiral symmetry incorporating the scalar () and
vector () meson nonet. Here, stands for the vacuum mass of the
vector mesons and , , , and are the standard
parameters of the linear model
Törnqvist (1997); Koch (1997); Lenaghan et al. (2000); Parganlija et al. (2013).
The matrix describes the explicit breaking of chiral symmetry. The
quarks couple to the meson fields via Yukawa-type interaction terms with the
couplings strengths and for scalar and vector mesons,
respectively.
The energy density and the pressure are then determined to
and
where the indices nnonstrange (up- and down quarks) and sstrange quarks. For the coulings and masses of the included fields standard values are assumed. A detailled treatment on the parameters can be found in Koch (1997); Lenaghan et al. (2000); Schaefer and Wagner (2009); Zacchi et al. (2015). Since the properties of the reviewed hybrid stars depends only on the parameters of the quark sector, a broader overview shall be given compared to the nuclear matter parameter range. However, four parameters can be varied:
-
1.
The constituent quark mass determines the scalar coupling for the nonstrange and strange condensate via the Goldberger-Treiman relation: and , where is adoped from SU(3) symmetry considerations.
-
2.
The vector coupling is independent of the constituent quark mass, it will be varied in the scale of the scalar coupling, , to study its influences in an appropriate range. The strange coupling of the -meson is fixed by SU(3) symmetry.
- 3.
-
4.
The Bag constant B models the confinement and can be interpreted as a vacuum energy density term. The fields are independent of its variation, its impact is to stiffen or soften the EoS. Physically reasonable ranges within this context are MeV MeV.
III Hybrid Stars
At large densities hadronic matter is expected to undergo two phase transitions. The first one deconfines hadrons to quarks and gluons. Note that in a strict sense neither the deconfinement phase transition nor the chiral phase transition can be described by an order parameter based on underlying symmetries of QCD. The second one restores chiral symmetry. Yet it is an unsettled issue wheter these transitions are real phase transitions or crossover transitions Schertler et al. (1999). We will study and compare various models at ultrahigh densities to search for differences and similarities as well as their resulting predictions for compact objects, i.e. the mass-radius relation.
III.1 Construction of the phase transition
The study of the deconfined phase transition is related to the mixed phase.
It has been suggested, that the mixed phase in compact objects behaves more in accordance
with the Maxwell construction than with the Gibbs construction
Maruyama et al. (2006); Bhattacharyya et al. (2010); Hempel et al. (2013).
Furthermore it is more likely that twin stars appear within the Maxwell construction, according to Bhattacharyya et al. (2010).
In this article we thus utilize a Maxwell construction due to the above mentioned reasons.
In refs Alford et al. (2014, 2015); Alford and Han (2015) the QM EoS was parametrized
a relatively simple
form (see eq. 11) and the transition from HM to QM can be constructed
without any constraints concerning the chemical potential. Our approach on the
other hand needs to take into account the pressure as function of the chemical
potential to find the thermodynamically justified
transition pressure (see fig. 11 and the discussion there).
In electrically neutral stellar matter baryon number and charge have to be
conserved quantities. Under this assumption the chemical potential of species i
can be defined as
| (7) |
where is the baryon number and the charge in units of the electron charge and and are the baryonic and electric chemical potentials respectively. Note, that strangeness is not a conserved quantity. The phase transition from HM to QM produces a mixed phase. Now, the Gibbs condition requires that the coexisting phases have opposite charge and it might also happen that the mixed phase is energetically too expensive Bhattacharyya et al. (2010); Maruyama et al. (2006). Then the two phases are in direct contact with each other, which corresponds to a Maxwell construction, where
| (8) | |||||
| (9) |
The baryon chemical potential is continuous, but jumps at the interface
of the two phases, so that the phase transition takes place if the pressure of
the QM phase equals the pressure of the HM phase at a given baryo-chemical
potential . The MC corresponds to
constant pressure in the energy density interval of the mixed phase, whereas the
pressure increases with baryon density in the GC.
However, the existence of a quark phase in a compact star requires the
transition pressure to be smaller than the central pressure of the star, which
is valid for the MC and also for the GC.
III.2 Stability Criteria
As long as the mass of the star is an increasing function of the compact object will be stable. Since a hybrid star contains a QM-core, there exists a threshold value in the jump in energy density which determines the stars stability when the QM-core first appears.
| (10) |
where and are the values of the energy density and pressure
at the phase transition. For a derivation and discussion of
(10) see Seidov (1971); Kämpfer (1981a, b, 1982, 1983c, 1983a); Schaeffer and Haensel (1983); Lindblom (1998).
For a high value of the cusp in the MR relation is hardly
detectable and in the range of in agreement with
Lindblom (1998); Alford et al. (2014); Blaschke and Alvarez-Castillo (2015), i.e. shortly after the
QM core appears the QM core is unable to counteract the gravitational attraction
from the HM and the star becomes unstable.
IV Results
The appearence of a QM core within a compact star is entirely determined by the transition pressure and the discontinuity in the energy density . If the pressure within the star lies below the transition pressure, the object would be entirely determined by the HM EoS and could not be classified as a hybrid star. The relation as a function of will become important in context with eq. (10) when investigating for connected or disconnected hybrid star branches Alford et al. (2014, 2015); Alford and Han (2015).
IV.1 Various EoS and the corresponding mass-radius relations for fixed B and different
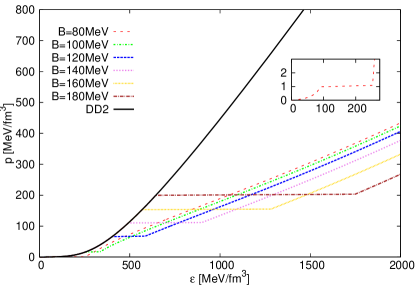
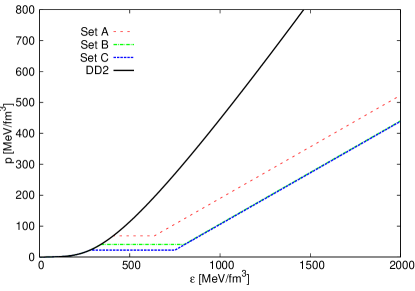
Figure 1 shows the total hybrid EoS for a fixed value of the
vacuum pressure B MeV while varying the vector coupling constant from
.
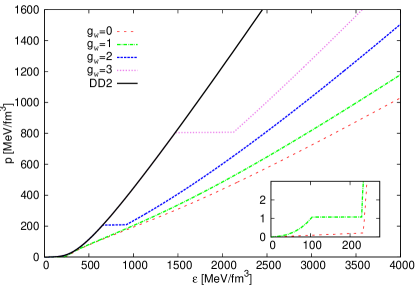
For increasing values of the repulsive coupling the transition pressure
increases due to a stiffening in the QM EoS.
The case corresponds to a transition from HM to QM at
.
A transition occuring below saturation energy density is clearly unphysical and shall
therefore not be discussed any further
(see upper x axis in fig 10).
For the transition occurs at and
(see inlaid figure in fig. 1).
The discontinuity in energy density here
is . In this case
, see also fig. 10,
which corresponds to the leftmost data point on the line.
Note that in fig. 1 and in all following graphics the pure
HM results are shown as a reference, denoted as “DD2”.
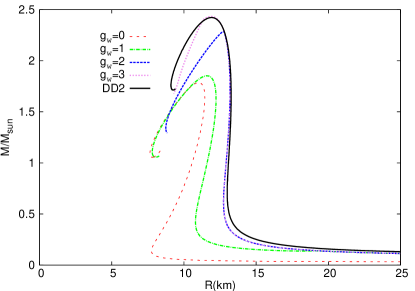
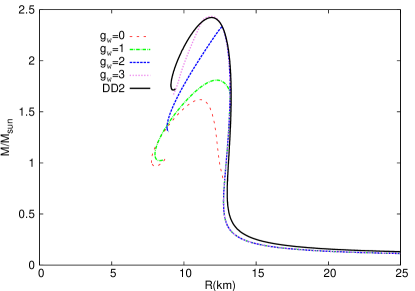
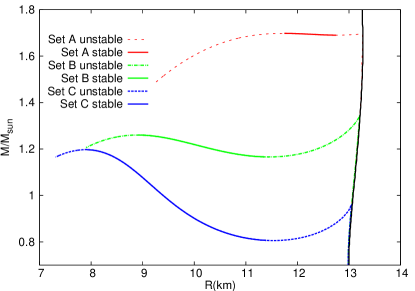
The corresponding mass-radius relation is shown in fig. 2.
For the phase transition from HM to QM does not destabilize the
star for a relatively wide range in mass, i.e. the emerging QM core gets larger while
the hybrid star manages to stay stable up to . This
behaviour is very similar to the one of the hadronic mode “DD2”, but shifted
to smaller masses and radii.
A repulsive coupling of on the other hand results in
a connected hybrid star branch hardly detectable compared to
and with a similar trend as the “DD2” case, but with solutions
reaching .
For the transition sets in at already unstable configurations
for the pure nuclear matter case.
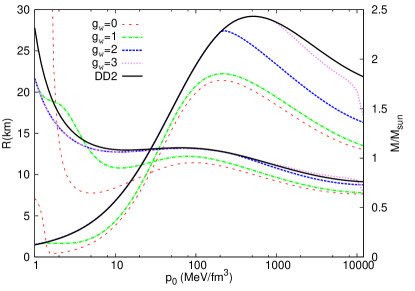
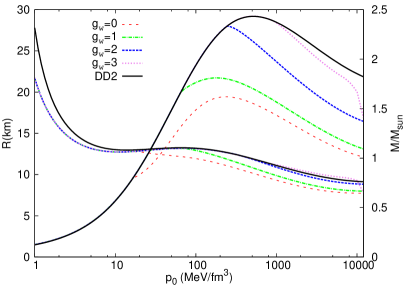
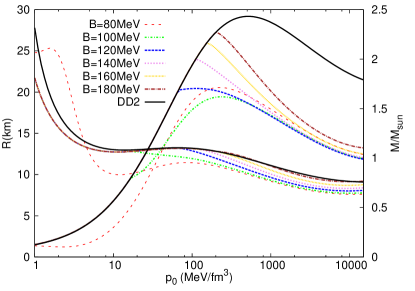
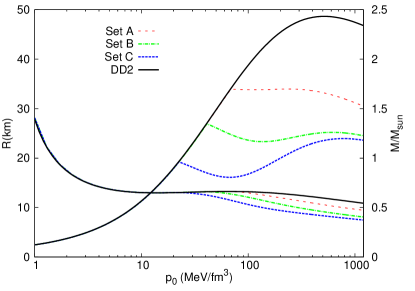
Figure 3 displays the radius- and mass curves as fuction of
with MeV while varying at MeV and
MeV. The curves starting in the upper left region are the radius
curves for a given value of . The curves starting on the lower left
side are the mass curves. The associated x-axis in fig. 3 shows the
pressure pertaining to both curves.
The curves leave the hadronic “DD2” reference line at the respective transition pressure
and, still rising, yielding stable hybrid star solutions. Unstable solutions can be read off
from the point on where the mass decreases with increasing pressure.
These features are valid for all following radius- and mass curves as
fuction of .
Figure 3 substantiates the hithero discussion regarding the
increase of the repulsive coupling by depicting up to which central pressure
the hybrid star configurations stay stable:
With higher repulsive coupling, the appearing hybrid star configurations become
unstable, i.e. the smaller the resulting QM core, though the masses are significantly higher.
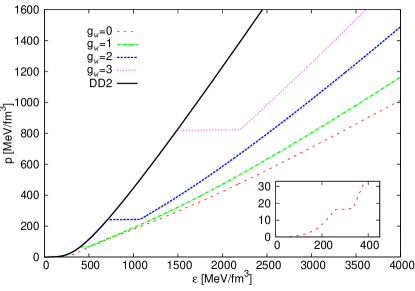
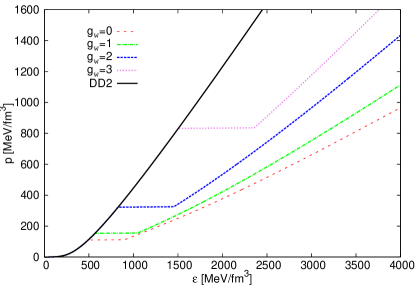
Figure 4 shows the EoS for MeV.
The transition pressure increases with an associate increase of
the jump in energy density.
For with fixed MeV the respective values are
, MeV and
, see inlaid figure in figure 4
and see fig. 10 for
respectively.
For and MeV we find ,
and at
, see also fig. 10.
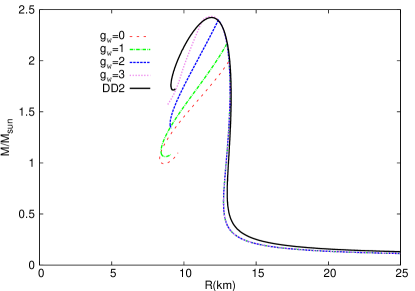
The resulting mass-radius relations for these EoS are shown in fig. 5. Increasing further the repulsive coupling leads to hybrid star configurations, which do not support a stable QM core (). The trends of the curves obviously show differences to the MeV parameter choice. The transiton pressures for MeV are higher compared to the MeV case, see figs. 3 and 6, and the appearing QM core does destabilize the configurations.
The QM core for appears at at a radius of
km, see fig. 6 where the mass and radius lines leaves the
hadronic “DD2” reference line. The star does not get unstable up to at a
radius of km.
The QM core for appears at . The hybrid
star configurations stay stable up to , see
figs. 5 and 6. The appearance
of the QM core at destabilizes the star configurations faster
than in the case for MeV.
The EoS for MeV is shown in fig. 7. It shows an
increase of the transition pressure as expected.
The discontinuity in energy density increases too, but displays a nontrivial relation to which can be observed in greater detail in the phase diagram shown in fig. 10.
The resulting mass-radius curve for MeV is shown in fig. 8. A hybrid star branch appears but is hardly noticable. As already mentioned, the transitions for a value of sets in at an already unstable configurations, i.e. no stable hybrid star branch at all emerges.
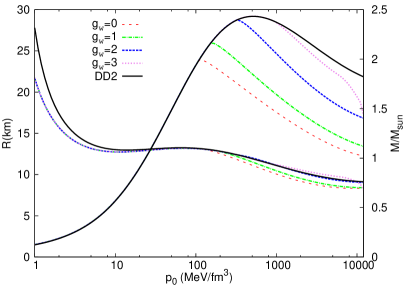
Fig. 9 shows the corresponding radius- and mass curve
as function of the central pressure. The hybrid star configurations follow the
“DD2” curve, and become unstable nearly immediately after the appearance of
the QM core. The repulsive force in the QM EoS is not strong enough to support a
large hadronic mantle. The star would collapse having a too large QM core.
Generally speaking: Raising the value of the vacuum pressure leads to hybrid
star branches where the hybrid stars destabilize faster after
the appearence of the QM core, and the transition occurs at higher masses.
The phase diagram displayed in figure 10 depicts the ratio
of pressure to energy density at the transition of hadronic matter
versus the discontinuity in energy density at the transition.
The upper x axis displays the corresponding central energy density in units of
nuclear energy density .
The transition for small values of B and occurs at a too small
central energy density . For large values of
B and a small repulsive coupling the transition occurs at times nuclear
saturation density. Within the range MeV the transition
for zero repulsion stays below the constraint line, given by
eqn. 10. It is interesting to note that all curves converse
in an area at around and
where the central energy
density is times nuclear saturation density (even for higher values of
not displayed here).
Figure 11 displays the pressure as a function of the chemical
potential for the parameter choice MeV, MeV
and MeV while varying .
The intersecting point between the
HM-and the QM curve indicates where the transition pressure for a given choice
of parameters is located.
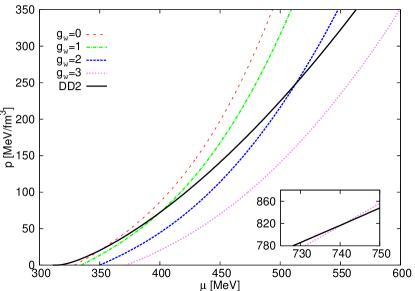
The inlaid figure shows the intersection for the case, which is out of the plot range.
The intersection for takes place at and MeV and for at and MeV, see also figs. 4 and 6. It is interesting to note that the a stiffer EoS has a “softer” behaviour in the plane. Softer means here that for larger values of both, pressure and increase, i.e. the intersection takes place at a higher pressure. That corresponds to a transition from HM to QM at a higher central energy density in terms of nuclear energy density, see figs. 10 and 16 for comparison (upper x-axis). An appearing QM core destabilizes the star quite soon, and twin star solutions are ruled out, since these require a relatively low transition pressure Alvarez-Castillo and Blaschke (2013); Blaschke and Alvarez-Castillo (2015).
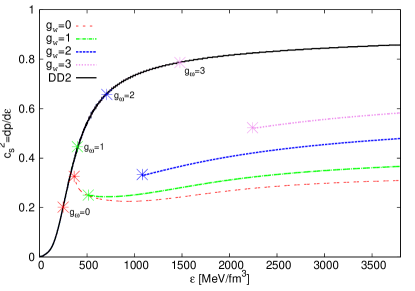
In fig. 12 we examine the speed of sound for
within the parameter choice MeV,
MeV and MeV, corresponding to figs. 4,
5 and 6. Since the Bag constant does not affect the
stiffness of the EoS (it just changes the value of the vacuuum pressure) the
slope of theses curves for any choice of B would remain the same. Only the
transition values of the energy density from one EoS
to the other EoS would change and in equal steps of .
For and , , see
also the discussion in the previous sections. The symbols on the “DD2” curve
mark the point where the transition takes place and the stars leave the hadronic
branch. The corresponding symbols on the QM
lines mark then the points, where the QM core appears. As one would expect, an increase of the repulsive
coupling not only stiffens the EoS but also raises the speed of sound within the
medium. The line saturates at which is
reasonable since ultrarelativistic matter without interactions saturates at
Shapiro and Teukolsky (1983); Glendenning (1997).
Since has far too high transition pressures for hybrid- and twin
stars the highest considered repulsive coupling reaches
. That means that all physically relevant and
considered cases in this work lie within . This will
become important in the following when we compare our results with those
from Alford et. al Alford et al. (2014, 2015); Alford and Han (2015).
IV.2 Various EoS and the corresponding mass-radius relations for fixed and different B
Figure 13 shows the EoS at fixed for various values of the Bag constant B. For increasing values of B the transition pressure increases. As in the case of increasing B at fixed , increasing B while varying leads to the same behaviour of the different EoS.
For MeV , and the discontinuity in energy density is (see inlaid figure). For the highest chosen value of MeV , and , i.e. the discontinuity in the energy density increases also with B.
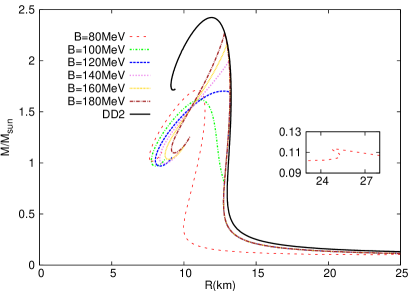
Figure 14 shows the mass-radius relations for while
varying B with MeV and MeV. For the smallest value of
MeV the QM core appears at already at a radius of
km (see inlaid figure), see also fig. 15.
The shape of the curve is similar to
the pure hadronic one but shifted to slightly smaller values of mass and radius due to
the appearence of the QM core. The transition from HM to QM appears at
, see fig. 16.
The inlaid figure displays a disconnected mass-radius branch, which is
an indication for a twin star. These disconnected solutions were found up to values
of MeV, getting harder to detect with larger B and always at
physically too small transition energy densities ,
see figs. 16 and 20, and shall
therefore not be discussed any further.
For MeV the transition occurs at
. The respective values are
, and
(see also inlaid figure in
fig. 4, fig. 13 and fig. 15).
The QM core appears at at a radius of km.
The star configuration does
not get unstable up to at a radius of km, which
can altogether be observed in fig. 15. The resulting mass-radius
relation for this EoS is also shown in fig. 5. Higher
values of the vacuum energy term B lead to much smaller hybrid star branches,
hardly visible and in accordance with Alford et al. (2014, 2015); Alford and Han (2015).
The configurations get unstable nearly immediately after the appearence of the
QM core, which itself emerges at a higher mass.
The case
MeV reaches but after the transition has set in,
the star configurations get quickly unstable. These stars support, if they
support, only a very small QM core and subsequently become unstable.
However, the transition pressure rises with the increase of , which
generates eventually an unstable QM core.
The labelling of the axes in the phase diagram for fixed in
fig. 16 is the same as for fixed B in
fig. 10. Generally, increasing the value of the repulsive
coupling of the QM EoS leads to a higher and also a larger discontinuity
for a given B. The higher the repulsive force within the QM
core, the higher is for a QM core to appear. For the transition to occur
at 2, B has to be at least MeV in case of zero repulsion
(), corresponding to the minimum of the plotted data in
fig. 16. For , B has to be at least MeV
to be located at 2. Both cases lead to stable hybrid star
configurations, shown in figs. 14 and 15 for
.
However, both trends are parabola like, crossing the constraint line twice,
whereas the and the case stay below the constraint
(except for the choice and MeV). The
case in the range MeV
corresponds to . There a connected hybrid
star branch, even if very small and hardly observable, exists up to
MeV. The stars get unstable almost immediately after the
appearance of the QM core. A higher value of B leads to transitions at already
unstable mass-radius configurations. In case of even higher repulsion
the transition takes place not before 10-14 times nuclear energy
density at an already unstable mass-radius configuration.
Our results match the results from Alford et al. (2014, 2015); Alford and Han (2015).
An investigation in the phase space by variation of and lead
us to the conclusion that neither nor
changes in an adequate amount to get a relatively
large jump in energy density accompanied with a small transition pressure, which
is an essential requirement for twin stars, see fig. 20.
Their attractive character through varying both quantities is far weaker than
the variation of and B
Ko and Rudaz (1994); Beisitzer et al. (2014); Zacchi et al. (2015).
V Comparison with other models
In the last section we have analyzed the parameter dependence of the resulting hybrid star properties within our HM-QM model. One main outcome of our analysis is the absence of a twin star region within the physical reasonable parameter space. Theoretically we have found a narrow parameter region where twin stars do exist (), however, within all of these EoSs the HM to QM phase transition appears at irrelevant low density values (). As the existence of twin stars have been found in many different kind of phase-transition scenarios, e.g. hadron-quark phase transition Mishustin et al. (2003); Hanauske ; Bhattacharyya et al. (2004) (using a Maxwell- or Gibbs construction), hyperon phase transition Schaffner-Bielich et al. (2002), pion Kämpfer (1981) and kaon condensation Banik et al. (2004, 2005), the question arises, what the main reason is, that we do not find twins in our model? On the one hand, in all the existing twin star models, the relevant EoS parameter region where twins occur, is always narrow and a ’parameter fine-tuning’ is needed to achieve an EoS which will result in a twin star behaviour. On the other hand, we have carefully analysed the allowed parameter space in the last section and did not find a twin star solutions where .
We show that the non-existence of twin stars in our model is due to the fact that the potential twin star area lies outside of our available parameter region and therefore cannot be reached in our simulations. By constructing the phase transition within our model we are not capable to choose arbitrary values for , and (like Alford et. al Alford et al. (2014, 2015); Alford and Han (2015)), because we need to match the HM-EoS with the QM-EoS in a consistent way, i.e. find the intersection between pressure p and chemical potential for the transition pressure .
| Star sequence | / | / | ||||
|---|---|---|---|---|---|---|
| Set A | 0.168 | 0.56 | 1.69332 | 13.262 | 1.69794 | 11.722 |
| Set B | 0.12 | 1.36 | 1.34586 | 13.208 | 1.26019 | 8.906 |
| Set C | 0.08 | 1.68 | 0.96196 | 13.052 | 1.19709 | 7.893 |
In this section we use the same density dependent DD2 EoS for the hadronic part, but we use a much simpler model for the QM sector. Similar to Alford et al. (2014, 2015); Alford and Han (2015) we take a QM-EoS, which is parameterized by the following three values: , and and (constant sound speed in quark matter) and which is given by eq. 11. In order to construct a comparable QM-EoS with respect to our model, we have used a fixed value of for the following calculations. The EoS for in this simple QM model has the following form Alford et al. (2014); Zdunik and Haensel (2013b)
| (11) |
where is the energy density at zero pressure. Fig. 17 shows the resulting EoSs for three choices of the parameters, which are given in tab. 1. In contrast to our model the parameters can be chosen in such a way that twin stars appear in a physically meaningful region.
In Figs. 18 and 19 the mass-radius relations and the radius-mass curves of the three chosen representative twin star parametrizations are displayed. The Set A mass-radius relation has been calculated by using the parameter configuration: and , which is located below the constraint-line given by eq. 10 (see fig. 20). This configuration is located right at the corner of the twin star region boundary lines and the differences between the maximum masses of the first and second sequence is very small ( and ). Set B displays a twin star where the first sequence maximum mass lies above the maximum mass of the twin star (). The Parameter Set C curve shows the mass-radius relation of a twin star sequence with a rather high value of but a low value of . The phase transition starts at low density and the maximum mass of the first sequence is much lower than the maximum mass of the twin star sequence (see table 1). In this model too the neutron star sequence continuously moves to the hybrid star branch and hybrid stars with a tiny quark core are stable for a short period. The connected stable hybrid star branch is very small and difficult to recognize, as the hybrid stars get soon unstable after formation of the tiny quark core. Nonetheless twin stars somehow manage to restabilize again at a higher transition pressure.
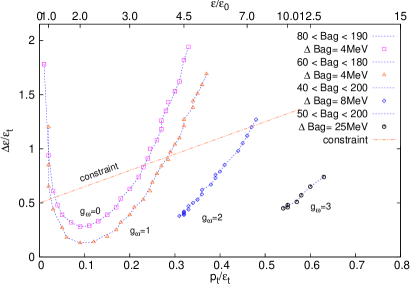
We do not get maximum mass values of the twin star configurations which are above the observational known value of , which means as a consequence, that all the twin star EoS are ruled out by nature.
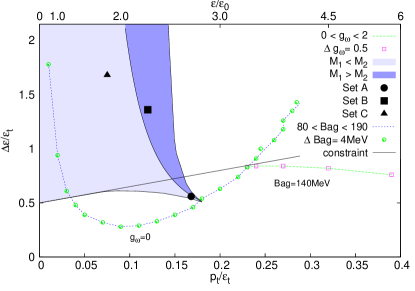
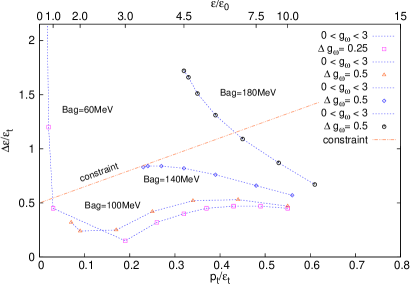
In Fig. 20 the twin star region in the model utilized by
Alford et. al Alford et al. (2014, 2015); Alford and Han (2015) is compared with the
space of available parameters within our model.
It can be easily seen that the main part of the region where twin stars exist
lies out of our attainable values of
and . Solely for irrelevant low values of we find
a twin star area, see figure 14. The cusp at the lower end of the twin star region at
(, ) overlaps in a
tiny region with the curve for , however, we do not find any twin star in
this parameter range. The radius-mass properties of hybrid stars near to the parameter
region of the cusp, almost reach a twin-like structure (see e.g. the curve with
MeV in fig. 15), though they never accomplish it mathematically. The reason
for this apparent contradiction is causally determined in the fact that the sound speed
for is not constant and slightly below the value which has been chosen to
calculate the twin star area (see fig. 12). As pointed out in
Alford et al. (2014), a decrease of has the effect of scaling down the size of
the twin star area and moves the cusp at the end of the twin star region
upwards. Therefore, the absence of twin stars at the intersection of the cusp region is
due to the energy dependence of the sound speed, which lowers its average value below
.
The line between the shaded areas separates whether
the mass of the first branch lies above (blue) or below (lighter blue)
the mass of the second stable branch .
The line with MeV gets closest to the twin star
region.
Nevertheless, twin stars
in general could exist in nature, as other models have been constructed
Benic et al. (2015); Dexheimer et al. (2015) that satisfy the constraint.
VI Conclusions
In this work we employ a density dependent hadronic matter EoS and a density dependent chiral quark matter EoS to find the phase transition from one phase to the other within compact stars. The quarks couple to the meson fields via Yukawa-type interaction terms. We utilize a Maxwell construction, i.e. assume that there is a sharp transition at a given transition pressure. The transition pressure is identified when the chemical potential equals the pressure, from that point on the dominance in the EoS flips and the larger energy density from the QM EoS prevails. Within our parameter range we found stable hybrid star solutions and investigated the relation of the QM core size and the appropriate stability of the star. In the SU(3) Quark Meson model utilized for the QM EoS four parameters can be varied, from whom two of them ( and ) have little effect on the results. We conclude that a larger repulsive coupling and a larger vacuum pressure B do not allow for a large QM core to appear but reach the limit, whereas small values of both quantities generate hybrid star solutions with a corresponding, large QM core, but the configurations stay below the constraint. Hybrid stars with high transition pressures are hard to distinguish from pure hadronic stars because of the tiny QM core. An appearing QM core generates an additional gravitational pull on the hadronic mantle. If the cores pressure can counteract this extra pull, the star is stable. For a too large discontinuity in energy density the star gets unstable since the pressure of the core is not able to counteract the extra gravitational pull Alford et al. (2014, 2015); Alford and Han (2015). In Alford et al. (2014) Alford et. al use hadronic EoSes based upon works from Heberler et. al Hebeler et al. (2010) and Shen et. al Shen et al. (2011). Their QM EoS is density independent and is parametrized through , and, assuming a constant speed of sound, . They conclude that for stars with at least a larger is advantageous, whereas for a larger region in the phase diagram for stars with is excluded, which as a consequence restricts the other parameters and . In a proximate work Alford et. al Alford et al. (2015) apply the constant speed of sound parametrization to a Field-Correlator-Method calculation. The corresponding EoS is equipped with an additive density independent -potential, corresponding to our density dependent vector coupling constant, and with a vacuum energy density term including gluon condensate contributions, analogous to the Bag constant utilized in our approach. Vacuum energy density term and Bag constant are in both cases additive, i.e. density independent. In both works the allowed region in the phase diagram for hybrid stars with more than two solar masses is shifted to high transition pressures at several times nuclear energy density (). The family of the Field Correlator Method EoSes (varying the two above mentioned quantities) covers only a limited region in the phase diagram due to a nearly density independent speed of sound (), whereas in our approach we achieved high transition pressures assuming a higher vector coupling constant. This feature on the other hand raises the speed of sound up to values , which would leave space in the phase diagram for the other parameters and , only we had no direct influence on them. However, we confirm the results Alford et. al Alford et al. (2014, 2015); Alford and Han (2015) obtained and investigate further why we were not able to find a third familiy (twin stars) of compact stars within a physically meaningful parameter region. The conclusion is that the chances for twins are best when the transition pressure is relatively low and the energy density discontinuity on the other hand relatively high, then an appearing QM core does not destabilize the star immediately. Likewise it gets harder to achieve the regime. But if the discontinuity in energy density is too large, the pressure of the QM core is unable to counteract the additional downward pull and the star configurations becomes unstable. A future work could study the interplay between hadronic- and quark matter EoS in greater detail to work out how to achieve the appropriate proportions between pressure and discontinuity in energy density for twin stars.
Acknowledgements.
The authors thank Laura Tolos and David Blaschke for discussions during the initial stage of this project. Furthermore we want to thank Thorben Graf and Rainer Stiele for helpful suggestions during the whole project. We gratefully acknowledge Sophia Han and Mark Alford for pointing out an inconsistency in the twin star area region of the previous version of our article and additionally want to thank them for further remarks. AZ is supported by the Helmholtz Graduate School for Heavy-Ion Research (HGS-HIRe) and the Helmholtz Research School for Quark Matter (H-QM). MH gratefully acknowledges support from the Frankfurt Institute for Advanced Studies (FIAS).References
- Demorest et al. (2010) P. Demorest, T. Pennucci, S. Ransom, M. Roberts, and J. Hessels, Nature 467, 1081 (2010), arXiv:1010.5788 [astro-ph.HE] .
- Antoniadis et al. (2013) J. Antoniadis, P. C. Freire, N. Wex, T. M. Tauris, R. S. Lynch, M. H. van Kerkwijk, M. Kramer, C. Bassa, V. S. Dhillon, T. Driebe, J. W. T. Hessels, V. M. Kaspi, V. I. Kondratiev, N. Langer, T. R. Marsh, M. A. McLaughlin, T. T. Pennucci, S. M. Ransom, I. H. Stairs, J. van Leeuwen, J. P. W. Verbiest, and D. G. Whelan, Science 340, 6131 (2013), arXiv:1304.6875 [astro-ph.HE] .
- Hulse and Taylor (1975) R. A. Hulse and J. H. Taylor, Astrophys. J. 195, L51 (1975).
- Zdunik and Haensel (2013a) J. Zdunik and P. Haensel, Astron.Astrophys. 551, A61 (2013a), arXiv:1211.1231 [astro-ph.SR] .
- Tolman (1934) R. C. Tolman, Relativity, Thermodynamics and Cosmology (Oxford University Press, Oxford, 1934).
- Sagert et al. (2006) I. Sagert, M. Hempel, C. Greiner, and J. Schaffner-Bielich, Eur.J.Phys. 27, 577 (2006), arXiv:astro-ph/0506417 [astro-ph] .
- Itoh (1970) N. Itoh, Prog.Theor.Phys. 44, 291 (1970).
- Bodmer (1971) A. R. Bodmer, Phys. Rev. D 4, 1601 (1971).
- Witten (1984) E. Witten, Phys. Rev. D 30, 272 (1984).
- Zacchi et al. (2015) A. Zacchi, R. Stiele, and J. Schaffner-Bielich, (2015), arXiv:1506.01868 [astro-ph.HE] .
- Kämpfer (1981a) B. Kämpfer, Phys. Lett. 101B, 366 (1981a).
- Kämpfer (1981b) B. Kämpfer, J. Phys. A 14, L471 (1981b).
- Kämpfer (1982) B. Kämpfer, Astron. Nachr. 303, 231 (1982).
- Kämpfer (1983a) B. Kämpfer, J. Phys. A 16, 633 (1983a).
- Kämpfer (1983b) B. Kämpfer, Astron. Nachr. 304, 167 (1983b).
- Kämpfer (1985) B. Kämpfer, Phys. Lett. 153B, 121 (1985).
- Glendenning and Kettner (2000) N. K. Glendenning and C. Kettner, Astron. Astrophys. 353, L9 (2000), astro-ph/9807155 .
- Schertler et al. (2000) K. Schertler, C. Greiner, J. Schaffner-Bielich, and M. H. Thoma, Nucl. Phys. A677, 463 (2000), arXiv:astro-ph/0001467 [astro-ph] .
- Blaschke and Alvarez-Castillo (2015) D. Blaschke and D. E. Alvarez-Castillo, (2015), arXiv:1503.03834 [astro-ph.HE] .
- Alford et al. (2014) M. G. Alford, S. Han, and M. Prakash, JPS Conf.Proc. 1, 013041 (2014).
- Alford et al. (2015) M. G. Alford, G. Burgio, S. Han, G. Taranto, and D. Zappalà , (2015), arXiv:1501.07902 [nucl-th] .
- Alford and Han (2015) M. G. Alford and S. Han, (2015), arXiv:1508.01261 [nucl-th] .
- Typel et al. (2010) S. Typel, G. Röpke, T. Klähn, D. Blaschke, and H. H. Wolter, Phys. Rev. C81, 015803 (2010), arXiv:0908.2344 [nucl-th] .
- Fodor and Katz (2002) Z. Fodor and S. D. Katz, JHEP 03, 014 (2002), arXiv:hep-lat/0106002 .
- Fodor (2007) Z. Fodor, PoS CPOD07, 027 (2007), arXiv:0712.2930 [hep-lat] .
- Alvarez-Castillo and Blaschke (2013) D. Alvarez-Castillo and D. Blaschke, (2013), arXiv:1304.7758 [astro-ph.HE] .
- Glendenning (1992) N. K. Glendenning, Phys.Rev. D46, 1274 (1992).
- Bhattacharyya et al. (2004) A. Bhattacharyya, S. K. Ghosh, M. Hanauske, and S. Raha, astro-ph/0406509 (2004).
- Bhattacharyya et al. (2010) A. Bhattacharyya, I. N. Mishustin, and W. Greiner, J.Phys. G37, 025201 (2010), arXiv:0905.0352 [nucl-th] .
- Koch (1997) V. Koch, Int. J. Mod. Phys. E6, 203 (1997), nucl-th/9706075 .
- Törnqvist (1997) N. A. Törnqvist, hep-ph/9711483 (1997).
- Lenaghan et al. (2000) J. T. Lenaghan, D. H. Rischke, and J. Schaffner-Bielich, Phys.Rev. D62, 085008 (2000), arXiv:nucl-th/0004006 [nucl-th] .
- Parganlija et al. (2013) D. Parganlija, P. Kovacs, G. Wolf, F. Giacosa, and D. Rischke, AIP Conf.Proc. 1520, 226 (2013), arXiv:1208.5611 [hep-ph] .
- Schaefer and Wagner (2009) B.-J. Schaefer and M. Wagner, Phys. Rev. D79, 014018 (2009), arXiv:0808.1491 [hep-ph] .
- Parganlija et al. (2010) D. Parganlija, F. Giacosa, and D. H. Rischke, Phys.Rev. D82, 054024 (2010), arXiv:1003.4934 [hep-ph] .
- Olive et al. (2014) K. Olive et al. (Particle Data Group), Chin.Phys. C38, 090001 (2014).
- Schertler et al. (1999) K. Schertler, S. Leupold, and J. Schaffner-Bielich, Phys.Rev. C60, 025801 (1999), arXiv:astro-ph/9901152 [astro-ph] .
- Maruyama et al. (2006) T. Maruyama, T. Tatsumi, T. Endo, and S. Chiba, Recent Res.Devel.Phys. 7, 1 (2006), arXiv:nucl-th/0605075 [nucl-th] .
- Hempel et al. (2013) M. Hempel, V. Dexheimer, S. Schramm, and I. Iosilevskiy, Phys. Rev. C88, 014906 (2013), arXiv:1302.2835 [nucl-th] .
- Seidov (1971) Z. Seidov, Sov. Astron, 15 (347) (1971).
- Kämpfer (1983c) B. Kämpfer, J. Phys. G 9, 1487 (1983c).
- Schaeffer and Haensel (1983) Z. L. Schaeffer, R. and P. Haensel, Astron. Astrophysics, 126 (121-145) (1983).
- Lindblom (1998) L. Lindblom, Phys.Rev. D58, 024008 (1998), arXiv:gr-qc/9802072 [gr-qc] .
- Shapiro and Teukolsky (1983) S. L. Shapiro and S. A. Teukolsky, Black Holes, White Dwarfs, and Neutron Stars: The Physics of Compact Objects (John Wiley & Sons, New York, 1983).
- Glendenning (1997) N. K. Glendenning, Compact Stars: Nuclear Physics, Particle Physics and General Relativity (Springer, Berkeley, 1997).
- Ko and Rudaz (1994) P. Ko and S. Rudaz, Phys.Rev. D50, 6877 (1994).
- Beisitzer et al. (2014) T. Beisitzer, R. Stiele, and J. Schaffner-Bielich, Phys.Rev. D90, 085001 (2014), arXiv:1403.8011 [nucl-th] .
- Mishustin et al. (2003) I. Mishustin, M. Hanauske, A. Bhattacharyya, L. Satarov, H. Stoecker, et al., Phys.Lett. B552, 1 (2003), arXiv:hep-ph/0210422 [hep-ph] .
- (49) M. Hanauske, .
- Schaffner-Bielich et al. (2002) J. Schaffner-Bielich, M. Hanauske, H. Stoecker, and W. Greiner, Phys.Rev.Lett. 89, 171101 (2002).
- Kämpfer (1981) B. Kämpfer, J.Phys. A14, L471 (1981).
- Banik et al. (2004) S. Banik, M. Hanauske, D. Bandyopadhyay, and W. Greiner, astro-ph/0406315 (2004).
- Banik et al. (2005) S. Banik, M. Hanauske, and D. Bandyopadhyay, J.Phys. G31, S841 (2005), arXiv:nucl-th/0412110 [nucl-th] .
- Zdunik and Haensel (2013b) J. Zdunik and P. Haensel, Astronomy & Astrophysics 551, A61 (2013b).
- Benic et al. (2015) S. Benic, D. Blaschke, D. E. Alvarez-Castillo, T. Fischer, and S. Typel, Astron.Astrophys. 577, A40 (2015), arXiv:1411.2856 [astro-ph.HE] .
- Dexheimer et al. (2015) V. Dexheimer, R. Negreiros, and S. Schramm, Phys.Rev. C91, 055808 (2015), arXiv:1411.4623 [astro-ph.HE] .
- Hebeler et al. (2010) K. Hebeler, J. Lattimer, C. Pethick, and A. Schwenk, Phys.Rev.Lett. 105, 161102 (2010), arXiv:1007.1746 [nucl-th] .
- Shen et al. (2011) G. Shen, C. J. Horowitz, and S. Teige, Phys. Rev. C83, 035802 (2011), arXiv:1101.3715 [astro-ph.SR] .