WSU–HEP–XXYY
Search for CP violation in and
Tara Nanut111on behalf of the Belle Collaboration.
Department for Experimental Particle Physics
Jozef Stefan Institute, Jamova 39, Ljubljana, Slovenia
We report updated measurements of indirect and direct CP asymmetry in decays and a new measurement of direct and indirect CP asymmetry in decays , using the full data sample of the Belle experiment.
PRESENTED AT
The 7th International Workshop on Charm Physics (CHARM 2015)
Detroit, MI, 18-22 May, 2015
1 Introduction
CP violation in neutral meson-antimeson systems arises from three contributions: direct CPV, which is CP violation in a specific decay, and indirect CPV from mixing and from interference of decays with and without mixing.
Mixing in decays of to CP eigenstates () results in a different effective lifetime than that of decays to flavour eigenstates (). The observable is defined as
| (1) |
CP violation gives rise to a difference of effective lifetimes of and decays to the same CP eigenstate. The asymmetry can be defined as
| (2) |
It follows that if no indirect CP violation is present, becomes zero.
The Standard Model prediction for CP violation in charm is of the order [1]. Any measurements of a larger value would indicate signs of New Physics, making this field an interesting area of study.
2 Time-dependent analysis of
Through a measurement of and we measure indirect CP violation, which is common to all decay modes. The quantities and are extracted via proper decay time measurement. We present here the final result of the update of the same analysis, performed by the Belle Collaboration in 2007 [2]. The new results cover the entire Belle data sample, corresponding to 976 fb-1 collected at or near (4S), (1S), (2S), (3S) and (5S) resonances. An improved analysis method is implemented, which recognises two different configurations of the Silicon Vertex Detector (SVD1 and SVD2) that were used during the data taking [3], and accounts for the polar angle dependence.
2.1 Event Selection
The is required to come from a decay chain . The charge of the slow pion provides the necessary tag on the flavour of the charm meson. Additionally, it enables us to set a constraint on the total energy released in the decay, , which provides excellent background suppression.
To select kaons and pions, standard Belle particle identification is applied [4]. The daughters of the are refitted to a common vertex. For the vertex fit of the , and are also fitted to the interaction point. In both cases, a confidence level greater that is required. To exclude s coming from decays of mesons, a cut on the CMS momentum of the is imposed. It is required that 2.5 GeV (3.1 GeV for (5S)). Candidates for s are selected based on the mass ) and , with a window imposed around the nominal value. For ), the allowed deviation is 2.25 , where is the R.M.S. width of the peak () and depends on the decay mode and SVD configuration. Typical values are MeV. The window in is 0.66 MeV (0.82 MeV) for SVD1 (SVD2). The selection criteria are optimised in order to achieve the minimal statistical error on . The proper decay time of the is calculated from the projection of the vector joining the two vertices onto the momentum vector: , where is the nominal mass. The proper decay time uncertainty is evaluated from the error matrices of the production and decay vertices. It is required fs (370 fs) for SVD1 (SVD2) to reject candidates with poorly determined proper decay time.
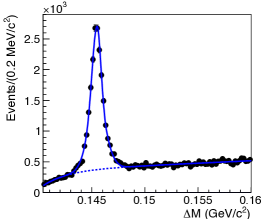
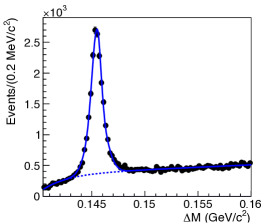
The proper decay time distribution is parameterised as
| (3) |
where is the effective lifetime, is the signal yield, is the resolution function and is the background distribution. Background is fixed from a fit to the sideband distribution. The position of the sidebands is optimised as to minimise the systematic uncertainty. The resolution function is constructed using a normalised distribution of , combining fits for different bins. An additional offset parameter is introduced to correct for a certain misalignment of the SVD detector. As this parameter is a function of the cosine of the CMS polar angle , the resolution function is evaluated in separate bins of cos(). A simultaneous binned maximum likelihood fit is performed in each bin for all three channels, separately for SVD1 and SVD2. The fit results are shown in Figure 1.


Obtaining measurements of and for all bins, the results are combined with least squares fit to constant to obtain the final result.
The fit is tested on Monte Carlo simulation equivalent to six times the data statistics. A linearity test shows that no bias is present.
2.2 Systematics and Final Result
The estimated systematic uncertainties are listed in Table 1. The main contribution arises from the misalignment of the SVD and is estimated using Monte Carlo simulations for different misalignments. The uncertainty due to the position of the mass window is estimated by varying the position of the window. The uncertainty on background comprises a contribution due to statistical fluctuations and a contribution that arises from modelling the distribution, which is estimated from MC simulation. The two contributions are added in quadrature. Systematics due to the resolution function are estimated using alternative parameterisations. Systematics due to binning are estimated by varying the number of bins in cos() and . All individual systematic uncertainties are added in quadrature to obtain the overall uncertainty.
| Source | yCP (%) | Aγ (%) |
|---|---|---|
| SVD misalignment | 0.060 | 0.041 |
| Mass window position | 0.007 | 0.009 |
| Background | 0.059 | 0.050 |
| Resolution function | 0.030 | 0.002 |
| Binning | 0.021 | 0.066 |
| Total | 0.092 | 0.066 |
The final result for the difference in the effective lifetime of mesons decaying to CP-even eigenstates and the flavour eigenstate is
which corresponds to a 4.7 significance when statistical and systematic error are added in quadrature. Simultaneously, the CP asymmetry was measured, obtaining
| (4) |
which is consistent with no CP violation.
3 Time-integrated analysis of
While the time-dependent analysis only measures indirect CP violation, it is possible to measure both direct and indirect CPV performing a time-integrated analysis of decay rates of neutral charm mesons to CP-even final states and . The presented results are an update of a 2008 analysis by the Belle Collaboration [5] using the full Belle data sample. The asymmetry of the time-integrated decay rates of and is defined as
| (5) |
where is the partial decay width. The flavour of the charm meson is tagged via the charge of the slow pion from the decay . However, the experimentally measured quantity is
| (6) |
where is the number of events from a certain decay. This quantity, called raw asymmetry, comprises besides the physical CP asymmetry also the production and detector-induced asymmetry: . The production asymmetry is a forward-backward asymmetry in production of and and arises from interference and higher order QED effects in . It is assumed to be the same for all charm mesons. The term is a detector-induced asymmetry that arises from different reconstruction efficiencies for positively and negatively charged particles. Since the decays in question are self-conjugated, the only charged particle that contributes to the asymmetry is the slow pion, with hence becoming . This term is determined using tagged and non-tagged decays , where it holds
| (7) | ||||
| (8) |
Since the forward-backward asymmetry is assumed to be the same for all charm mesons, it follows that
. Because and are functions of the corresponding phase spaces in the laboratory frame, is corrected for separately in bins of and .
The forward-backward asymmetry is odd function of and is corrected for using
| (9) | ||||
| (10) |
where is the raw asymmetry after correction.
3.1 Event Selection
The vertex fit and pCMS(D∗+) cuts are the same as stated in the previous Section. Other selection criteria are optimised so that the error on the asymmetry is minimal. The windows in () are 17.8 (1.00) MeV for , 17.8 (1.85) MeV for and 17.2 (0.90) MeV for .
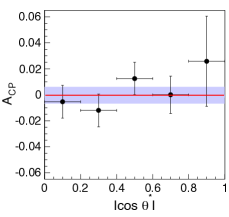
The signal yield is extracted via background subtraction. Background in the signal window is estimated based on two symmetrical sidebands that together amount to the width of the signal window, with their position starting at MeV from the nominal mass. Additionally, the range is limited to cos( 0.8 in order to decrease -related systematics.
The physical asymmetry is extracted in bins of cos(), with the final result obtained via a fit to constant. The corresponding plots are shown in Figure 2.

3.2 Systematics and Final Results
The estimated systematic uncertainties are listed in Table 2. The uncertainty corresponding to the signal counting method comprises two contributions, summed in quadrature: possible small differences in the signal shapes of and (uncertainty estimated from the tagged sample) and in background between the signal window and sidebands. The uncertainty corresponding to sideband selection is estimated by varying the position of the sidebands. The uncertainty of the correction arises from statistics of the sample and binning (estimated from using different binnings and requiring different minimal statistics per bin). The extraction method of contributes a systematic uncertainty due to binning and two different configurations of SVD.
| (%) | |||
|---|---|---|---|
| Signal counting method | 0.055 | 0.023 | 0.037 |
| correction | 0.065 | 0.067 | 0.014 |
| extraction method | 0.06 | 0.050 | 0.051 |
| Total | 0.085 | 0.087 | 0.064 |
The final results for the CP asymmetries are
| (11) | ||||
| (12) | ||||
| (13) |
and are consistent with no CPV.
4 Time-integrated analysis of
We report also a time-integrated analysis of CP violation in decays [6], performed on 966 fb-1 of Belle data. The analysis is largely similar to the time-integrated analysis described in the previous Section.
4.1 Event Selection
The is required to originate from the decay . The same pCMS(D∗+) cut as before is applied. The optimisation of selection criteria is done in order to minimise the error on the raw asymmetry. The obtained range of is (1.758, 1.930) GeV and the range is (0.14, 0.16) GeV.
The corrections for production and detector-induced asymmetry is performed as previously described. The signal yield is extracted via a simultaneous fit in of and samples. The fit is performed in bins of (cos, and the final result obtained via a fit to constant on values in bins of . The procedure is tested and confirmed on Monte Carlo simulations. The corresponding plots are shown in Figure 3.
4.2 Systematics and Final Result
The estimated systematic uncertainties are listed in Table 3. The final result for the CP asymmetry in decays is
| (14) |
which is consistent with no CP violation. It is the most accurate measurement to date.
| signal shape | 0.03 |
|---|---|
| correction | 0.07 |
| extraction method | 0.07 |
| Total | 0.10 |
ACKNOWLEDGEMENTS
We thank the KEKB group and all institutes and agencies that support the work of the members of the Belle Collaboration.
References
- [1] Y. Grossman, A. L. Kagan and Y. Nir, Phys. Rev. D 75, 036008 (2007) [hep-ph/0609178].
- [2] M. Staric et al. [Belle Collaboration], Phys. Rev. Lett. 98, 211803 (2007) [hep-ex/0703036].
- [3] Z. Natkaniec et al. (Belle SVD2 group), Nucl. Instrum. Methods Phys. Res., Sect. A 560, 1 (2006).
- [4] E. Nakano, Nucl. Instrum. Methods Phys. Res., Sect. A 494, 402 (2002).
- [5] M. Staric et al. [Belle Collaboration], Phys. Lett. B 670, 190 (2008) [arXiv:0807.0148 [hep-ex]].
- [6] N. K. Nisar et al. [Belle Collaboration], Phys. Rev. Lett. 112, 211601 (2014) [arXiv:1404.1266 [hep-ex]].