]Current address: Department of Mechanical and Aerospace Engineering, Princeton University, Princeton, NJ 08544, USA
An Atomistic Study of
Diffusion-Mediated Plasticity and Creep
using Phase Field Crystal Methods
Abstract
The nonequilibrium dynamics of diffusion-mediated plasticity and creep in materials subjected to constant load at high homologous temperatures is studied atomistically using Phase Field Crystal (PFC) methods. Creep stress and grain size exponents obtained for nanopolycrystalline systems, and , respectively, closely match those expected for idealized diffusional Nabarro-Herring creep. These exponents are observed in the presence of significant stress-assisted diffusive grain boundary migration, indicating that Nabarro-Herring creep and stress-assisted boundary migration contribute in the same manner to the macroscopic constitutive relation. When plastic response is dislocation-mediated, power law stress exponents inferred from dislocation climb rates are found to increase monotonically from , as expected for generic climb-mediated natural creep, to as the dislocation density is increased beyond typical experimental values. Stress exponents directly measured from simulations that include dislocation nucleation, climb, glide, and annihilation are attributed primarily to these large effects. Extrapolation to lower suggests that should be obtained from our PFC description at typical experimental values, which is consistent with expectations for power law creep via mixed climb and glide. The anomalously large stress exponents observed in our atomistic simulations at large may nonetheless be relevant to systems in which comparable densities are obtained locally within heterogeneous defect domains such as dislocation cell walls or tangles.
pacs:
61.72.Bb, 61.72.Lk, 62.20.F- 81.40.LmThe tendency of a solid material to gradually and irreversibly deform or even flow under low loads at high temperatures is termed creep deformation Kassner (2008); Frost and Ashby (1982); Nabarro and de Villiers (1995); Raj and Ashby (1971); Herring (1950); Coble (1963). Low loads and high temperatures in this context are and , respectively, where is the yield stress and is the equilibrium melting temperature of the material. This type of slow plasticity not only alters material microstructure, shape, and properties over extended time periods, but is also a primary cause of mechanical failure in materials such as gas turbine blades that operate in high temperature load bearing environments Kassner (2008); Frost and Ashby (1982); Nabarro and de Villiers (1995).
The plastic flow that occurs during creep can involve conservative defect evolution mechanisms, such as dislocation glide and grain boundary sliding, but is generally facilitated by thermally activated defect motion along local stress and/or chemical potential gradients, and is therefore inherently diffusive in nature. Vacancy diffusion in particular tends to be a central facilitator of deformation, either directly during diffusional creep or indirectly during dislocation or power law creep, as discussed further in the following. Moreover, it is the collective evolution of different defect populations over multiple length and time scales that leads to the observed diverse macroscopic phenomenology of creep. If the characteristic time scales associated with the diffusion of individual defects are almost entirely inaccessible to most atomistic descriptions, then the length and time scales associated with collective defect diffusion and macroscopic deformation are decidedly unreachable with conventional approaches. Details of the atomic-scale mechanisms by which diffusional (low ) and, in particular, power law (higher ) creep occur therefore remain matters of speculation in many cases. There is clearly a need to better characterize these mechanisms, to understand how they collectively generate mesoscale dislocation pattering phenomena observed during creep, and to understand how these mesoscale structures connect to macroscopic creep phenomenology.
The aims of the first part of the present study are to reproduce the macroscopic phenomenology of diffusional creep in nanopolycrystals from long time scale atomistic simulations, and to examine the consequences of stress-assisted grain boundary migration Kim et al. (1999); Kim and Hiraga (2000); Haslam et al. (2003); Cahn and Taylor (2004); Trautt et al. (2012) on diffusional creep. The primary aim of the second part of this study is to begin addressing the question of whether such simulations can also provide direct connections between atomistic defect evolution mechanisms and dislocation-mediated power law creep phenomenology. Toward these ends we employ the phase field crystal (PFC) modeling approach. We begin with a brief overview of creep phenomenology and a discussion of simulation literature in Section I. In Section II, the PFC approach is introduced and a new method for conducting constant stress PFC creep simulations is outlined. Grain boundary mediated deformation in dislocation-free nanopolycrystals is then examined in Section III, while dislocation-mediated creep is examined in Section IV. Connections to power law creep phenomenology are discussed in Section IV, and conclusions are summarized in Section V.
I Creep Phenomenology
The macroscopic plastic response of a material undergoing creep deformation can generally be characterized by an equation of the form Kassner (2008); Frost and Ashby (1982); Nabarro and de Villiers (1995)
| (1) |
where is total plastic strain, is time, is shear modulus, is grain size, and and are stress and grain size exponents, respectively. In laboratory experiments, a constant stress is typically applied and the resulting macroscopic deformation is measured as a function of time . The total strain can be decomposed into elastic and plastic contributions, . A rapid elastic deformation is thus observed, followed by an initial regime of non-steady plastic flow called primary creep. Plastic flow eventually reaches a steady-state during the so-called secondary creep regime, such that the strain rate is constant in time and Eq. (1) is applicable.
Diffusional creep, characterized by a stress exponent , is often observed at low in such experiments. At sufficiently high , bulk vacancy diffusion is the dominant flow mechanism and a grain size exponent results (Nabarro-Herring creep Herring (1950)). At lower , vacancy diffusion along grain boundaries is the dominant flow mechanism and a grain size exponent results (Coble creep Coble (1963)). Previous atomistic studies have addressed aspects of diffusional creep. Coble creep has been reproduced in molecular dynamics (MD) simulations of bcc Yamakov et al. (2002); Millett et al. (2008) and fcc Wang et al. (2011) nanopolycrystals, for example. This is feasible since vacancy diffusion rates can be relatively rapid within loosely packed high angle grain boundaries. Signs of non-negligible Nabarro-Herring creep contributions have been reported as the grain size is increased Millett et al. (2008), but a clear transition to dominant Nabarro-Herring creep has not been observed in MD simulations to our knowledge.
Deviations from the idealized descriptions of Nabarro-Herring and Coble creep are known to occur in systems with non-trivial microstructures. For example, when all grains in a polycrystal have the same shape and size, the idealized models of diffusional creep predict a symmetric and affine elongation of all grains. However, the presence of a distribution of grain sizes has been shown to lead inevitably to stress-assisted grain growth, the shrinkage of some grains and growth of others, during diffusional creep Kim et al. (1999). Thus, when grain boundaries are sufficiently mobile, idealized diffusional creep behavior can be significantly modified by the simultaneous effects of stress-assisted grain boundary migration. Consequences include non-trivial, non-affine evolution of grain morphology and the suppression of grain elongation for sufficiently large grain boundary mobilities and low stresses Kim and Hiraga (2000). These effects have been examined with both MD Haslam et al. (2003) and mesoscale simulation methods Kim and Hiraga (2000).
At applied stresses higher than those at which diffusional creep is typically observed, significant dislocation motion begins to occur as vacancy fluxes around dislocation cores and rates of stress-assisted thermally activated motion increase. A transition from diffusional to or power law creep then occurs, such that , with the precise value depending on a variety of material and microstructural properties, many of which are not well understood. Simultaneous interactions involving vacancies, dislocations, grain boundaries, and other defects can lead to complex behaviors such as climb-assisted obstacle bypass Chen et al. (2010) on atomistic scales and collective dislocation patterning Ananthakrishna (2007) on mesoscopic scales. All manner of such processes may contribute to macroscopic power law creep rates.
The simplest description of dislocation-mediated power law creep, natural creep Nabarro and de Villiers (1995), is arrived at by assuming a linear relation between the steady-state dislocation velocity and stress, , and by also employing a phenomenological relation between dislocation density and stress (Taylor’s relation), . Orowan’s equation for plastic strain then specifies , where is the system volume, is the number of mobile dislocations, is the magnitude of the Burgers vector of dislocation , is its length, and is the distance that it has traversed at time . The corresponding incremental plastic strain rate is , where is the velocity of dislocation at time . Substituting and gives or the natural creep exponent . Larger stress exponents are often observed even in pure metals, and are generally believed to be associated with significantly more complex processes than those underlying natural creep.
Atomistically-informed kinetic Monte Carlo (kMC) simulations have been used to study dislocation climb and power law creep in highly deformed bcc Fe Kabir et al. (2010). Steady state climb velocities computed from such simulations were found to be highly nonlinear in stress, increasing as with for large dislocation densities, -. This strong nonlinearity was found to arise from enhanced vacancy diffusion rates at large as well as from the assumed vacancy supersaturation, applicable to highly deformed metals. By then applying Orowan’s equation, , and assuming that Taylor’s relation holds in such systems, , the authors estimated power law creep exponents directly from the measured climb velocities as . This result essentially describes a modified form of natural creep, wherein large and a steady supersaturation of vacancies increase the ‘inherent’ dislocation climb stress exponent from to .
Clouet Clouet (2011) has connected the atomistic modeling of Ref. [Kabir et al., 2010] to classical mesoscale descriptions of climb, and found that extrapolation of their results to more physically relevant dislocation densities leads to stress exponents , as generally expected for climb-assisted natural creep in metals. The additional effects of glide, at minimum, must also apparently be considered if experimental stress exponents are to be reproduced.
Other mesoscale descriptions have been employed to study creep deformation. Recent discrete dislocation dynamics (DDD) simulations that incorporate both glide and climb have reproduced responses consistent with both diffusional and power law creep in fcc metals Keralavarma et al. (2012). It therefore appears that the length scales, dislocation densities, and underlying mechanisms relevant to some forms of power law creep may be accessible with this type of coarse grained description. A difficulty lies in the absence of atomistic detail, which necessitates the use of numerous explicit rules for dislocation interaction scenarios. Guidance for these rules often comes from atomistic simulations, but these are not always universally applicable or even well-defined, and only a subset of all possible interactions can realistically be considered. Thus, atomistic simulations that permit basic characterization of diffusion-mediated defect evolution processes should contribute to better informed mesoscale simulations. Long time scale atomistic methodologies that can access mesoscopic length scales through large scale simulations or systematic coarse graining procedures may also eventually provide fully self-contained multi-scale descriptions of creep and plasticity phenomena.
II PFC Approach
PFC models contain atomistic detail but describe time scales in crystals near and beyond that of the characteristic vacancy diffusion time Elder et al. (2002); Elder and Grant (2004); Elder et al. (2007); Provatas and Elder (2011); Emmerich et al. (2012). Both conservative and nonconservative dislocation evolution processes are captured for arbitrary crystal structure, orientation, morphology, and applied stress Berry et al. (2006); Stefanovic et al. (2006, 2009); Chan et al. (2010); Berry et al. (2012, 2014); Hirouchi et al. (2010). PFC simulations of diffusion-accommodated plastic flow under creep conditions may therefore reveal previously inaccessible information about the atomistic mechanisms that control diffusional and power law creep.
A general PFC free energy functional can be written
| (2) | |||||
where , is Boltzmann’s constant, is a constant reference density, is the scaled time-averaged atomic density field, is the unscaled time-averaged atomic number density field, and are free coefficients, and is the two-point direct correlation function of the fluid, assumed isotropic. may assume nonzero average values . We utilize the structural or XPFC class of functionals Greenwood et al. (2010, 2011), for which the Fourier transformed correlation function can be written
| (3) |
where denotes a family of lattice planes at wavenumber . The constants , , and are the Gaussian width (which sets the elastic constants), planar atomic density, and number of planes, respectively, associated with the th family of lattice planes. is a Debye-Waller-type temperature parameter that modulates the scattering intensity ( where is the structure factor) due to the effect of atomic thermal vibrations. The envelope of all selected Gaussians composes the final . A single reflection footnote1 (2015) at is used here to produce equilibrium bcc structures with lattice constant .
The standard stochastic nonlinear diffusion equation is employed for dynamics,
| (4) |
where is rescaled time (denoted as in subsequent sections), is a mobility constant, and is a Gaussian stochastic noise variable with and . PFC studies of mechanical properties often employ an equation of motion with an additional inertial or wave-like term, , to facilitate rapid elastic relaxations Stefanovic et al. (2006). Since the diffusive component of the mechanical response is our primary interest in this work, and since we focus on the low stress and low steady-state strain rate regime in which inertial effects should be secondary, we employ the simpler diffusive form of Eq. (4). No qualitative differences in terms of the creep-type response outlined in the following sections were observed in comparative simulations employing inertial dynamics.
We further define and use this variable in place of to specify a scaled temperature. This description thus contains two explicit temperature parameters, and , as well as any implicit temperature dependences of the other parameters in Eqs. (2) and (3). For simplicity and following convention, it is assumed that any implicit dependences in these latter scaled parameters can be neglected to lowest order. and can thus be varied simultaneously to control the physical temperature in the vicinity of the melting temperature (), though either parameter has the same basic effect independently for our purposes. For simplicity, we therefore control by varying only while holding fixed, unless noted otherwise. All simulations in this study were performed in 3D using a pseudo-spectral algorithm with semi-implicit time stepping and periodic boundary conditions.
Within standard PFC descriptions, the explicit evolution of vacancies is interpreted as being coarse grained into the structure of and its diffusive evolution. One question that we wish to address is whether this coarse grained description of vacancy diffusion can reproduce Nabarro-Herring and Coble creep mechanisms, which involve only the strain-induced flow of vacancies.
It is also currently unclear, in terms of power law creep, whether the length scales, dislocation densities, and collective defect kinetics relevant to kinetics can be reached by PFC-type models. The case of natural creep, as outlined in Section I, provides an illustration of this issue. Since the kinetics of climb in PFC models have been shown to follow for small dislocation density Berry et al. (2006), it stands to reason that a realization of Taylor’s relation would lead directly to natural creep, or potentially creep when glide is also considered Weertman (1975). It has not yet been demonstrated that the system sizes and dislocation creation-annihilation kinetics needed to self-consistently reproduce phenomena such as Taylor’s relation can be simulated by PFC models. Though we do not attempt to simulate large 3D systems with multiple slip systems in which Taylor’s relation generally emerges, analagous behaviors in quasi-2D systems are examined further in the following.
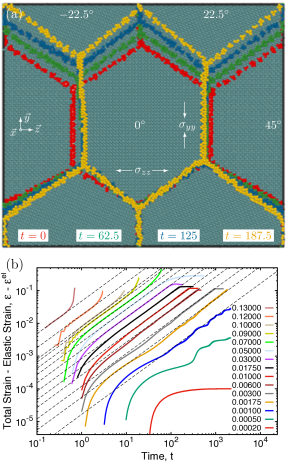
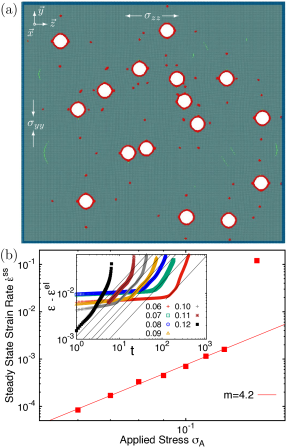
We numerically investigate the response of bcc crystals and polycrystals to creep-type deformation as follows. As in typical creep experiments, deformation is applied under constant stress conditions, using a newly developed stress-controlled PFC simulation method. At each evolution iteration , the grid spacing is homogeneously varied in one or more directions , depending on the particular choice of boundary constraints, until a specified stress is achieved. We consider quasi-2D system geometries with columnar grains aligned along the axis and strain applied along the and axes (see Fig. 1), and further employ a fixed - area constraint footnote2 (2015) with . and are simultaneously varied as and , where is the initial grid spacing along , until the condition is achieved, where is the mean total free energy. is then similarly varied until , though generally at all times for the columnar geometry employed. This method is therefore effectively equivalent to a constant volume pure shear deformation with fixed .
We have confirmed that the total strain generated versus for the case reproduces the correct linear stress-strain relation of the perfect one-mode bcc crystal for . As expected, modest deviations from linearity are observed for when nonlinear elastic effects become appreciable. We have also verified that the one-mode bcc Poisson ratio is realized at low in these simulations, again with nonlinear effects causing a modest gradual decrease to by .
III Diffusional Creep and Stress-Assisted Grain Boundary Migration in Nanopolycrystals
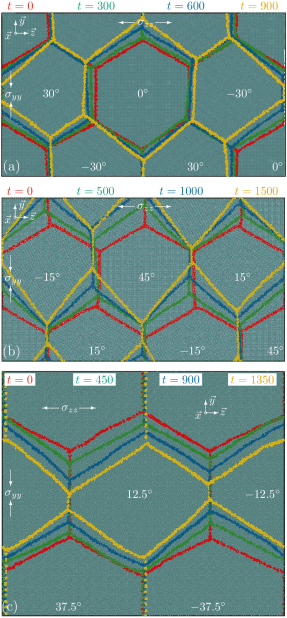
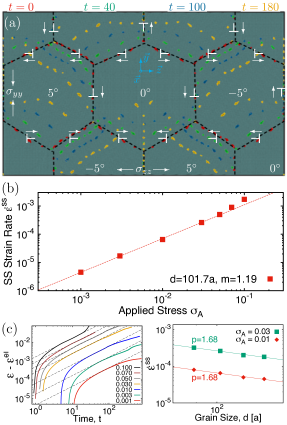
An idealized columnar grain structure with initially uniform grain shapes and sizes was used to examine diffusional creep in bcc nanopolycrystals. Periodic systems with either 4 or 6 hexagonal grains per repeat unit were chosen, with various symmetric and asymmetric combinations of grain rotations and grain boundary tilt angles. High angle boundaries were examined in asymmetric 4 grain systems with grain rotations of (, , ) or (, ). The former configuration contains four and eight boundaries, while the latter contains two , two , and eight boundaries, as shown in Figs. 1(a) and 2(c), respectively. Symmetric 6 grain systems with grain rotations of (, ) or (, ) were also examined. These configurations contain eighteen boundaries, as shown in Figs. 2(a) and 2(b). Low angle grain boundaries were examined using a similar asymmetric 6 grain configuration with grain rotations of (, ). This system contains twelve boundaries and six boundaries (see Fig. 5(a) ahead). The columnar axis is along in all cases, and a system thickness was used in this direction (no changes were observed for ). Grain sizes , , , , , , , and were studied, where is the diameter of the smallest circle that encloses the hexagon. Unless specified otherwise, model parameters , , , , , , , and are used with and , where .
After equilibration of each system at , simulations were conducted at a range of values, and the subsequent deformation was monitored as a function of time. Analysis of creep dynamics is restricted to stresses above , the threshold for observable plasticity () and below , the threshold for dislocation nucleation from grain boundaries (). The absence of lattice dislocations or other defects in the grain interiors allows us to isolate and characterize grain boundary-mediated plasticity mechanisms without complications from collective dislocation processes, for example. Plastic flow in these grain geometries generally requires a significant amount of nonconservative grain boundary motion, i.e., vacancy-mediated migration and climb.
Even though all grains are initially identically hexagonal, their different orientations and boundary structures create small asymmetries upon equilibration, which grow when stress is applied. The result is an initial delta function grain size distribution that broadens with time due to stress-assisted grain boundary migration or grain growth. The symmetric 6 grain geometry described above has been used in MD to avoid precisely this effect Millett et al. (2008), but it will be shown in the following that the mobility of grain boundaries in our PFC simulations is large enough to significantly impact the measured steady-state creep rates. In discussing evolution of the grain size distribution, we distinguish between net grain growth, an increase in the average grain size, and differential growth, a broadening of the grain size distribution without any increase in average size. Net growth is observed only at very late times when entire grains are eliminated, after the steady-state creep regime has ended, and therefore does not influence our results. Differential growth does occur during the steady-state creep regime.
III.1 High angle grain boundaries
Representative creep curves obtained for the asymmetric 4 grain system with (, , ) rotations are shown in Fig. 1(b) for . After an initial elastic strain and a brief regime of plastic flow onset (primary creep), an extended regime of linear steady-state creep (secondary creep) is observed for all . The slope of the best linear fit to this regime gives the steady-state creep rate for a given . The steady-state creep regime terminates in one of two ways. For , differential grain growth proceeds until two grains eventually consume the others at late times (net grain growth), leaving two boundaries along that no longer migrate in response to . Creep therefore ceases and all strain energy is absorbed elastically. For , dislocations eventually nucleate from the grain boundaries or homogeneously from the grain interiors at late times. This leads to unbounded plastic flow, a divergence in the strain rate, and loss of mechanical integrity.
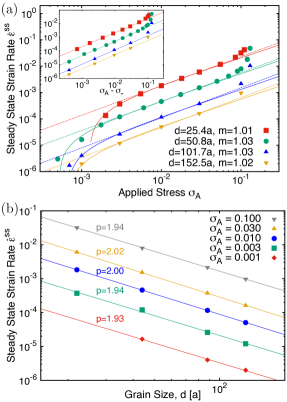
The extracted steady-state creep rates for four values of are plotted as a function of in Fig. 3(a). The best fit slopes of these data for (dashed lines) indicate that the bare stress exponents are . Taking the effect of into account by substituting for produces (solid lines and inset). The dependence of on for 5 representative values of is plotted in Fig. 3(b). All data sets are well fit by a grain size exponent .
Very similar values for the exponents and are obtained for the other high angle grain boundary configurations shown in Fig. 2. The morphology of the grain structures, on the other hand, does vary with the details of the initial configuration. For example, the initial systems shown in Figs. 2(a) and 2(b) are identical except for a rotation of all grains by about the axis, but their structures evolve quite differently. Whereas the two grains in Fig. 2(a) grow nearly radially while the grains shrink, all six grains in Fig. 2(b) elongate and coherently translate nearly uniformly along . In the asymmetric 4 grain systems shown in Figs. 1(a) and 2(c), a relatively fixed orientation is maintained along the boundaries that do not lie parallel to . These boundaries translate nearly uniformly along until two of the four grains are eliminated. The causes of these differences are examined further at the end of this section. We also note that grain rotations are observed in coordination with differential grain growth, and are a consequence of nonconservative boundary migration.
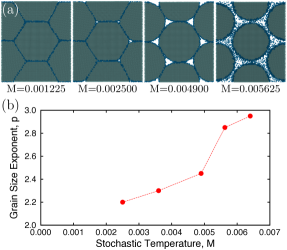
Interestingly, we observe a transition from and behavior to and as the stochastic temperature is raised to very near melting. The effects of on grain boundary structure and the corresponding grain size exponents are shown in Fig. 4. There is a clear correlation between the increase in from 2 to 3 and the effective liquification of the grain boundaries. The observed exponents are consistent with those of Coble creep, which is typically dominant only at relatively low . Our findings therefore indicate that grain boundary premelting in the presence of low applied stresses can result in a re-entrant Coble creep regime at sufficiently near the equilibrium melting point.
III.2 Low angle grain boundaries
The 6 grain low angle grain boundary configuration evolves as shown in Fig. 5(a). Since the Burgers vectors of the grain boundary dislocations can be clearly identified, the direction of the driving force for each boundary under and is readily known (white arrows in Fig. 5(a)). Indeed, the motion of each boundary is consistent with that expected from its Burgers vector. Deviations from the exact direction expected are due to forces exerted by neighboring boundaries, as discussed further in the following subsection. Motion of the dislocations within boundaries aligned with occurs purely by climb, while motion of all other boundary dislocations occurs via a mixture of climb and glide. The stress exponent obtained during the regime of morphologies roughly corresponding to those shown in Fig. 5(a) is (Fig. 5(b)). Eventually, boundaries begin to meet and both the dislocation density and strain rate decrease at later times as dislocations annihilate. Figure 5(c) shows the grain size dependence of , from which an exponent is obtained.
III.3 Discussion
The creep exponents and obtained in the preceeding simulations are consistent with those of Nabarro-Herring creep, grain redistribution mediated by bulk vacancy diffusion. As discussed in Section I, idealized diffusional creep would be expected to generate a nearly affine deformation morphology, such that no significant structural changes would be observed upon normalization of the system configuration by strain (, ), no matter the initial grain orientations and patterns. This is clearly not the case in any of the present simulations. The grain deformation seen in Fig. 2(b) is the closest to affine, but some elongation along is observed as well a significant amount of collective translation in this direction. During the primary and steady-state deformation regimes, the summed grain boundary length and the number of grains within each system remain fixed, but the grain size distributions broaden. Differential grain growth or stress-assisted grain boundary migration therefore clearly influences the measured creep rates. In this subsection, we attempt to characterize the relative degrees to which Nabarro-Herring creep and stress-assisted grain boundary migration mediate plastic flow in these simulations, and to explore connections, similarities, and differences between these two related mechanisms.
The low angle grain boundary simulations are perhaps most easily understood from the viewpoint of stress-assisted migration. The expected climb direction of each dislocation/boundary, based on its Burgers vector and the direction of applied stress, is indicated by a white arrow in Fig. 5(a). The general agreement with the observed migration directions indicates that the applied stress directly induces dislocation climb and therefore boundary migration. The entire structure then evolves collectively in response to these climb forces, while the topological constraints of the boundary network transmit additional network forces to each boundary. For example, the dislocations within the upper left boundary of the central grain migrate in the - direction due to the climb force generated by , but they also migrate in the + direction due to the motion of the neighboring vertical boundary in this direction. The net result is a mixed climb-glide migration nearly along the vector . The two vertical boundaries translate only along by pure climb, as the forces due to neighboring boundaries balance along . The four vertical boundaries climb similarly along , but also experience a net torque about due to the opposing migration directions of their neighbors along and -, respectively.
By tracking the evolution of individual dislocations, we have quantified the amount of plastic strain relief due to dislocation motion. We find that this mode of strain relief accounts for nearly all of the applied system-wide strain, confirming that dislocation/boundary migration is the primary mechanism of plasticity in this case.
Though high angle grain boundaries cannot be analyzed in terms of individual dislocations, the relatively similar differential grain growth morphologies and creep exponents observed across low and high angle systems suggest that no qualitative change in plasticity mechanisms occurs with angle. The probability of conservative grain boundary sliding should nonetheless become more significant as the boundary angles increase. Visual inspection of during high angle boundary migration reveals that density peaks are created within boundaries under tension (positive mass flux) and destroyed within boundaries under compression (negative mass flux), while no signs of significant boundary sliding have been observed. This flow of mass is consistent with the basic Nabarro-Herring process. It is therefore perhaps not surprising that the Nabarro-Herring exponents, and , are observed even though the grain morphology does not remain affine during concurrent stress-assisted migration.
These findings suggest that plasticity in the present PFC simulations is mediated by the inherently coupled processes of vacancy diffusion and grain boundary migration, in the following general manner. Applied stress generically induces vacancy flow out of grain boundaries under tension and into those under compression. These flows should in turn be capable of driving both the grain redistribution of diffusional creep and the nonconservative defect evolution of stress-assisted boundary migration. In our simulations, diffusion apparently occurs primarily through the grain interiors, in accord with idealized Nabarro-Herring creep. Rather than simply depositing onto non-tensile boundaries such that affine grain redistribution and elongation occurs, the vacancies directly facilitate climb-mediated grain boundary migration. This migration is possible because of the large nonconservative mobilities of PFC dislocations and grain boundaries relative to the inherent diffusive time scales of vacancies in this description. The subsequent directions of grain boundary migration are determined at the atomistic level by the dislocation orientations and/or grain boundary topologies. These should generally exhibit no predisposition for affine morphologies, as is clear for the case of Fig. 5(a). The symmetry of the grain shapes is thus broken, a distribution of sizes emerges, and differential growth proceeds, driven by the stress-induced vacancy fluxes. The correspondence in terms of underlying mechanism suggests that this type of creep plasticity in the large boundary mobility regime may reasonably be expected to produce the same stress and grain size exponents as those of idealized Nabarro-Herring creep, though with very different effects on grain morphology, particularly for nanoscale grains.
The non-affine morphologies appear to emerge here largely from atomistic effects, many aspects of which would therefore be difficult to predict without atomistic insight. First, variation of grain boundary structure with angle leads to breaking of the perfect hexagonal symmetry under zero stress. Second, the preferred and realized kinetics of boundary migration under stress are determined by a number of potential effects with atomic-scale origins. For example, the stress dependence of the grain boundary mobilities and their preferred migration directions are linked to grain boundary/dislocation structure. The driving force for migration may also be influenced by grain orientation if elastic anisotropy is sufficiently large. Further investigation is needed to determine which of these or other factors most influence the nature of this type of stress-assisted boundary migration, particularly for high angle boundaries, but over the range of parameters and deformation conditions investigated, our results indicate that it can be a significant contributor to creep flow in the regime of large boundary mobilities.
IV Dislocation or Power Law Creep
To examine the transition to dislocation-mediated plastic flow and potentially power law creep, we must, at minimum, introduce dislocation sources into our simulations. Naturally emerging steady-state and values involving primarily dislocation climb and glide would then signal a physically meaningful power law creep regime. In the following subsection, we begin by examining a simple controlled geometry in which the number of mobile dislocations does not depend significantly on , and a stress exponent is therefore expected (this is still technically dislocation, not diffusional, creep). It will be shown that can nonetheless arise due to additional factors associated primarily with large dislocation densities. Other scenarios are then considered in which does increase with and larger stress exponents are thus expected, as in the case of natural creep. Connections are drawn between the subsequent power law stress exponents and the dislocation density effects identified in the constant case.
IV.1 Dislocation nucleation, climb, and pile-up
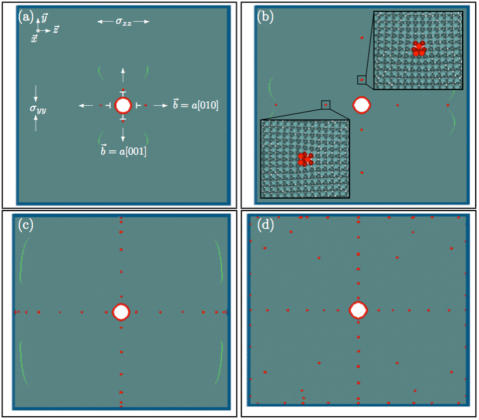
To begin examining the effects of dislocation climb on PFC creep rates, we first characterize a simple system geometry consisting of a perfect bcc crystal with one central dislocation source, as shown in Fig. 6. The simulation cell and crystallographic directions are the same as those of the previous section, as is the system thickness of . The dislocation source is a cylindrical region of radius in which is slaved to a homogeneous penalty function Stefanovic et al. (2009). Though the model is capable of spontaneously generating dislocations from defects such as sessile dislocation loops and grain boundaries Berry et al. (2014), cylindrical sources are input here “by hand” primarily for convenience. They facilitate relatively controlled dislocation nucleation behavior at stresses below the homogeneous nucleation threshold and from sources small enough to introduce several within a single simulation cell. The cylinder acts as a rigid, uniform body similar to a large glass bead in a colloidal crystal or an incoherent inclusion in an atomic crystal. When a sufficiently large stress is applied as previously discussed, the cylinder becomes a site for heterogeneous nucleation of dislocation pairs or sets of orthogonal pairs (see Supplemental Material footnote3 (2015) for animation). Since the stresses are axial, these dislocations nucleate and translate by climb alone. We can therefore characterize the creep response due to purely diffusion-mediated dislocation motion. In the case shown in Fig. 6, hard wall boundaries are also employed by slaving near the system edges to the perfect bcc solution Stefanovic et al. (2009).
If the strain decomposition is employed once more for the constant condition, then can be quantified using the Orowan equation when the only plastic strain relief mechanism is dislocation motion, as noted previously. If and are both constant and the average steady-state dislocation velocity can be written , then . For pure climb, is generally assumed and has been verified to hold in PFC simulations Berry et al. (2006). Thus we expect in constant stress experiments for which the dislocation density is small and constant and the overall stresses and dislocation velocities are low and linear, respectively. This should approximately be the case between nucleation of the first and second waves of dislocation pairs in large systems. Analyses and comparisons of observed nucleation rates and pile-up spacings with those predicted by continuum descriptions are outlined in Appendices A and B, respectively. The agreement is good in both cases.
Figure 7(a) shows the measured dependence of on system size or dislocation density . The exponent appears roughly to approach 1 as , though system size limitations prevent us from accessing very low values. For easily accessible , these simple dislocation creep simulations exhibit . The deviation from appears to have two primary causes. The first, as already noted, is large . For a lattice constant of nm (as assumed in the following), the densities simulated correspond to mm2, which is near or above the highest average values typically observed in experiments (m2). Our simulations therefore indicate that collective interactions between defects at large can significantly accelerate plastic flow relative to that expected for isolated dislocations. A total m2 should therefore ideally be maintained in such simulations, though large local densities m2 to m2 may have direct physical relevance in some cases.
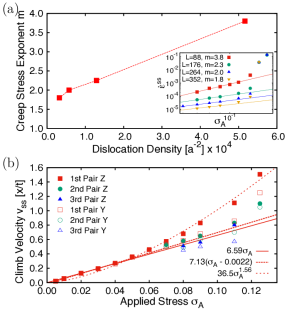
The other source of is associated with nonlinear acceleration of at large , as shown in Fig. 7(b). This acceleration correlates with the onset of significant nonlinear elasticity and can be avoided for , but the existence of a finite stress barrier for dislocation nucleation ( in this case) also limits the explorable range at low .
If we follow the analysis of Ref. [Kabir et al., 2010] by applying Taylor’s relation directly to our measured climb velocities, then the predicted creep rates would follow for the values of examined. These values are comparable to those obtained from the atomistically-informed kMC simulations of Ref. [Kabir et al., 2010], , which were conducted at dislocation densities near the high end of our range. The underlying causes of these large exponents were identified in their study as nonlinear vacancy-dislocation core interactions and a non-negligible dependence of vacancy concentration on stress. Such mechanisms are not explicitly considered in PFC descriptions, but nonlinearities near dislocation cores are naturally captured by , the local peaks of which decrease in amplitude and increase in width as the core is approached. These variations signify local changes in vacancy concentration and migration barriers, which appear to produce qualitatively similar nonlinearities in climb rates with increasing to those observed in the atomistic simulations of Ref. [Kabir et al., 2010].
For sufficiently low (), our PFC description appears to converge toward the standard description of purely climb-mediated creep in which and thus . The noted nonlinearities caused by interacting dislocation strain fields apparently become negligible at and below typical physically relevant dislocation densities. This finding is in accord with Clouet’s analysis Clouet (2011) of the results of Ref. [Kabir et al., 2010], wherein is obtained for experimentally relevant conditions. It therefore appears that much larger, less controlled system configurations in which dislocations may more realistically nucleate, climb, glide, annihilate, etc. must be examined to obtain a more meaningful description of power law creep. The required length scales are not yet accessible with PFC simulations, but we initiate steps in this direction in the following section. We note nonetheless that the overall consistency of our results with those of atomistic and mesoscale descriptions indicates that both the atomistic mechanisms and long-range interactions that underlie dislocation climb are qualitatively captured by PFC models.
IV.2 Power law creep
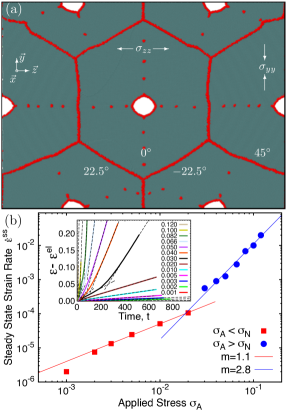
We next examine somewhat less idealized microstructures to determine whether more varied modes of dislocation creation, interaction, and annihilation can self-consistently generate power law creep behavior within atomistic PFC descriptions. As a first case, dislocation sources are symmetrically introduced into the hexagonal grain structures of Section III, as shown in Fig. 8(a). This configuration produces a crossover from diffusional creep for to for , as shown in Fig. 8(b) (see Supplemental Material footnote3 (2015) for animation). Below , dislocations do not nucleate and the response is unchanged from that outlined in Section III for diffusional creep and stress-assisted grain boundary migration. Above , dislocations nucleate from the sources and the response therefore transitions toward a dislocation mediated power-law-type regime. This change in strain relief mechanisms above is clearly visible, with a crossover to larger but still nearly linear steady-state strain rates after dislocations become active. The mobile dislocation density becomes large during this regime, on the order of m2, and increases roughly as . The observed exponent therefore seems to result primarily from the combined effects of this dependence and the large and nonlinear effects, as illustrated in Fig. 7. Glide is active in these systems, but does not appear to contribute significantly to the plastic flow in this idealized system geometry.
A second system configuration containing 16 randomly positioned sources with and 4 hard wall boundaries is shown in Fig. 9 (see Supplemental Material footnote3 (2015) for animation). Such systems nucleate waves of dislocations when , and between early waves generally reach temporary steady-states in terms of and . Between the first and second waves of dislocation nucleation, for example, when (at all stresses) we obtain (Fig. 9(b)). This value is larger than that expected from large and nonlinear effects, which as quantified in Fig. 7 would be expected to produce . Similar simulations with 2 rather than 4 hard wall boundaries produce . The excess in these simulations may be due to the contribution of dislocation glide.
If we extrapolate these results to lower where is expected to be realized (decrement measured by 2), and further assume that Taylor’s relation holds (increment measured by 2), a power law creep stress exponent of is implied. This value approaches but is smaller than typical experimental results for pure metals, , and is approximately consistent with previous mesoscopic descriptions that consider both climb and glide () Weertman (1975). These findings, though not obtained directly at the system sizes and dislocation densities ulitimately sought, do indicate that physically meaningful behavior is being captured.
As noted previously, the power law exponents obtained here at large may also have some limited direct physical relevance based on the known spatial heterogeneity of in many systems. Even though average values of m2 simulated here are not typically encountered in real materials, significant spatial heterogeneity in is often observed. Dislocation clustering at cell walls, tangles, obstacles, and even low-to-medium angle grain boundaries, for example, have been estimated Mughrabi (1983) to produce local values of m2, as large as any considered here. Though these heterogeneous domains of very large are separated by domains of much lower (m2 in Ref. [Mughrabi, 1983]), they may nonetheless locally induce strong deviations from the climb kinetics commonly assumed for individual dislocations, based on the simulations of Section IV.1. Apparent power law creep behavior may therefore be observed in such systems, even in the absence of any particularly complex defect reactions or mesoscale patterning.
V Conclusions
We have studied the nonequilibrium kinetics of creep deformation and diffusional defect migration in atomistic crystalline and nanopolycrystalline systems using phase field crystal modeling. A method for conducting constant stress PFC simulations, the first such method to our knowledge, was developed and utilized throughout this study. The characteristic stress and grain size exponents quantified for symmetric nanopolycrystals, and , respectively, closely match those expected for idealized diffusional Nabarro-Herring creep, and . We find that a significant portion of the plastic flow in these systems is associated with non-affine grain boundary motion, suggesting that concurrent stress-assisted diffusive boundary migration does not necessarily alter diffusional creep exponents in the regime of large boundary mobilities. Exponents consistent with diffusional Coble creep (, ) were observed only in the presence of stochastic thermal noise amplitudes large enough to induce grain boundary melting or premelting. This suggests that a re-entrant transition to Coble creep may occur in weakly stressed systems that exhibit significant premelting near .
In simulations of dislocation-mediated plastic flow (Section IV.1), nucleation rates and pile-up spacings were shown to be well described by predictions of continuum elastic dislocation theory, Eqs. (7) and (8), respectively. At numerically accessible dislocation densities, strong nonlinear interactions were found to produce ‘inherent’ dislocation climb exponents and extrapolated creep stress exponents for to . These results are in general agreement with previous atomistic Kabir et al. (2010) and mesoscale studies Clouet (2011), and further highlight the need to access lower dislocation densities in atomistic simulations. Extrapolated climb rates appear to approach near typical experimental dislocation densities (), indicating that PFC models will reproduce climb-mediated natural creep behavior with when Taylor’s relation holds.
In systems with slightly less idealized grain and dislocation source stuctures (Section IV.2), stress exponents were directly measured, but these values cannot be straightforwardly compared to experimental results due to the known influence of large effects. Anomalously large stress exponents associated with the kinetic climb rate nonlinearities observed at large may nonetheless have relevance to power law creep in systems that exhibit comparable dislocation densities locally within dislocation tangles and cell walls, for example. Extrapolation of the simulation results of Section IV.2 to physically relevant dislocation densities leads to predicted exponents of , nearly consistent with mesoscale predictions for systems in which both climb and glide are active (), but still somewhat smaller than typical experimentally measured values in pure metals ().
The results of this work indicate that PFC-type approaches are capable of capturing the essential physics of nonconservative defect evolution and dislocation-mediated creep at atomistic length scales and diffusive time scales. The system sizes required to describe typical experimentally-relevant dislocation densities, though not yet accessible, may be realizable within the next decade or potentially sooner with further development of computationally efficient, coarse grained complex amplitude expansions of PFC models Athreya et al. (2007); Huang et al. (2010); Spatschek and Karma (2010); Ofori-Opoku et al. (2013). Potential points of shorter-term study include investigation of fully 3D systems with more realistic microstructures and a distribution of dislocation source activation stresses, as well as development of constant stress deformation methods that impose fewer constraints on the shape of the polycrystalline domain.
Acknowledgements.
This work has been supported by the Natural Science and Engineering Research Council of Canada (NSERC), and access to supercomputing resources has been provided by CLUMEQ/Compute Canada.Appendix A Dislocation Nucleation Rates
As dislocation pairs sequentially nucleate in the simulations of Section IV.1, the dependence of on time and can be understood as follows. Upon nucleation of the first dislocation pair at , the local strain around the source is reduced by . For , this amount of strain must be reapplied to nucleate another pair, and the time required to do so, , is equal to the time it takes the climbing dislocation pair to plastically relieve this same amount of strain. For a constant steady-state climb velocity,
| (5) |
At there are 4 mobile dislocations, so the time required to nucleate the third pair is halved, and so on. In general,
| (6) |
and the time required to generate pairs of dislocations is
| (7) | |||||
where is the constant prefactor given in Fig. 7(b). Equation (7) is a harmonic series, which grows faster than logarithmically, implying that diverges faster than exponentially when annihilation and/or immobilization do/does not occur footnote4 (2015). This would be the case, for example, in an infinitely large system. Since our simulations are finite and also employ hard wall boundaries, dislocations become effectively immobile when they reach a wall. Nucleation of a new pair tends to occur roughly when the previous pair reaches the hard wall boundary, such that the number of mobile dislocations remains nearly constant with time. For this type of fixed scenario, Eq. (7) predicts that periodic waves of dislocation nucleation will occur every such that the total number of mobile plus immobile dislocations increases linearly with time at a rate proportional to . These relations are indeed found to describe the first few waves of nucleation quite well for all system sizes studied with hard wall boundaries.
Appendix B Dislocation Pile-Up Spacings
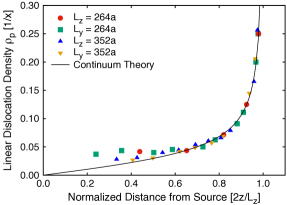
Figure 10 shows the linear dislocation density as a function of distance from the source for pile-ups such as that seen in Fig. 6(c). is defined such that the number of dislocations between and is . The solid line is a best fit to the prediction of continuum elasticity theory Hirth and Lothe (1982) for a double 1D pile-up along ,
| (8) |
where is the distance from the center of the pile-up. This equation with (as imposed by the fixed area, constant algorithm), , , and accurately describes the simulation results for sufficiently far from the source. This further confirms that the long range elastic interactions between PFC dislocations agree with continuum elastic descriptions, such that non-trivial multi-dislocation, multi-obstacle interactions are captured as well.
References
- Kassner (2008) M. E. Kassner, Fundamentals of Creep in Metals and Alloys (Second edition) (Elsevier, Amsterdam, 2008), ISBN 978-0-08-047561-5.
- Frost and Ashby (1982) H. Frost and F. Ashby, Deformation-mechanism maps: the plasticity and creep of metals and ceramics (Pergamon Press, 1982), ISBN 9780080293370.
- Nabarro and de Villiers (1995) F. R. N. Nabarro and F. de Villiers, Physics of Creep and Creep-Resistant Alloys (CRC Press, 1995), ISBN 9780850668520.
- Raj and Ashby (1971) R. Raj and M. Ashby, Metallurgical Transactions 2, 1113 (1971).
- Herring (1950) C. Herring, Journal of Applied Physics 21, 437 (1950).
- Coble (1963) R. L. Coble, Journal of Applied Physics 34, 1679 (1963).
- Kim et al. (1999) B.-N. Kim, K. Hiraga, Y. Sakka, and B.-W. Ahn, Acta Materialia 47, 3433 (1999).
- Kim and Hiraga (2000) B.-N. Kim and K. Hiraga, Acta Materialia 48, 4151 (2000).
- Haslam et al. (2003) A. Haslam, D. Moldovan, V. Yamakov, D. Wolf, S. Phillpot, and H. Gleiter, Acta Materialia 51, 2097 (2003).
- Cahn and Taylor (2004) J. W. Cahn and J. E. Taylor, Acta Materialia 52, 4887 (2004).
- Trautt et al. (2012) Z. Trautt, A. Adland, A. Karma, and Y. Mishin, Acta Materialia 60, 6528 (2012).
- Yamakov et al. (2002) V. Yamakov, D. Wolf, S. Phillpot, and H. Gleiter, Acta Materialia 50, 61 (2002).
- Millett et al. (2008) P. C. Millett, T. Desai, V. Yamakov, and D. Wolf, Acta Materialia 56, 3688 (2008).
- Wang et al. (2011) Y.-J. Wang, A. Ishii, and S. Ogata, Phys. Rev. B 84, 224102 (2011).
- Chen et al. (2010) Z. Chen, K. T. Chu, D. J. Srolovitz, J. M. Rickman, and M. P. Haataja, Phys. Rev. B 81, 054104 (2010).
- Ananthakrishna (2007) G. Ananthakrishna, Physics Reports 440, 113 (2007).
- Kabir et al. (2010) M. Kabir, T. T. Lau, D. Rodney, S. Yip, and K. J. Van Vliet, Phys. Rev. Lett. 105, 095501 (2010).
- Clouet (2011) E. Clouet, Phys. Rev. B 84, 092106 (2011).
- Keralavarma et al. (2012) S. M. Keralavarma, T. Cagin, A. Arsenlis, and A. A. Benzerga, Phys. Rev. Lett. 109, 265504 (2012).
- Elder et al. (2002) K. R. Elder, M. Katakowski, M. Haataja, and M. Grant, Phys. Rev. Lett. 88, 245701 (2002).
- Elder and Grant (2004) K. R. Elder and M. Grant, Phys. Rev. E 70, 051605 (2004).
- Elder et al. (2007) K. R. Elder, N. Provatas, J. Berry, P. Stefanovic, and M. Grant, Phys. Rev. B 75, 064107 (2007).
- Provatas and Elder (2011) N. Provatas and K. Elder, Phase-Field Methods in Materials Science and Engineering (WILEY-VCH Verlag GmbH & Co. KGaA, Weinheim, Germany, 2011).
- Emmerich et al. (2012) H. Emmerich, H. Löwen, R. Wittkowski, T. Gruhn, G. I. Tóth, G. Tegze, and L. Gránásy, Advances in Physics 61, 665 (2012).
- Berry et al. (2006) J. Berry, M. Grant, and K. R. Elder, Phys. Rev. E 73, 031609 (2006).
- Stefanovic et al. (2006) P. Stefanovic, M. Haataja, and N. Provatas, Phys. Rev. Lett. 96, 225504 (2006).
- Stefanovic et al. (2009) P. Stefanovic, M. Haataja, and N. Provatas, Phys. Rev. E 80, 046107 (2009).
- Chan et al. (2010) P. Y. Chan, G. Tsekenis, J. Dantzig, K. A. Dahmen, and N. Goldenfeld, Phys. Rev. Lett. 105, 015502 (2010).
- Berry et al. (2012) J. Berry, N. Provatas, J. Rottler, and C. W. Sinclair, Phys. Rev. B 86, 224112 (2012).
- Berry et al. (2014) J. Berry, N. Provatas, J. Rottler, and C. W. Sinclair, Phys. Rev. B 89, 214117 (2014).
- Hirouchi et al. (2010) T. Hirouchi, T. Takaki, and Y. Tomita, International Journal of Mechanical Sciences 52, 309 (2010).
- Greenwood et al. (2010) M. Greenwood, N. Provatas, and J. Rottler, Phys. Rev. Lett. 105, 045702 (2010).
- Greenwood et al. (2011) M. Greenwood, J. Rottler, and N. Provatas, Phys. Rev. E 83, 031601 (2011).
- footnote1 (2015) For simplicity, a mode is not considered, although we do not expect its effect to change any of the physics reported herein.
- Weertman (1975) J. Weertman, in Rate processes in plastic deformation of materials, edited by J. E. Dorn, J. C. M. Li, and A. K. Mukherjee ([Metals Park, Ohio] : American Society for Metals, 1975), pp. 315–336.
- footnote2 (2015) If a constant area or volume constraint is not used, then one must continuously adjust the total system number density in inverse proportion to the volume change, such that the total number of particles remains fixed. It is not clear whether this can be done consistently with a PFC description, as an exact relation between and number of particles is in general not known. If is not adjusted with changes in volume, the volume can change unphysically without bound or penalty as local density peaks or lattice sites are simply created or removed to compensate for the volume change.
- footnote3 (2015) See Supplemental Material at [URL will be inserted by publisher] for animations of (i) hexagonal grain system evolution at various grain sizes (S1), (ii) dislocation nucleation, climb, and pile-up from a single source (S2), (iii) hexagonal grain system evolution with dislocation sources (S3), (iv) dislocation nucleation, climb, pile-up, and polygonization from multiple sources (S4).
- Mughrabi (1983) H. Mughrabi, Acta Metallurgica 31, 1367 (1983).
- Athreya et al. (2007) B. P. Athreya, N. Goldenfeld, J. A. Dantzig, M. Greenwood, and N. Provatas, Phys. Rev. E 76, 056706 (2007).
- Huang et al. (2010) Z.-F. Huang, K. R. Elder, and N. Provatas, Phys. Rev. E 82, 021605 (2010).
- Spatschek and Karma (2010) R. Spatschek and A. Karma, Phys. Rev. B 81, 214201 (2010).
- Ofori-Opoku et al. (2013) N. Ofori-Opoku, J. Stolle, Z.-F. Huang, and N. Provatas, Phys. Rev. B 88, 104106 (2013).
- footnote4 (2015) Similar arguments applied to nucleation and growth of dislocation loops in 3D lead to . This in general indicates an even faster divergence than in 2D, as loops relieve strain more rapidly than straight lines, especially for large radii .
- Hirth and Lothe (1982) J. P. Hirth and J. Lothe, Theory of Dislocations (John Wiley & Sons, Inc., 1982), 2nd ed.