Measurements of the top quark mass using the ATLAS and CMS detectors at the LHC
Abstract:
The latest measurements of the top quark mass obtained by the ATLAS and CMS experiments at the LHC for centre-of-mass energies of and TeV are presented. The mass of the top quark is measured using several methods and channels, including the reconstructed invariant mass distribution of the top quark and shapes of top quark decay distributions. Measurements based on the inclusive cross section and novel observables based on the differential cross section in the channel are also discussed. The results of the various channels are combined and compared to the world average.
1 Introduction
The top quark is by far the heaviest known fermion and the heaviest known fundamental particle. This gives the top-quark mass a unique role in over-constraining Standard Model (SM) fits [1] and testing their validity in comparisons to direct mass measurements. Together with the mass of the Higgs boson the top-quark mass has consequences on the SM vacuum stability [2].
With integrated luminosities of about and for both LHC experiments (ATLAS [3] and CMS [4]) at and , respectively, the statistical and systematic uncertainties on the top-quark mass reach levels well below – with smaller uncertainties reached at due to the increased statistics. The distinction of the theoretical description of the measured parameter – either the parameter in the underlying Monte Carlo generator, the mass term in the top-quark propagator (the pole mass) or the mass in a well defined low-scale short distance scheme [5, 6] – is gaining in importance.
2 Template and Ideogram Based Measurements
The typical analysis path for measurements of the top-quark mass relying on the mass parameter of the underlying Monte Carlo generator is to reconstruct and select candidate events in data and simulations – often refined by a kinematic fit that constrains the four-vectors of the decay products of the top-quark candidates, within assigned uncertainties, to stem from a heavy quark decay of the same mass for both candidates. The decay is assumed to proceed via . The known mass is typically used in the two possible decay channels of the to two quark-jets or a lepton and neutrino to further constrain the kinematic fit. In the end a likelihood fit of the reconstructed top-quark mass for the hadronic decay of the or estimators sensitive to it like the invariant mass of the lepton and , , in the leptonic decay channel with as free parameter is used to measure the top-quark mass. In ATLAS the likelihood fits are often based on templates [7], while CMS uses both templates and ideograms [8]. Templates are probability-density-functions constructed from full Monte Carlo simulations in the final observables (for example the reconstructed top-quark mass). For a variety of different top-quark-mass settings in the Monte Carlo and, optionally, variations in other quantities, like a systematic shift in the jet-energy scale (JES or JSF), templates are obtained for signal and background samples. Their shapes are parameterised and for the signal samples the shape parameters are expressed as polynomial in and the other varied quantities. Ideograms extend the idea of templates by allowing multiple permutations per event – in the signal templates and in the final observable. The signal templates for the reconstructed top-quark mass can differ for example by the number of correct matches of the reconstructed decay products with generator-level partons and in each event all possible assignments of reconstructed objects to partons are used with a weight proportional to the goodness-of-fit probability ().
2.1 Lepton plus Jets Channel
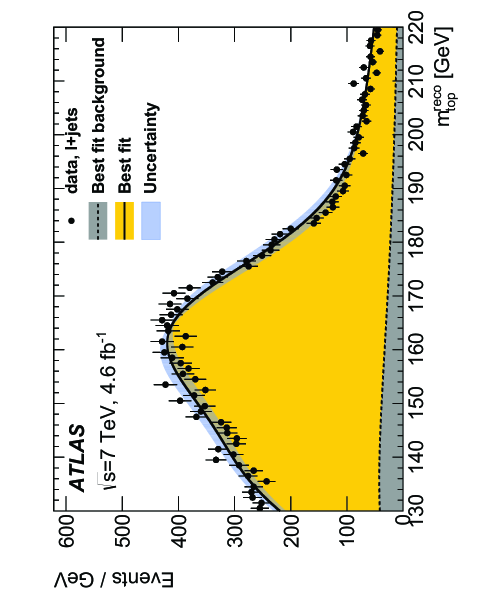
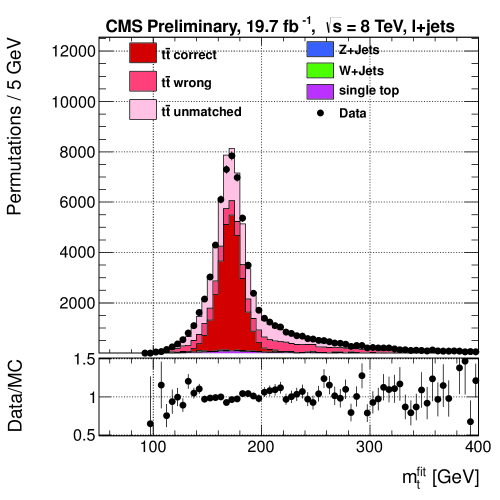
Experimentally, the most precise measurements are achieved in the lepton+jets channel, benefitting from moderate backgrounds, due to the lepton requirements, and one fully reconstructible top-quark candidate. The most recent analyses by ATLAS [9] (at ) and CMS [10] (at ) use events with isolated single electrons or muons with large transverse momentum () in the central detector and at least central jets with large . At least one (ATLAS) or exactly two (CMS) of the jets need to be -tagged. Both experiments employ kinematic fits as described above and the best permutation is retained in the ATLAS analysis only, while all are kept in the CMS analysis with the appropriate . In ATLAS a template fit is performed in three uncorrelated observables, the reconstructed top-quark mass, , shown in Figure 1 (left), the ratio of the transverse momenta of -tagged over light jets, , and the mass of the , , without the kinematic constraint to its known value. The two additional observables are sensitive to the JES of -tagged and light jets, respectively, which reduces the systematic error on the obtained top-quark mass substantially: , with the dominant systematic uncertainties stemming from JES, -tagging (bTAG) and the modelling of initial- and final-state radiation (ISR/FSR). In CMS the ideograms are obtained in two uncorrelated observables, the top-quark mass after kinematic fit for all -weighted permutations, , shown in Figure 1 (right), and the mass of the , , without the mass constraint but also -weighted. The latter reduces the JSF systematic uncertainty on the top-quark mass: , with the dominant systematic uncertainties stemming from JSF of -tagged jets (Flavour JSF), the modelling of multiple soft pp interactions (PileUp) and the modelling of the jet energy resolution (JER).
2.2 Di-Lepton Channel
The cleanest samples of events are obtained in the di-lepton channel, by requiring exactly two oppositely charged leptons (, , or ), with mass-vetoes against and lower mass neutral states in the same flavour channels, large missing transverse momentum, and at least two jets. CMS [11] (at ) keeps the two -tagged jets leading in or supplements with the leading un-tagged jet. ATLAS [9] (at ) requires exactly one or two -tags and assigns the role of the second to the one with the largest -tag weight in the one -tag case. CMS constructs a top-quark-mass estimator from randomised re-reconstructions within the assigned two- and four-vector uncertainties per event as the one with the highest leading-order matrix-element weight. A quadratic fit to the log likelihood values obtained from signal and background template fits at fixed generator mass points leads after un-blinding to: . Renormalisation and factorisation scale variations (), the modelling of fragmentation (b-frag), and the JES dominate the systematic uncertainty. An alternative blinded template fit to in the channel leads to a comparable result [12]: . The ATLAS fit to signal and background templates, where the permutation with the lowest average is retained, yields: . Without the additional constraints on JES and bJES these two sources dominate the systematic uncertainty followed by the modelling of hadronisation (hadro.). Since the correlation to the lepton+jets result is only, both are combined, yielding the preliminary ATLAS Run-1 summary value [9] given in Section 4.
2.3 All-Hadronic Channel
The all-hadronic decay channel provides a fully reconstructed final state for events but suffers from the large multijet background from other QCD processes due to the absence of isolated leptons. The only handle to suppress this background is -tagging and, in addition, data-driven methods are needed to estimate it. ATLAS [13] (at ) requires exactly two -tags among the leading jets and at least central jets, with and for the . The background is estimated from control regions defined by the number of -tags and bins in the of the jet. CMS [14] (at ) requires at least central jets with for the leading and for the other and exactly -tags among the leading . The multijet background is derived with an event-mixing technique. Both experiments reject events not compatible with the hypothesis. ATLAS fits the ratios of -jet mass over -jet mass, , using the permutation of the six jets that fits the assumed to partons hypothesis best, to signal and background templates: . While still being statistically limited, the dominant systematic uncertainty stems from bJES, followed by JES and the modelling of hadronisation. The statistical error takes the correlation of the two measured in each event into account. Like in [10] the CMS analysis uses and in an ideogram based fit with , JSF, signal fraction and fraction of correctly assigned permutations as free parameters: . Flavour JSF and PileUp dominate the systematics, followed by JES. In both experiments the results are cross-checked with several thousand pseudo-experiments and corrected for small observed biases.
3 Measurements of the pole mass
In contrast to the template/ideogram methods discussed above, cross-section-like observables can be used to compare QCD predictions depending on the pole mass, , with unfolded data. The unfolding removes detector effects. The advantage lies in the larger independence from the mass definition in Monte Carlo generators. For the total cross-section, however, a uncertainty translates into a uncertainty in the top-quark mass [15] and the difference from NLO to NNLO is large (). Experimentally the challenges lie in the unfolding of data and the absolute normalization. New shape-like observables as proposed in [16] and discussed in Section 3.2 reduce both theoretical and experimental uncertainties.
3.1 Di-Lepton Channel
The production cross-section in the di-lepton channel is measured by ATLAS [18] at and and by CMS [19] at . Both experiments assume a top-quark mass of in simulations to extract the reconstruction efficiency. Comparing the measured cross-section with theory predictions can be used to extract the top-quark pole mass. A small residual bias from the assumed top-quark mass in the Monte Carlo (through single-top background and reconstruction efficiencies) is corrected for. The CMS analysis [20] from the cross-section (fixing to ) gives: , with larger experimental errors (meas. xsec) compared to the ideogram results and sizeable theoretical and additional systematic uncertainties (from parton density functions (PDF), , and the energy uncertainty of the LHC machine ()). In the ATLAS analysis [18] theoretical uncertainties dominate leading to a large correlation of the results for and . For the result is: . Like for CMS the PDF and uncertainties dominate, followed by the uncertainty in the integrated luminosity (lumi).
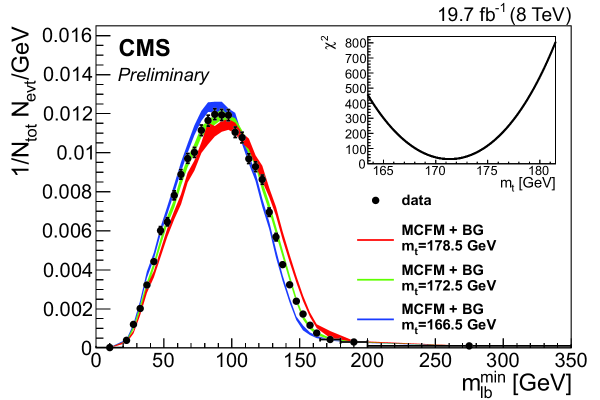
Also at CMS [12] uses a folding technique to map fixed order QCD calculations depending on the top-quark pole mass as implemented in MCFM [21] to predict the shape in . Here, the combination yielding the smallest in the event is kept, and referred to as , which is shown in Figure 2 (left). The response matrices in are obtained from fully simulated MadGraph+Pythia+Geant4 [22, 23, 24] events. This approach leads to: . This result can be compared to the mass extraction from the same data set via the total cross-section calculated at NNLO: , with large uncertainties stemming from the luminosity measurement, background modeling (bkgd) and the assumed matrix element (ME). The comparison demonstrates the advantage of shape-based over total cross-section based methods.
3.2 Top-Quark Pair plus Jet Channel
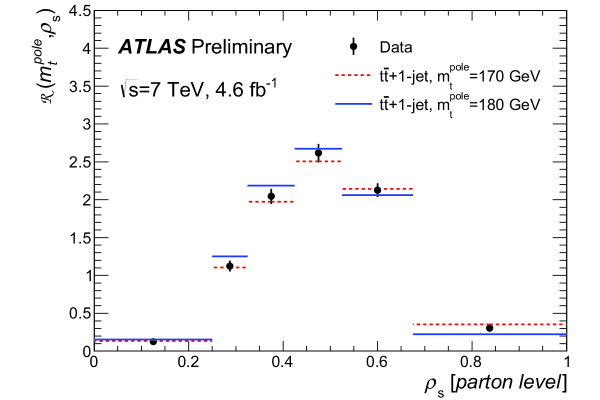
A new type of differential cross section observable is suggested in [16] to measure the top-quark pole mass in the channel: where the differential is taken in , the ratio of an arbitrary mass scale in the vicinity of , here set to over the invariant mass. ATLAS [17] first selects candidate events at similar to the standard analysis in the lepton+jets channel [9] and an additional central jet with . An SVD unfolding [25] with a response matrix from Powheg+Pythia+Geant4 [26, 23, 24] maps the measured to parton level. The unfolded distribution in is shown in Figure 2 (right). The pole mass is then obtained in a -fit to with the last bin being the most sensitive one: .
4 Conclusions
The ATLAS and CMS experiments both measured the top-quark mass in a variety of channels and with different methods in collisions at centre-of-mass energies of and (Run 1). Together with the Tevatron experiments D0 and CDF the 2014 world average of [27] was published. Since then more results became public leading to a preliminary Run 1 average by ATLAS of [9] and a Run 1 average by CMS of [28]. Within uncertainties the results obtained from the different theoretical approaches (Monte Carlo mass vs. pole mass) agree well.
Acknowledgments
I would like to thank the Top-Quark groups of ATLAS and CMS for providing me with the material presented here.
References
- [1] Gfitter Collaboration, M. Baak et al., Eur. Phys. J. C74 (2014) 3046, arXiv:1407.3792.
- [2] G. Degrassi, S. Di Vita, J. Elias-Miro, J. R. Espinosa, G. F. Giudice, et al., JHEP 1208 (2012) 098, arXiv:1205.6497.
- [3] ATLAS Collaboration, JINST 3 (2008) S08003.
- [4] CMS Collaboration, JINST 3 (2008) S08004.
- [5] A. H. Hoang and I. W. Stewart, Nucl. Phys. Proc. Suppl. 185 (2008) 220, arXiv:0808.0222.
- [6] S. Moch, S. Weinzierl, S. Alekhin, J. Blümlein, L. de la Cruz, et al., arXiv:1405.4781.
- [7] CDF Collaboration, Phys. Rev. D73 (2006) 032003, arXiv:hep-ex/0510048.
- [8] DELPHI Collaboration, Eur. Phys. J. C55 (2008) 1, arXiv:0803.2534.
- [9] ATLAS Collaboration, arXiv:1503.05427.
- [10] CMS Collaboration, CMS Physics Analysis Summary CMS-PAS-TOP-14-001 (2014), http://cds.cern.ch/record/1690093.
- [11] CMS Collaboration, CMS Physics Analysis Summary CMS-PAS-TOP-14-010 (2014), http://cds.cern.ch/record/1757467.
- [12] CMS Collaboration, CMS Physics Analysis Summary CMS-PAS-TOP-14-014 (2014), http://cds.cern.ch/record/1966416.
- [13] ATLAS Collaboration, Eur. Phys. J. C75 (2015) 158, arXiv:1409.0832.
- [14] CMS Collaboration, CMS Physics Analysis Summary CMS-PAS-TOP-14-002 (2014), http://cds.cern.ch/record/1743141.
- [15] S. Alekhin, J. Blümlein, and S. Moch, Phys. Rev. D89 (2014) 054028, arXiv:1310.3059.
- [16] S. Alioli, P. Fernandez, J. Fuster, A. Irles, S.-O. Moch, et al., Eur. Phys. J. C73 (2013) 2438, arXiv:1303.6415.
- [17] ATLAS Collaboration, ATLAS Conference Note ATLAS-CONF-2014-053 (2014), http://cds.cern.ch/record/1951319.
- [18] ATLAS Collaboration, Eur. Phys. J. C74 (2014) 3109, arXiv:1406.5375.
- [19] CMS Collaboration, JHEP 1211 (2012) 067, arXiv:1208.2671.
- [20] CMS Collaboration, Phys. Lett. B728 (2014) 496, arXiv:1307.1907.
- [21] J. M. Campbell and R. Ellis, Nucl. Phys. Proc. Suppl. 205-206 (2010) 10, arXiv:1007.3492.
- [22] J. Alwall, M. Herquet, F. Maltoni, O. Mattelaer, and T. Stelzer, JHEP 1106 (2011) 128, arXiv:1106.0522.
- [23] T. Sjostrand, S. Mrenna, and P. Z. Skands, JHEP 0605 (2006) 026, arXiv:hep-ph/0603175.
- [24] Geant4 Collaboration, S. Agostinelli et al., Nucl. Instrum. Meth. A506 (2003) 250.
- [25] A. Höcker and V. Kartvelishvili, Nucl. Instrum. Meth. A372 (1996) 469, arXiv:hep-ph/9509307.
- [26] S. Alioli, P. Nason, C. Oleari, and E. Re, JHEP 1006 (2010) 043, arXiv:1002.2581.
- [27] ATLAS, CDF, CMS, D0 Collaboration, arXiv:1403.4427.
- [28] CMS Collaboration, CMS Physics Analysis Summary CMS-PAS-TOP-14-015 (2014), http://cds.cern.ch/record/1951019.