Magnetic fluctuations driven insulator-to-metal transition in Ca(Ir1-xRux)O3
Abstract
Magnetic fluctuations in transition metal oxides are a subject of intensive research because of the key role they are expected to play in the transition from the Mott insulator to the unconventional metallic phase of these materials, and also as drivers of superconductivity. Despite much effort, a clear link between magnetic fluctuations and the insulator-to-metal transition has not yet been established. Here we report the discovery of a compelling link between magnetic fluctuations and the insulator-to-metal transition in Ca(Ir1-xRux)O3 perovskites as a function of the doping coefficient x. We show that when the material turns from insulator to metal, at a critical value of x 0.3, magnetic fluctuations change their character from antiferromagnetic, a Mott insulator phase, to ferromagnetic, an itinerant electron state with Hund’s orbital coupling. These results are expected to have wide-ranging implications for our understanding of the unconventional properties of strongly correlated electrons systems.
pacs:
75.70.Tj, 72.90.+y, 75.47.LxThe -band metal oxides are most notorious among materials for the complexity of their phase diagram, displaying a formidable array of close and often overlapping transitions between metallic, insulating, magnetic, and even superconducting phases.Varma ; Emery After decades of intensive study a full theoretical understanding of this perplexing phase diagram remains elusive.Tranquada ; McLaughlin ; Fisk ; Pengcheng ; Hwang ; Tokura In a typical scenario, one starts from an insulating, antiferromagnetically ordered state when the d-band is half-filled or nearly so. This is a classic example of a Mott insulator in which the single occupancy of each lattice site prevents free motion of the charge.Verwey ; Mott ; Mott2 Moving away from the half-filled situation (by chemical doping, for example) the charge eventually unfreezes, leading to a metallic phase with striking non Fermi liquid properties, and in some cases to a superconducting phase.Anderson ; Hubbard ; Kanamori In parallel to this, the nature of magnetic correlation changes dramatically from predominantly antiferromagnetic (superexchange-like) in the Mott-localized phase to predominantly ferromagnetic (Hund-like) in the delocalized metallic phase. Even in the absence of the long-range magnetic order, the nature of the magnetic fluctuations is of paramount importance to superconductivity. Since these fluctuations are believed to be the mediators of the attractive interaction that leads to the formation of Cooper pairs,Imada ; Okamoto ; Jackeli ; Qazilbash ; Hwang the nature of magnetic fluctuations thus control the symmetry of the superconducting order parameter.Tokura ; Lee ; Orenstein
Motivated by the above considerations, we have undertaken a careful experimental study of the interplay between the insulator to metal transition and magnetism in the perovskites Ca(Ir1-xRux)O3. These compounds crystallize in an orthorhombic lattice configuration with end members, CaIrO3 (x = 0) and CaRuO3 (x = 1), being a Mott insulator and an anomalous metal, respectively.Ohgushi1 ; Cao2 It is well established that CaIrO3 exhibits antiferromagnetic order for K.Sala2 ; Singh2 The nature of the magnetism in CaRuO3 – whether it is a paramagnet or on the verge of the ferromagnetic instability – is still a matter of debate.Mazin ; Cao Recent experimental studies suggest a coexistence of the quantum magnetic fluctuations and non-Fermi liquid behavior for K, albeit no magnetic order is detected to the lowest measurement temperature.Singh1 On the other hand, significantly different electric and magnetic properties are observed in CaIrO3: sharp peaks in the static and the dynamic magnetic susceptibilities, indicating the absence of magnetic fluctuations, coincide with an upturn in the electrical resistivity at K.Singh2 Because the two end members of the group have so diverse physical and magnetic properties, we find them very suitable for a comprehensive investigation of the insulator-to-metal transition as a function of the chemical doping coefficient x. Experimentally, we have been able to pinpoint the insulator to metal transition at the relatively small value of the chemical doping, x=0.3. The concomitant change in the character of the magnetic fluctuations from static antiferromagnetic to dynamical ferromagnetic is clearly demonstrated in our data, presented below. Remarkably, the value x=0.3 coincides with the level of hole doping for which the wave vector dependent magnetic susceptibility of the Hubbard model changes from being predominantly antiferromagnetic (peak at wave vector ) to be predominantly ferromagnetic (peak at ). Because of their accuracy and consistency these results provide a strong motivation for more comprehensive theories involving the interplay between spin fluctuations and the insulator-to-metal transition (see Fig. 5 below).
Insulator-to-metal transition in perovskites Ca(Ir1-xRux)O3. We have performed detailed study of Ca(Ir1-xRux)O3 compounds to elucidate the correlation between magnetic and electrical properties by systematically varying the chemical doping coefficient x in small steps of 0.1. The high quality polycrystalline samples were synthesized using solid-state reactions and characterized using a high-resolution powder X-ray diffractometer (see Methods and Supplementary Materials for detail). While the chemical substitution of Ir by Ru introduces small changes in the lattice parameters (see Fig. S1 of the Supplementary Materials), the orthorhombic crystal structure is preserved throughout the group with volume of a lattice unit cell at 2292 3.
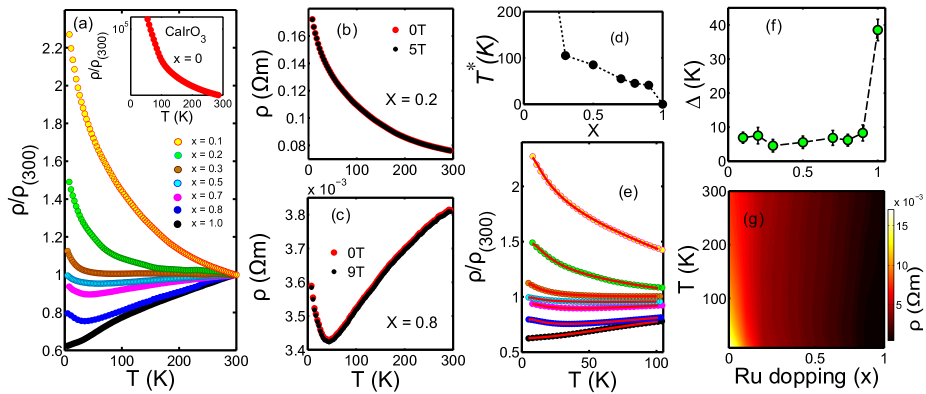
The insulator-to-metal transition as a function of the coefficient x is evident from the electrical transport measurements, as shown in Fig. 1a. The normalized electrical resistivity (/, where is the resistivity at = 300 K) is plotted as a function of temperature for various chemical doping percentages. A gradual evolution from a strong insulating state, x = 0, to a completely metallic state is observed as the coefficient x varies from 0 to 1. An upturn in the electrical resistivity at low temperature is found to be present until x=0.9, albeit very weakly. This behavior is further characterized by a characteristic temperature, , for a given coefficient x. The characteristic temperature decreases almost monotonically for x0.3 and approaches 0 K as x 1 (see Fig. 1d). At x = 1, the compound CaRuO3 exhibits an anomalous metallic behavior at low temperature. Interestingly, the application of a magnetic field has no pronounced effect on the electrical transport data in any of the doping percentages. Characteristic plots of vs. in applied fields are shown in Fig. 1b and 1c for two chemical compositions of x = 0.2 and 0.8, respectively. Electrical resistivity data are further analyzed using an expression that is often used to describe the electrical properties of underdoped cuprates and the spin ladder compounds.Moshchalkov The expression essentially uses a single fitting parameter to correlate electrical behavior to the underlying magnetism.Moshchalkov It is given by:
where 0 is the residual resistivity and is the fitting parameter related to the spin or the charge gap in the system. If , this expression tends to a finite value for , i.e., it describes a metal. For , the resistivity diverges at low (as found in CaIrO3). In Fig. 1e, we have fitted the resistivity data of Ca(Ir1-xRux)O3 below 100 K using above expression. The parameter reduces significantly from 39.6 K to 8.2 K as x varies from 1 to 0.1 (Fig. 1f). At x=0, is found to be negative (-532 K). Since the perovskite Ca(Ir1-xRux)O3 becomes fully metallic as x1, it is no surprise that CaRuO3 (x=1) exhibits the largest positive value of . The transition to the metallic state as functions of the chemical doping coefficient x and temperature is summarized in a contour plot of resistivity in Fig. 1g.
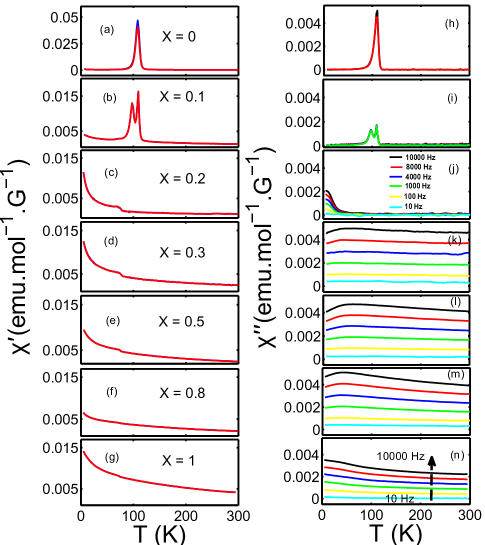
Magnetic fluctuations accompanying the insulator-to-metal transition. Next, we investigate the role of magnetic fluctuations in the insulator to metal transition in Ca(Ir1-xRux)O3. The ac susceptibility measurements provide information about the static and the dynamic magnetic properties of correlated spins at the same time. The full ac susceptibility () is written as () = () + " (), where the real part represents the static magnetic behavior and the imaginary " provides information about the dynamic magnetic properties or, the magnetic fluctuations in a system. The susceptibility measurements in applied ac frequencies of 10-104 Hz were performed for all chemical doping x. Experimental results are plotted in Fig. 2a-2n. The static and dynamic susceptibilities are found to be characteristically different in perovskites with coefficient x 0.2, compared to x 0.2. In CaIrO3 (x = 0), both and " exhibits frequency-independent sharp peaks, suggesting a staggered antiferromagnetic configuration, setting in at a temperature 110 K.Singh2 ; Sala2 ; Ohgushi2 The absence of the frequency dependence of " rules out any spin dynamics as functions of energy (frequency) and temperature. As x is varied from 0 to 0.1, single sharp peaks in and " vs temperature are replaced by two-peaked structures. For further increase in x, the dynamic susceptibility is found to develop frequency dependence that becomes stronger as x increases. For x 0.3, the frequency-dependence of extends up to =300 K and develops a broad maximum in temperature at low temperature. This observation is in stark contrast to the frequency-independent character of . A noticeable feature in the static susceptibility involves the observation of a sharp cusp at K followed by a significant increase in in x0.2 compositions. While it is not clear whether the cusp is associated with the onset of a charge order or with a structural transition in the system, no magnetic order was detected in the detailed neutron scattering measurements on two chemical compositions of x = 1 and x = 0.8 (see Fig. S2 in Supplementary Materials). A comparison of the static and the dynamic susceptibilities in a given chemical composition shows that the system manifests significantly strong dynamic magnetic behavior in compounds with x0.3.
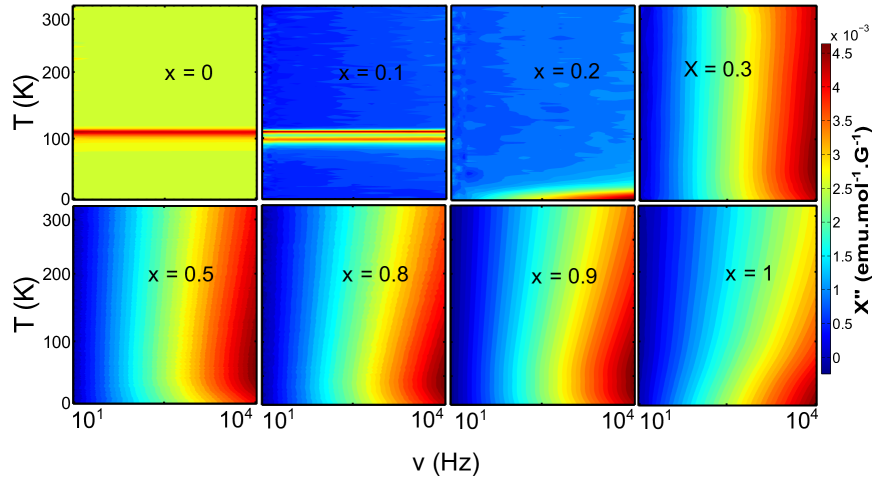
The contour plots of the dynamic susceptibilities in Fig. 3 comprehensively illustrate the evolution of magnetic fluctuations, with long relaxation time, in Ca(Ir1-xRux)O3 as a function of the chemical doping coefficient x. At x = 0, the plot is characterized by a singular line at 110 K, indicating the absence of dynamic behavior. As x increases above x0.3, the small regime of large at high frequency and low temperature (in x = 0.2) extends to higher temperature, thus illustrating significant spin dynamics in compounds with coefficient x0.3. In fact, the dynamic response to the ac susceptibility measurements is found to be strongest in the x = 0.3 composition. A comparison of the contour plots in Fig. 3 to the electrical transport measurements in Fig. 1a reveals one-to-one correspondence between the development of magnetic fluctuation and the onset of the metallic behavior. At x = 0, the compound CaIrO3 is a strong antiferromagnetic Mott insulator with no obvious dynamic properties at long time scale.Singh2 ; Bogdanov ; Ohgushi2 At x = 1, the compound CaRuO3 is a non-Fermi liquid metal with strong dynamic magnetic properties.Lee2 ; Klein ; Singh1 Using this method, we have investigated magnetic fluctuations in various compositions of Ca(Ir1-xRux)O3 perovskites on a time scale of 100 micro-second (corresponding to the applied ac frequency of 104 Hz).
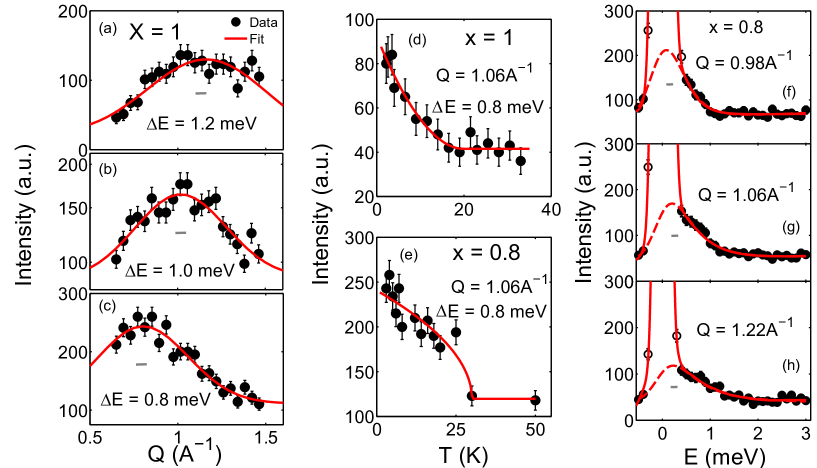
Investigation of magnetic fluctuations at short time scale. Magnetic fluctuations on the shorter time scale are probed using inelastic neutron scattering measurements in two stoichiometries of x = 1 and 0.8. These compositions were chosen for two reasons: first, less iridium content in these compounds reduces absorption of neutrons and second, magnetic fluctuations tend to be stronger for x 0.3. Inelastic neutron scattering measurements were performed on a cold triple axis spectrometer with an energy resolution (FWHM) of 0.16 meV (see Methods for detail). Representative scans in Q at constant energy transfers E (= Ei - Ef), varying between 0.8-1.5 meV, and in energy at constant Q’s are plotted in Fig. 4. The Q-scans at finite energy transfers represent the dynamic structure factor of correlated spins, fluctuating on a time-scale limited by the instrument resolution of 10-12 seconds. The background corrected data in Fig. 4a-c (corresponding to x = 1 composition) are well described by Gaussian lineshape of width much bigger than the instrument Q-resolution, demonstrating the short-range dynamic order in the system. The spatial extent of the short-range dynamic order extends almost up to two unit cells along the -axis or equivalently almost three unit cells along or -axis. Further information about the spin fluctuations in this composition is obtained from the temperature dependent study of the dynamic structure factor. As shown in Fig. 4d, the inelastic intensity of the short-range dynamic structure factor at E = 0.8 meV exhibits a subtle rise below K.
Similar dynamic properties are observed in the Ir-doped compound of x = 0.8 composition. As illustrated in Fig. 4f-4h, the background corrected data is well described by a Lorentzian lineshape convoluted with the Gaussian instrument resolution. The typical line-width (, full width at half maximum) of the Lorentzian curve, 0.5 meV, is found to be much broader than the spectrometer’s resolution (0.16 meV). The integrated intensity of the quasi-elastic peak decreases at higher Q, following the magnetic form factor; hence, confirming magnetic nature of the fluctuations at a time scale limited by the instrument resolution pico-seconds. We have also performed a temperature dependent study of the dynamic structure factor, which shows that the inelastic intensity at E = 0.8 meV increases significantly above the background below 28 K (Fig. 4e). The onset of the dynamic magnetism takes place at a higher temperature in x = 0.8 composition compared to x = 1 composition. This observation is consistent with the dynamic susceptibility measurements where strong magnetic fluctuations, as depicted by temperature and frequency dependences of " in Fig. 3, persist to higher temperature in x = 0.8 composition, compared to x = 1. In both cases, however, magnetic ions are found to fluctuate at both the short and the long time scales. Similar behavior of spin fluctuations at the short time scale is expected to occur in other compositions with x 0.3, where strong magnetic fluctuations at the long time scale are detected in the dynamic susceptibility measurements. Finally, we emphasize that the same regime of chemical doping (0.3x1.0) is associated to the metallic phases in Ca(Ir1-xRux)O3. Neutron scattering measurements were also performed in applied magnetic field to explore possible effects on the static and the dynamic magnetic properties. As shown in Fig. S2 (in Supplementary Materials), no change is observed between the elastic patterns obtained at = 0 T ( = 1.5 K) and = 10 T. Inelastic measurements also manifest similar behavior in both x = 1 and x = 0.8 compositions (see Fig. S3 and Fig. S4 in Supplementary Materials).
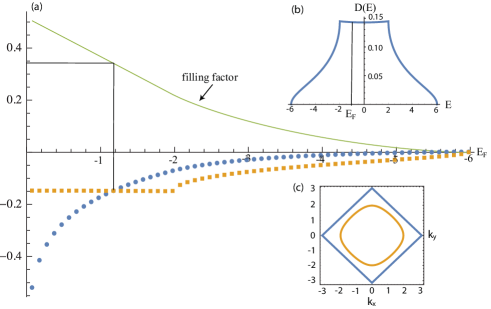
Antiferromagnetic to ferromagnetic crossover in a three dimensional Hubbard band. At x=0 the pristine CaIrO3 is known to be an antiferromagnetic Mott insulator. This system has a half-filled d-band arising from d-orbitals of Ir (configuration ), which are first split by crystal fields into six and four states, and then further split by strong spin-orbit interaction, within the multiplet, into a quartet and a doublet of states – the latter being the half-filled band, which one can roughly model as a half-filled Hubbard band.Imada The ground state of this model is an antiferromagnetic insulator. Chemical substitution of the lighter element Ru, with one electron less than Ir in the d band (configuration ) and much weaker spin-orbit interaction, is expected to destroy the simple one-band Hubbard model. If, however, the doping level is sufficiently low, we can still assume that the model retains, at least qualitatively, its validity. Under this assumption we can view the Ru substitution as a form of “hole doping” in the Hubbard model: in the simplest mean field theory, this is expected to lead to a ferromagnetic metallic phase.Nagaoka ; Zaanen Quantum fluctuations, beyond mean field theory, are expected to wash out long-range ferromagnetism, while preserving strong ferromagnetic fluctuations and, of course, the metallic character of the state. Experimentally, this is precisely what we observe, with the metal insulator transition occurring at the relatively small value of doping, x=0.3, and a concomitant change in the character of the magnetic fluctuations from static antiferromagnetic to dynamical ferromagnetic. Remarkably, the value x=0.3 coincides with the level of hole doping for which the wave vector dependent magnetic susceptibility of the Hubbard model changes from being predominantly antiferromagnetic (peak at wave vector ) to be predominantly ferromagnetic (peak at ). The situation is described in Fig. 5 and its caption.
Discussion
We have investigated the role of dynamic magnetism in the metal-insulator transition process in the family of strongly correlated perovskite compounds Ca(Ir1-xRux)O3. We have shown that the insulator-to-metal transition is accompanied by unambiguous magnetic fluctuations as a function of the chemical doping coefficient x. As the chemical doping coefficient x increases, the system crosses over into the metallic regime with the concurrent development of strong dynamic magnetism. It looks as if the static magnetic order, found in low x compositions, had melted away at x 0.3 and the magnetic ions, “emboldened” by the energy obtained from this melting process, suddenly become highly dynamic. Hence, it is no surprise that the strongest dynamic susceptibility, depicting magnetic fluctuations, is observed for x = 0.3 chemical composition. This is the same composition (x = 0.3) where the onset to the metallic behavior is detected. Therefore, a direct connection between the insulator-to-metal transition and magnetic fluctuations is quite unequivocal. A theoretical analysis of the possible underlying mechanism behind this process is consistent with the experimental evidence.
Magnetic fluctuations and the associated quantum magnetic critical behavior are often considered to be the underlying physics behind the unconventional superconductivity in magnetic materials of the strongly correlated electrons origin.Tranquada ; McLaughlin ; Fisk ; Pengcheng However, a material first becomes a metal, in general, before exhibiting superconductivity as a function of temperature. Therefore, the same magnetic fluctuations that are considered to be at the core of the unconventional superconductivity – such as cuprates, pnictides or the heavy electron systems – must play a key role in driving the metallic behavior. Despite the heavy interest in this topic, the situation is still not well understood. Our joint experimental and theoretical effort provides new information about the insulator-to-metal transition in strongly correlated electronic systems, which in turn will help us develop a robust framework for understanding unconventional superconductivity in these materials.
Methods
The high purity polycrystalline samples of Ca(Ir1-xRux)O3 were synthesized by conventional solid-state reaction method using ultra-pure ingredients of IrO2, RuO2 and CaCO3. Starting materials were mixed in stoichiometric composition, with five percent extra RuO2 to compensate for their rapid evaporation (in Ru-doped perovskites), palletized and sintered at 950o for three days. The furnace cooled samples were grinded, palletized and sintered at 1000o for another three days. Resulting samples were characterized using Siemens D500 powder X-ray diffractometer,NIST confirming the single phase of material. The X-ray diffraction data were analyzed using a widely used commercial software JADE.NIST As shown in Fig. S1 of the supplementary materials, every single peak of the XRD pattern is identified with the orthorhombic structure of Ca(IrRu)O3. Four probe technique was employed to measure electrical properties of Ca(Ir1-xRux)O3 using a closed-cycle refrigerator cooled 9 T magnet with measurement temperature range of 1.5-300 K. Detailed ac susceptibility measurements were performed using a Quantum Design Physical Properties Measurement System with a temperature range of 2-300 K.NIST Neutron scattering measurements were performed on the pristine powder samples of 3.9 g of CaRuO3 and 3.2 g of CaIr0.2Ru0.8O3 on the spin-polarized triple-axis spectrometer at the NIST Center for Neutron Research with fixed final neutron energy of 3.7 meV. Neutron Scattering measurements employed a cold BeO-filter followed by a radial collimator and the focused analyzer. The incoherent scattering from vanadium is used to determine the spectrometer’s resolution in the specified configuration. At this fixed final energy, the spectromete’s resolution (FWHM) was determined to be 0.16 meV.
References
- (1) Varma, C. M., Schmitt-Rink, S. and Abrahams, E. Charge transfer excitations and superconductivity in ionic metals. Solid State Comm. 62, 681 (1987).
- (2) Emery, V. J. Theory of high-Tc superconductivity in oxides. Phys. Rev. Lett. 58, 2794 (1987).
- (3) Tranquada, J. M. et al. Quantum magnetic excitations from stripes in copper oxide superconductors. Nature 429, 531 (2004).
- (4) McLaughlin, A. C., Sher, F. and Attfield, J. P. Negative lattice expansion from the superconductivity antiferromagnetism crossover in ruthenium copper oxides. Nature 436, 829 (2005).
- (5) Fisk, Z. et al. Heavy fermion metals: New highly correlated states of matter. Science 239, 33 (1988).
- (6) Dai, P., Hu, J. and Dagotto, E. Magnetism and its microscopic origin in iron-based high-temperature superconductors. Nature Physics 8, 709 (2012).
- (7) Hwang, H. Y. et al. Emergent phenomena at oxide interfaces. Nature Materials 11, 103 (2012).
- (8) Tokura, Y. Critical features of colossal magnetoresistive manganites. Rep. Prog. Phys. 69, 797 (2006).
- (9) Verwey, E. J. W. Electronic conduction of magnetite and its transition point at low temperatures. Nature 144, 327 (1939).
- (10) Mott, N. F. and Peierls, R. Discussion of the paper by de Boer and Verwey. Proc. Phys. Soc. London 49, 72 (1937).
- (11) Mott, N. F. Metal-Insulator Transitions. Taylor and Francis, London/Philadelphia (1990).
- (12) Anderson, P. W. Solid State Physics. Academic, New York 14, 99 (1963).
- (13) Hubbard, J. Electron correlations in narrow energy bands. Proc. R. Soc. London 276, 238 (1963).
- (14) Kanamori, J. Electron correlation and ferromagnetism of transition metals. Prog. Theor. Phys. 30, 275 (1963).
- (15) Imada, M., Fujimori, A. and Tokura, Y. Metal-insulator transitions. Rev. Mod. Phys. 70, 1039 (1998)
- (16) Okamoto, S. and Millis, A. J. Electronic reconstruction at an interface between a Mott insulator and a band insulator. Nature 428, 630 (2004)
- (17) Jackeli, G. and Khaliullin, G. Mott insulators in the strong spin-orbit coupling limit: From Heisenberg to a quantum compass and Kitaev models. Phys. Rev. Lett. 102, 017205 (2009)
- (18) Qazilbash, M. M. et al. Mott transition in VO2 revealed by infrared spectroscopy and nano-imaging. Science 318, 1750 (2007)
- (19) Lee, P. A., Nagaosa, N. and Wen, X. G. Doping a Mott insulator: Physics of high-temperature superconductivity. Rev. Mod. Phys. 78, 17 (2006).
- (20) Orenstein, J. and Millis, A. J. Advances in the physics of high-temperature superconductivity. Science 288, 468 (2000).
- (21) Ohgushi, K. et al. Metal-insulator transition in Ca1−xNaxIrO3 with post-perovskite structure. Phys. Rev. B 74, 241104(R) (2006).
- (22) Cao, G. et al. Thermal, magnetic, and transport properties of single-crystal Sr1−xCaxRuO3. Phys. Rev. B 56, 321 (1997).
- (23) Sala, M. M. et al. CaIrO3: A spin-orbit Mott insulator beyond the eff=1/2 ground state. Phys. Rev. Lett. 112, 176402 (2014).
- (24) Gunasekera, J. et al. Mott insulator-to-metal transition in yttrium-doped CaIrO3. J. Phys.: Cond. Mat. 27, 052201 (2015).
- (25) Mazin, I. and Singh, D. J. Electronic structure and magnetism in Ru-based perovskites. Phys. Rev. B 56, 2556 (1997).
- (26) Cao, G. et al. Non-Fermi-liquid behavior in single-crystal CaRuO3: Comparison to ferromagnetic SrRuO3. Solid State Comm. 148, 305 (2008).
- (27) Gunasekera, J. et al. Quasi-local critical nature of cooperative paramagnetic fluctuations in CaRuO3 metal. arXiv:1411.2898 (2014).
- (28) Moshchalkov, V. V., Vanacken, J. and Trappeniers L., Phase diagram of high-Tc cuprates: Stripes, pseudogap and effective dimensionality. Phys. Rev. B 64, 214504 (2001).
- (29) Ohgushi, K. et al. Resonant X-ray diffraction study of the strongly spin-orbit-coupled Mott insulator CaIrO3. Phys. Rev. Lett. 110, 217212 (2013).
- (30) Bogdanov, N. et al. Post-perovskite CaIrO3: A j=1/2 quasi-one-dimensional antiferromagnet. Phys. Rev. B 85, 235147 (2012).
- (31) Lee, Y. S. et al. Non-Fermi liquid behavior and scaling of the low-frequency suppression in the optical conductivity spectra of CaRuO3. Phys. Rev. B 66, 041104 (2002).
- (32) Klein, L. et al. Possible non-Fermi-liquid behavior of CaRuO3. Phys. Rev. B 60, 1448 (1999).
- (33) Zaanen, J., Sawatzky, J. and Allen, J. Band gaps and electronic structure of transition-metal compounds. Phys. Rev. Lett. 55, 418 (1985).
- (34) Nagaoka, Y. Ferromagnetism in a narrow, almost half-filled s band. Phys. Rev. 147, 392 (1966).
- (35) National Institute of Standards and Technology or the Department of Commerce does not endorse any particular commercial product.
I Acknowledgements
This work used facilities supported in part by the Department of Commerce. DKS acknowledges support from the MU IGERT program, funded by NSF under grant number DGE-1069091.
II Author contributions
D.K.S envisaged the research idea. Samples were synthesized by J.G. and A.D. The measurements and experimental data analysis were carried out by J.G., L.H., T.H., A.D. and D.K.S. Theoretical analysis was carried out by G.V. and the paper was written by D.K.S. and G.V.
III Additional information
Competing Financial Interests Authors declare no competing financial interests.