Not In Our Backyard: Spectroscopic Support for the CLASH z=11 Candidate MACS0647-JD
Abstract
We report on our first set of spectroscopic Hubble Space Telescope observations of the candidate galaxy strongly lensed by the MACSJ0647.7+7015 galaxy cluster. The three lensed images are faint and we show that these early slitless grism observations are of sufficient depth to investigate whether this high-redshift candidate, identified by its strong photometric break at , could possibly be an emission line galaxy at a much lower redshift. While such an interloper would imply the existence of a rather peculiar object, we show here that such strong emission lines would clearly have been detected. Comparing realistic, two-dimensional simulations to these new observations we would expect the necessary emission lines to be detected at while we see no evidence for such lines in the dispersed data of any of the three lensed images. We therefore exclude that this object could be a low redshift emission line interloper, which significantly increases the likelihood of this candidate being a bona fide galaxy.
1 Introduction
The search for the first galaxies has been at the forefront of extragalactic astronomy ever since the initial discovery that QSOs are so distant that their UV spectral features were redshifted into the optical pass-bands (Schmidt, 1963). Owing to their high space density, star forming galaxies comprise a large fraction of the high-z galaxy population available to us at the highest redshifts. Gravitational lensing is an efficient method that allows the detection of high redshift star forming galaxy candidates that would otherwise have luminosities that are too faint to be detected using current space- or ground-based observatories (Wyithe et al., 2011).
A strong candidate was identified by Coe et al. (2013) in observations of the galaxy cluster MACSJ0647.7+7015. These observations were made as part of the Cluster Lensing And Supernova survey with Hubble (CLASH, Postman et al., 2012) program. Analysis of three separate lensed images (JD1, JD2 and JD3) of the faint red object in near infrared pass-bands led Coe et al. (2013) to conclude that this target was a strong candidate for a galaxy. Three images of the same high redshift candidate were identified with magnification factors estimated to be and 2 for the JD1, JD2, and JD3 images, respectively. The three images are magnified to F160W AB magnitudes of and 27.3, respectively. All three images show no detected flux in observations taken in 15 different HST filters over a wavelength range of . However, all three were detected in the F140W ( at ) and F160W ( at ) filters. While Coe et al. (2013) ruled out that this source could be a low-redshift interloper by considering a variety of possible low-redshift objects and the strength of the lensing model, their conclusion relied on the detection of this object in only two infrared broad band filters, while this source remained undetected at the longer wavelengths probed by relatively low signal-to-noise Spitzer/IRAC observations at and . The authors pointed out that the discovery of such an object was consistent with expectations extrapolated from (Bradley et al., 2012) but is in conflict with the significantly lower than expected number of detected by Bouwens et al. (2014) and Oesch et al. (2013). Results from Bradley et al. (2012); Oesch et al. (2013) were indicative of a dramatic buildup in the number of galaxies and of the cosmic star formation rate density over a very short period of time ( Myr) between and 8. This was later repeatedly confirmed by subsequent observations as well as re-analyses of earlier data (e.g. Oesch et al., 2014a, b; Ishigaki et al., 2014; Zheng et al., 2014; Bouwens et al., 2014). There is currently only one other multiply imaged galaxy at (Zitrin et al., 2014).The only other candidate to date is the candidate UDF12-3954-6284 (Ellis et al., 2013). This source has only been detected in a single band and it can therefore be more easily explained away as being a lower-redshift interloper with strong nebular emission (Pirzkal et al., 2013). However, UDF12-3954-6284 remains a possible high-redshift candidate as no emission lines have been conclusively detected in subsequent observations and analyses (Bouwens et al., 2013; Brammer et al., 2013; Capak et al., 2013).
Confirming the nature of high-redshift candidates requires spectroscopic observations. If some of the very few candidates already identified were to be shown to be intermediate redshift sources, then the observed deficit of galaxies at would be even greater, requiring an even more rapid buildup of early galaxies. Unfortunately, spectroscopic confirmation of high-redshift candidates has lagged behind due to the faintness of the sources, the apparent lack of Ly- emission in high-redshift galaxies, and the bright infrared sky background in ground based observations (Shibuya et al., 2012; Ono et al., 2012). The unlensed Hubble Ultra Deep Field (HUDF Beckwith et al., 2006) candidates are significantly fainter ( F160W AB ), prohibiting spectroscopic confirmation with current telescopes and limiting the spectroscopic studies possible with future telescopes. Fortunately, cluster lensing magnifies images of the MACS0647-JD candidate such that space-based low-resolution spectroscopy is feasible.
While the possibility that this object is a low redshift emission line galaxy is in contradiction with current lens models, spectroscopically ruling out that this object is not a low redshift star forming galaxy is important because our treatment of the nebular emission might be simplistic and incomplete. There is empirical evidence for the existence of faint moderate redshift galaxies with very strong emission lines. Straughn et al. (2011) identified several extreme emission line objects in Early Release Science observations using the G102 and G141 WFC3 grisms. Their Figure 3, for example, shows the observed spectrum of a F098M 26.87 AB magnitude source (ID397) at z=1.76 and which has a very strong [OIII]/H doublet (, observed EW). This emission line is sufficient to produce a photometric break of nearly two AB magnitudes and is nearly as extreme as what would be required to reproduce the flux measured in MACS0647-JD (). See also Frye et al. (2012) for other examples of extreme emission line galaxies with large single emission line fluxes of up to erg s-1 cm-2.
Redshift confirmation is therefore essential to definitively rule out a low redshift emission line interloper (or perhaps discover the true nature of a very interesting galaxy).
2 Observations
This paper is based on a set of new Hubble Space Telescope near-infrared stilless spectroscopic observations of the MACSJ0647.7+7015 cluster. As part of a follow-up project, we will be observing this cluster for 12 orbits using the G141 grism on the Wide Field Camera 3 (WFC3). These observations are split in three epochs, revisiting this field at different position angle on the sky. The position angles were chosen to minimize the amount of spectral contamination in the spectra of our target and to provide stronger, independent detections of any spectral break or emission lines in the spectra of this source. We have obtained our first set of observations, which we present here. The data were processed using the aXe data reduction package (Pirzkal et al., 2001; Kümmel et al., 2009), using a custom sky subtraction step which includes different components for Zodiacal light, Earth limb, and stray light. More details on this sky subtraction can be found in Brammer et al. (2014). We used archival data to create mosaics of the field in the F105, F125W, F140W and F160W filters and to model the SED of every object in the field. This allowed us to model the spectral contamination caused by nearby objects using aXe’s FluxCube quantitative estimates. This approach also allowed us to perform both regular and optimally weighted spectral extractions. Estimating spectral contamination is crucial when analyzing slitless spectroscopic because overlapping spectra can cause features that look very similar to spectral breaks and zeroth dispersion orders of nearby sources can also look similar to strong emission lines. A complete understanding of the field is therefore needed to rule out spectral contamination as the cause of any feature we detect in a spectrum.
3 High redshift or Low Redshift Emission Line Interloper?
While Coe et al. (2013) suggest the most plausible explanation for the detection of MACS0647-JD in the F140W and F160W filters is that the object is a lensed galaxy at z=11, it is not the only possible scenario. Amongst the possible scenarios considered by the authors, one consists of the coincidental presence of two emission lines, one in each filter, to mimic a photometric break.
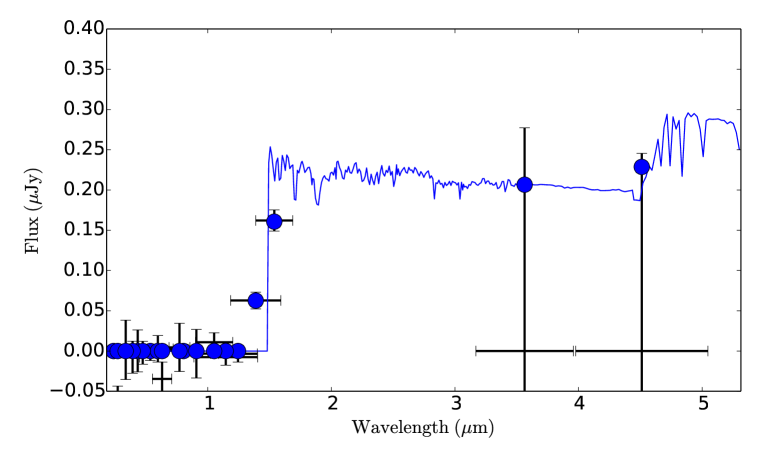
To further explore this, we started by re-fitting the data from Table 2 of Coe et al. (2013) using the Monte Carlo Markov Chain approach (MCMC) described extensively in Pirzkal et al. (2012) and used to analyze other high-redshift candidates (Pirzkal et al., 2013). Our approach uses Bruzual & Charlot (2003) stellar population models, a Salpeter initial mass function, and SSP models. The free parameters are the redshift, stellar mass, stellar age, extinction level (Calzetti et al., 2000), metallically and the ionizing photon escape fraction. This new analysis confirmed that the Coe et al. (2013) photometry were better fit, especially at bluer wavelengths, by a template consistent with a high-redshift Lyman break object at . Figure 1 demonstrates that a galaxy at a redshift of provides a very good fit. Although, as we show, such a model would require a significant amount of flux, about the same level that was detected in the F160W filter, in the IRAC bands at , the IRAC data are not very sensitive and are consistent with a high-redshift Lyman-Break galaxy model.
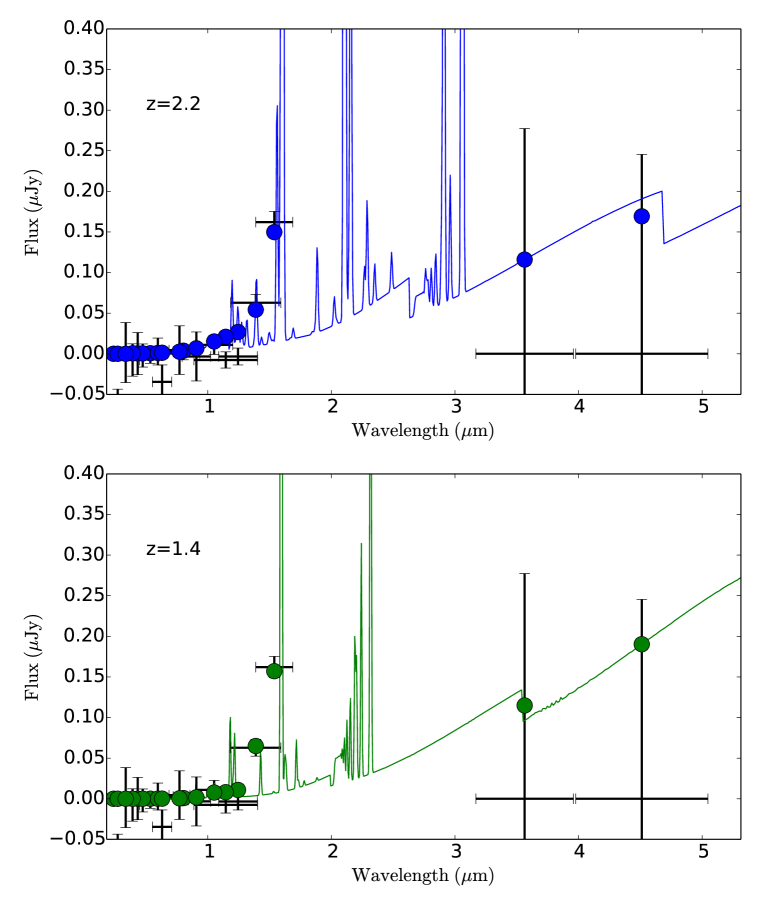
Since the MCMC SED fitting approach allows us to fully explore our input parameter space, we can examine what low redshift models () best fit the photometric observations. However, this approach is ultimately limited by our handling of the nebular emission process, which we assume here to be the source of the high Equivalent Width (EW) lines in the spectra of our simulated star forming galaxies. In Figure 2, we show two distinct cases, one at and one at , where a young (few year old) star forming galaxy with strong nebular activity can reproduce the broad band observations. In our treatment of nebular emission, we have assumed the same ionizing photon escape fraction as for the nebular emission. The detailed description of how nebular emission is simulated can be found in Pirzkal et al. (2012). Ultimately, it is the ratio of the nebular line emission to the continuum emission which limits how much of the broad-band photometric break can be reproduced by the nebular emission lines of our models . We also must resort to an amount of extinction large enough () to quench the amount of blue light, including the nebular continuum light, so that such an object can remain undetected in broad band filters blue-ward below . As Figure 2 shows, a galaxy with H + [O III] lines of combined flux of , with a rest-frame Equivalent Width (EW) of , reproduces the observed fluxes, with [O III] redshifted just red-ward of F140W, contributing the extra observed flux to F160W. Similarly, a galaxy with equally strong H emission could also possibly reproduce the observations.
Our multiple nebular emission lines model strongly constrains the redshifts at which we would expect a low redshift interloper to be (strong H emission) and (strong H + [O III] emission). As shown in Figure 2, in order to produce the observe F140W flux levels, fainter emission lines are required. This places strong constraints on the wavelength range at which strong emission lines are expected. Even if our detailed treatment of nebular emission was inaccurate, the observed photometric break implies the existence of some sort of bright emission line between to (the combined wavelength coverage of the F140W and F160W filters). This is well within the bandpass of the G141 observations.
As demonstrated here, it is possible to create a scenario in which emission lines of a relatively low-z galaxy can mimic the photometric break of a higher redshift object. While these models would have to be cherry-picked and might appear to be unphysical and contrived, the simplest and most direct way to rule out that any of these scenarios are taking place is by demonstrating the absence of strong emission lines in spectroscopic observations of this source.
4 Slitless Observations
The confirmation of a low-redshift emission line interloper would imply the existence of a rather peculiar galaxy. The HST WFC3 grism mode, and its resolution of a few tens of angstroms per resolution element is extremely adept at detecting emission line objects (Straughn et al., 2011) and provides us with an opportunity to test the scenario proposed in the previous section.
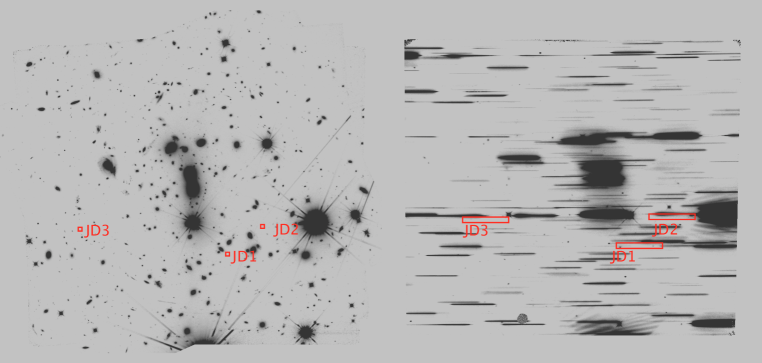
As shown in the middle panel of Figure 3, the WFC3 Grism field is extremely crowded and slitless spectroscopic observations are therefore difficult. Most spectra, especially the ones from fainter sources such as the three lensed images of MACS0647-JD, are contaminated by the spectra of nearby objects. On the other hand, the WFC3 G141 grism is well understood, well calibrated, and WFC3 has has been remarkably stable over the past six years. We are therefore able to generate very accurate two-dimensional simulations of what this field would look when observed with the WFC3 G141 grism. The inputs of these simulations are mosaics of the entire MACSJ0647.7+7015 field using data from the CLASH program. Mosaics in the F105W, F125W, F140W and F160W can then be used to detect the footprint and estimate the spectral energy distribution of every object in the field. Simulations are then generated by using the aXeSIM package, along with the photometric data and the latest WFC3 G141 calibration products. With the exception of the still poorly calibrated zeroth spectral order, the resulting simulations are a very good match to our observations. These simulations are similar to what is done when computing contamination and optimal extraction weigths as part of routine grism extraction (e.g. Pirzkal et al., 2004; Brammer et al., 2012). The observations and the simulations are shown in the middle and right panels of Figure 3, respectively.
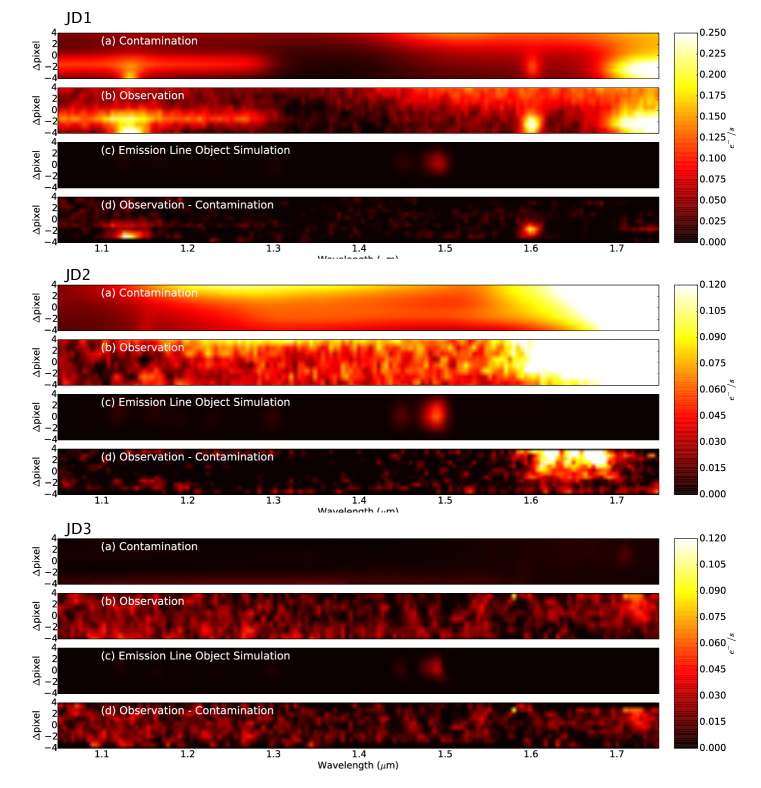
Figure 4 qualitatively compares our shallow observations to our simulated dispersed image of the strong emission line source already shown in Figure 2. In these simulations, and since these three lensed images are partially resolved, we have conservatively set the size of the emission line region to be equal to the measured sizes of JD1, JD2 and JD3 in the broad band images. These sizes were measured from the available broad band imaging and identical to the ones listed in Coe et al. (2013). Our simulated emission lines are therefore more spatially diluted than they would be if we had simply assumed an unresolved point source. It is immediately obvious that any emission line(s) bright enough to reproduce the observed broad band photometric break would be detected in 3 orbit grism observations. As Figure 4 shows, there is no sign of such an emission line in our slitless observations for either JD1, JD2 or JD3, demonstrating with little doubt that the CLASH candidate is devoid of any bright emission lines in the wavelength range covered by the G141 grism. This significantly strengthens the case that this source is a Lyman-break galaxy.
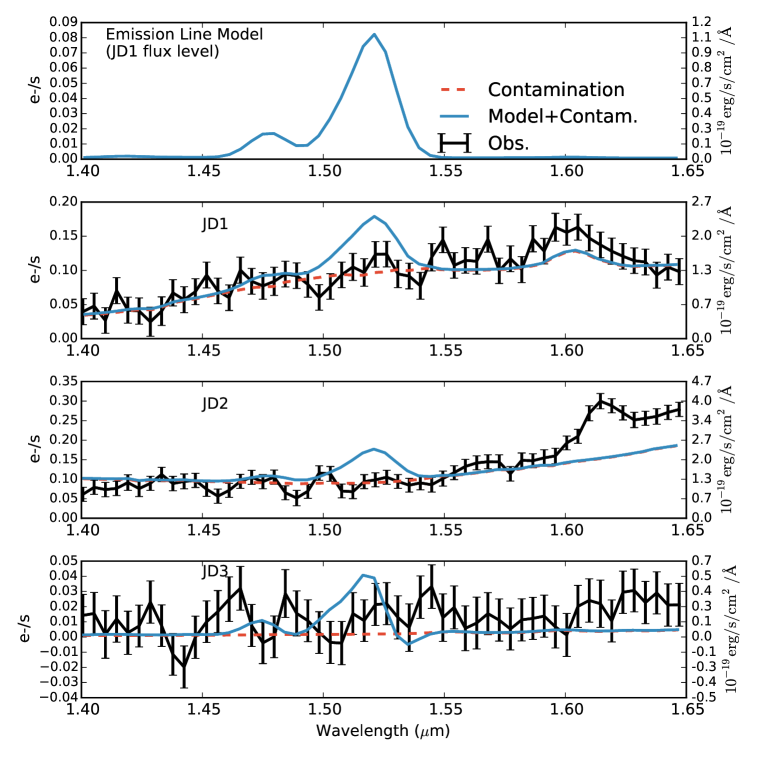
For a more quantitative comparison, we show the extracted one-dimensional spectra of the three MACSJ0647-JD sources in Figure 5. As this Figure shows, the low spectral resolution of the G141 grism would make the emission lines shown in Figure 2 less prominent and broader. These lines would nevertheless remain readily detectable at the level. As we described in Section 3, there are actually narrow ranges of redshifts () over which our models can reproduce the broad-band photometric break. While this would result in the emission line in Figure 4 to be shifted, it would remain easily detectable in at least JD1 and JD3, where contamination is either at longer wavelength, or vertically offset from where we would expect an emission line to be located.
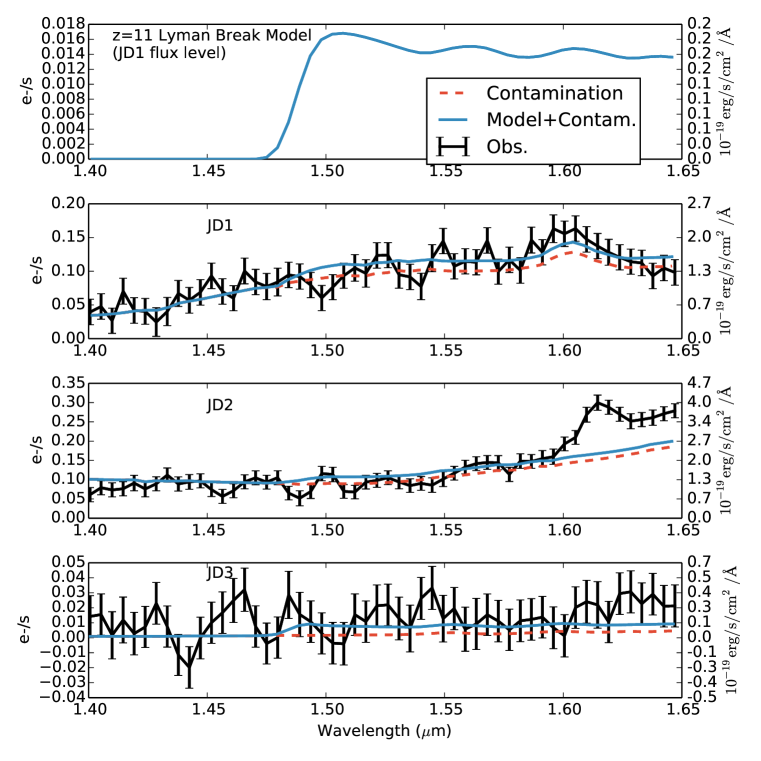
Figure 5 shows the spectra in units of with the corresponding flux limits shown on the right axis. We show these extracted spectra in these units as their noise level is sky dominated and approximately constant (). Figures 6 shows the extracted spectra of the three lensed images as well as that of the LBG presented in Figure 1. The expected flux levels for JD1, shown in the top panel of this Figure are and the relatively high level of contamination (red dashed line) renders the detection of the continuum impossible in these observations. The forthcoming observations, chosen to avoid contamination, will triple the integration time and greatly improve our odds of detecting the continuum emission from this source.
5 Conclusion
We have presented results based on our shallow, first epoch slitless spectroscopic observations of the galaxy cluster MACSJ0647.7+7015. These data have allowed us to obtain the first spectroscopic observations of the three lensed images of the LBG candidate MACSJ0647-JD of Coe et al. (2013). Following a detailed modeling of the entire field of view, we showed that we can exclude a scenario in which the photometric break at in the SED of this object could be caused by a large EW emission line. Any emission line strong enough to produce the observed broad band photometric break would have been easily detected in these observations. We conclude that this object remains an extremely strong candidate for a genuine galaxy. Based on the simulations in this paper, we expect the continuum level red-ward of the Lyman Break to be detected in planned deeper future observations.
References
- Beckwith et al. (2006) Beckwith, S. V. W., Stiavelli, M., Koekemoer, A. M., et al. 2006, AJ, 132, 1729
- Bouwens et al. (2013) Bouwens, R. J., Oesch, P. A., Illingworth, G. D., et al. 2013, ApJ, 765, L16
- Bouwens et al. (2014) Bouwens, R. J., Bradley, L., Zitrin, A., et al. 2014, ApJ, 795, 126
- Brammer et al. (2012) Brammer, G. B., van Dokkum, P. G., Franx, M., et al. 2012, ApJS, 200, 13
- Brammer et al. (2013) Brammer, G. B., van Dokkum, P. G., Illingworth, G. D., et al. 2013, ApJ, 765, L2
- Brammer et al. (2014) Brammer, G. B et al.. 2014, HST WFC3-ISR, TBD
- Bradley et al. (2012) Bradley, L. D., Trenti, M., Oesch, P. A., et al. 2012, ApJ, 760, 108
- Bruzual & Charlot (2003) Bruzual, G.,& Charlot, S. 2003, MNRAS, 344, 1000
- Calzetti et al. (2000) Calzetti, D., Armus, L., Bohlin, R. C., et al. 2000, ApJ, 533, 682
- Capak et al. (2013) Capak, P., Faisst, A., Vieira, J. D., et al. 2013, ApJ, 773, L14
- Coe et al. (2013) Coe, D., Zitrin, A., Carrasco, M., et al. 2013, ApJ, 762, 32
- Ellis et al. (2013) Ellis, R. S., McLure, R. J., Dunlop, J. S., et al. 2013, ApJ, 763, L7
- Frye et al. (2012) Frye, B. L., Hurley, M., Bowen, D. V., et al. 2012, ApJ, 754, 17
- Ishigaki et al. (2014) Ishigaki, M., Kawamata, R., Ouchi, M., et al. 2014, arXiv:1408.6903
- Kümmel et al. (2009) Kümmel, M., Walsh, J. R., Pirzkal, N., et al. 2009, PASP, 121, 59
- Ono et al. (2012) Ono, Y., Ouchi, M., Mobasher, B., et al. 2012, ApJ, 744, 83
- Oesch et al. (2013) Oesch, P. A., Bouwens, R. J., Illingworth, G. D., et al. 2013, ApJ, 773, 75
- Oesch et al. (2014a) Oesch, P. A., Bouwens, R. J., Illingworth, G. D., et al. 2014, ApJ, 786, 108
- Oesch et al. (2014b) Oesch, P. A., Bouwens, R. J., Illingworth, G. D., et al. 2014, arXiv:1409.1228
- Maraston (2005) Maraston, C. 2005, MNRAS, 362, 799
- Pirzkal et al. (2001) Pirzkal, N., Pasquali, A., & Demleitner, M. 2001, ST-ECF Newslett., 29, 5
- Pirzkal et al. (2004) Pirzkal, N., Xu, C., Malhotra, S., et al. 2004, ApJS, 154, 501
- Pirzkal et al. (2012) Pirzkal, N., Rothberg, B., Nilsson, K. K., et al. 2012, ApJ, 748, 122
- Pirzkal et al. (2013) Pirzkal, N., Rothberg, B., Ryan, R., et al. 2013, ApJ, 775, 11
- Postman et al. (2012) Postman, M., Coe, D., Benítez, N., et al. 2012, ApJS, 199, 25
- Schmidt (1963) Schmidt, M. 1983, Nature, 197, 1040
- Shibuya et al. (2012) Shibuya, T., Kashikawa, N., Ota, K., et al. 2012, ApJ, 752, 114
- Straughn et al. (2011) Straughn, A. N., Kuntschner, H., Kümmel, M., et al. 2011, AJ, 141, 14
- Wyithe et al. (2011) Wyithe, J. S. B., Yan, H., Windhorst, R. A., & Mao, S. 2011, Nature, 469, 181
- Zheng et al. (2014) Zheng, W., Shu, X., Moustakas, J., et al. 2014, ApJ, 795, 93
- Zitrin et al. (2014) Zitrin, A., Zheng, W., Broadhurst, T., et al. 2014, ApJ, 793, LL12