Peering through the holes: the far-UV color of star-forming galaxies at and the escaping fraction of ionizing radiation
Abstract
Aims. We aim to investigate the effect of the escaping ionizing radiation on the color selection of high-redshift galaxies and identify candidate Lyman-continuum (LyC) emitters.
Methods. We used the intergalactic medium (IGM) prescription of Inoue et al. (2014) and galaxy synthesis models of Bruzual & Charlot (2003) to properly treat the ultraviolet stellar emission and the stochasticity of the intergalactic transmission and mean free path in the ionizing regime. Color tracks were computed by turning the escape fraction fesc of ionizing radiation on or off.
Results. At variance with recent studies, a careful treatment of IGM transmission leads to no significant effects on the high-redshift broad-band color selection, even adopting the most extreme ionizing emission model (with an age of 1Myr, zero dust, and metallicity =0.02). The decreasing mean free path of ionizing photons with increasing redshift further diminishes the contribution of the LyC to broad-band colors. We demonstrate that prominent LyC sources can be selected under suitable conditions by calculating the probability of a null escaping ionizing radiation. This was performed by running ad hoc Monte Carlo simulations anchored to the observed photometry, exploring the stochasticity of the IGM, and comparing the simulated and observed colors that encompass the Lyman edge. The method was applied to a sample of galaxies extracted from the GOODS-S field. A known LyC source at was successfully recovered as a LyC-emitter candidate, and another convincing candidate at is reported. A detailed analysis of the two sources (including their variability and morphology) suggests a possible mixture of stellar and non-stellar (AGN) contribution in the ultraviolet.
Conclusions. The classical broad-band color selection of galaxies does not prevent the inclusion of LyC emitters in the selected samples. High fesc in relatively bright galaxies () could be favored by the presence of a faint AGN that is not easily detected at any wavelength. A hybrid stellar and non-stellar (AGN) ionizing emission could coexist in these systems and explain the tensions found among the UV excess and the stellar population synthesis models reported in literature.
Key Words.:
Galaxies: high - redshift; Galaxies: formation; Galaxies: distances and redshifts1 Introduction
In the past two decades, photometric redshift and color selection techniques have been widely used to identify high-redshift galaxies up to the reionization epoch, (Steidel et al. 1999; Bunker et al. 2004; Giavalisco et al. 2004; Vanzella et al. 2009; Castellano et al. 2010; Grazian et al. 2011; McLure et al. 2013; Finkelstein et al. 2012; Bouwens et al. 2014). The efficiency of the selection and the volume probed depend on the photometric system, the depth of the survey (Duncan et al., 2014), the contribution of nebular emission (e.g., Schaerer & de Barros 2010; Inoue 2011a) and the intrinsic star-formation history and duty cycle over which a galaxy becomes UV-bright and detectable in the ultraviolet (Wyithe et al. 2104). Potential contaminants include stellar sources, time-variable events like supernovae, and spurious sources (e.g., Bouwens et al. 2014). Interveneing lower redshift objects that are not spatially resolved (or not de-blended) can also alter the observed magnitudes. Therefore, a well-defined cosmological volume (i.e., redshift interval) does not have a well-defined corresponding region in color space.
The global shape of the spectral energy distribution and the discontinuities in the emerging electromagnetic spectrum have been used to estimate the redshift probability distribution functions (i.e., photometric redshifts). Typical observed breaks in the ultraviolet-optical regime are the Lyman edge at 912Å, produced by the photoelectric absorption of neutral hydrogen in the stars, the interstellar medium and the intergalactic medium, the -break (1215.7Å) caused by the redshift-dependent intergalactic transmission blueward of the transition, and the Balmer break (Å), a proxy of the age of the stellar populations. The contribution of the nebular line emission has also been demonstrated to be significant at high redshift by mimicking, attenuating, or boosting the expected underlying breaks (e.g., Balmer and/or -breaks, e.g., Schaerer & de Barros 2009,2010; de Barros et al. 2014; Vanzella et al. 2009) or generating evident discontinuities (jumps) in the photometry, as measured in extreme emission-line galaxies (e.g., van der Wel et al. 2011; Amorin et al. 2011; Maseda et al. 2014) or in sources in which the signature of the emission line or the [O iii] emission structure have been detected in the Spitzer/IRAC channels at redshift and , respectively (Shim et al. 2011; Smit et al. 2013). Broad absorption features like the 2175Å bump are also expected to introduce dips in the photometry if a Milky Way-type extinction curve is present at high redshift (e.g., Capak et al 2011; Kimm & Cen 2013).
Of these discontinuities, the Lyman edge (912Å) in star-forming galaxies is still subject of investigation. Currently, a solid and direct measure of the stellar Lyman break at high redshift () has not been reported. This is relevant for characterizing sources responsible for hydrogen reionization and is still an active line of research at any redshift. A statistically significant sample of sources with a solid Lyman-continuum (LyC) detection and a comprehensive view on how it is spatially distributed relative to non-ionizing light are still lacking (e.g., Vanzella et al. 2012; Nestor et al. 2013; Iwata et al. 2009; Inoue et al. 2011b; Siana et al. 2010). Observationally, this study is further complicated by the opacity of the intergalactic medium (IGM), which becomes significant with increasing redshift. On the one hand, this opacity, coupled with the internal absorption in the galaxy, allows us to select high-z galaxies through the Lyman-break technique mentioned above, on the other hand, it could prevent us from selecting sources with prominent escaping ionizing flux. Recently, Cooke et al. (2014) concluded that a significant fraction of galaxies is missed in color-color selection diagrams if the ionizing radiation escapes. In practice, at redshift the required drop in the Lyman-break selection method could intrinsically introduce a bias and exclude LyC emitters from the selection.
We have three main aims in the present work: (1) we address the above possible bias in the high-z selection by investigating the effect of the intergalactic transmission on the photometric selection of high-redshift star-forming galaxies when a leakage of ionizing radiation is present. To maximize the effect, we assume that all ionizing photons escape along the line of sight (fesc=1). The nebular line emission and photometric scatter also perturb colors and alter the positions in the color-color plane and have been extensively explored and quantified in the past (e.g., Duncan et al. 2014; Schaerer & de Barros 2010; Dahlen et al. 2010). These effects are also discussed. (2) We present a method for selecting LyC emitters by focusing on the detailed analysis of ultraviolet colors and deriving the probability of a null escape fraction of ionizing photons. This method allows us to identify potential LyC candidates without the use of a dedicated survey. It is presented and applied to a test sample of spectroscopically confirmed galaxies. (3) We test this selection method on a sample of spectroscopically confirmed galaxies for which additional photometric and spectroscopic observations presented here allow us to verify the results of our selection technique.
In Sect. 2 the methodology is presented, and the results of the color-color selection techniques are discussed in Sect. 3. The method is applied to a sample of galaxies lying in the GOODS-S field, and the results are reported in Sect. 4. In Sect. 5 we discuss and summarize the results.
Errors are quoted at the confidence level unless otherwise stated. Magnitudes are given in the AB system (AB ). We assume a cosmology with and km s-1 Mpc-1.
2 Methodology
We derived the synthetic colors of high-z galaxies by adopting a Monte Carlo prescription of the IGM transmission and including spectral templates to properly follow the ultraviolet stellar light emerging from galaxies (a schematic view is shown in Fig. 1). In particular, we included two effects: (1) the treatment of the stochasticity of the IGM transmission both in the ionizing and non-ionizing regimes, in particular, the redshift evolution of the mean free path of ionizing photons is properly considered; (2) we used galaxy templates that cover the Lyman break and the ionizing emission, such that the shape of the Lyman continuum (Å) is suitably represented and is self-consistent with the whole ultraviolet emission. We did not include dust attenuation for two reasons: first, although the dust extinction law would proceed monotonically in the ionizing regime and therefore we expect more attenuation in the LyC than at 1500Å (e.g., Siana et al. (2007), see their Figure 4), we prefer to avoid this extrapolation and assumed for now no dust effect on color-color selection. Second, when we exclude dust, we favor a stronger effect of ionizing radiation on colors, therefore our approach is conservative.
2.1 Intergalactic medium perscription
Inoue & Iwata (2008) (II08 hereafter) calculated the transmission of the IGM by performing dedicated Monte Carlo (MC) simulations. These simulations have been used to correct for intergalactic attenuation and estimate the escape fraction of ionizing radiation (e.g., Iwata et al. 2009; Vanzella et al. 2010b, 2012). The MC simulation of II08 have now been updated based on the new empirical function of intergalactic absorbers presented in Inoue et al. (2014) (I14, hereafter). We briefly recall the main steps. The simulations are based on an empirical distribution function of intergalactic absorbers that simultaneously reproduces the observational statistics of the Lyman alpha forest (LAF), Lyman limit systems (LLSs), and damped Lyman-alpha systems (DLAs). From this assumed distribution function, a large number of absorbers were generated along many lines of sight. The probability of encountering an absorber was assumed to follow a Poisson distribution, and for each one the column density and Doppler parameter were extracted randomly from their (empirical) probability distribution functions.
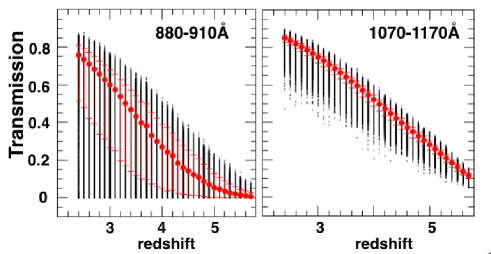
The simulations are therefore anchored to the observed distribution of the number density of absorbers at various column densities (e.g., Prochaska et al. 2009, 2010, 2014; Songaila & Cowie 2010; O’Meara et al. 2013), and verified to be consistent with the mean transmission (Becker et al. 2013; Faucher-Giguère et al. 2008) and with the mean free path of ionizing photons (Worseck et al. 2014) in the redshift interval 1-6 (see I14 for more details). We also verified that the mean and scatter at Å was in line with that observed in QSOs studies (e.g., Faucher-Giguère et al. 2008; Rollinde et al. 2013). The distributions of the median transmissions with the central 68% intervals computed in the rest-frame ranges Å and Å are shown in Fig. 2, in which the asymmetric distribution is evident in both cases with a tail toward low transmissions due to the presence of DLA and LL systems (see I14 and II08 Fig. 7 for details). As discussed in II08, the absorption of the LyC is mainly caused by LLSs and DLAs with . This implies that LyC absorption is very stochastic because it is related to the probability of intercepting dense absorbers (e.g., LLSs). The simulations (which are based on the new absorber function by I14) used in this work consist of 10000 random lines of sight at a given redshift, in the range with , each transmission spans the wavelength (rest-frame) interval 600-1300Å with =1Å (an example of a single l.o.s. is shown Fig. 1). Redward of the transition (1216Å), the IGM transmission is assumed to be 1.0. These simulations are therefore ideal to account properly for the effect of the IGM stochasticity on color selection.
2.2 Galaxy template spectra
The ultraviolet rest-frame spectra of star-forming galaxies are well reproduced with spectral synthesis models (e.g., Ilbert et al. 2009; Heckman et al. 2011; Leitherer et al. 2014). We adopted galaxy template spectra of Bruzual & Charlot (2003)(BC03, hereafter), which are widely used in the literature and clearly describe the typical ultraviolet and ionizing emission arising from star-forming galaxies. At the level of accuracy required here, more sophisticated models of stellar evolution do not introduce significant differences in the results (e.g., Levesque et al. 2012). We must rely on theoretical models because of the lack of observed spectra of confirmed galaxy with Lyman-continuum leakage below the Lyman limit.
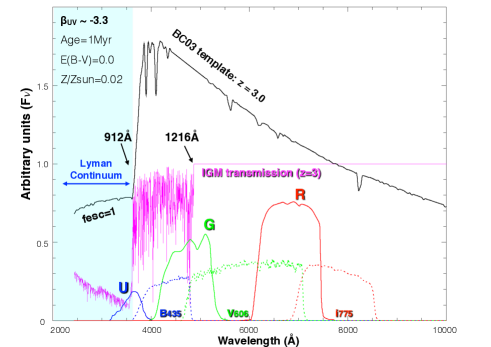
The shape and intensity of the ionizing radiation is linked to the nature of the stellar populations involved, such that for standard stellar populations the luminosity density ratio increases as wavelength decreases (Å, e.g., Inoue et al. 2005; Siana et al. 2007). An extreme case is shown in Fig. 1, in which a galaxy template placed at with zero dust extinction, E(B-V)=0, low metallicity and young, 1Myr old, is superimposed to the photometric filters used in this work. These parameters correspond to an ultraviolet slope of , which is quite extreme and very rarely observed (e.g., Vanzella et al. 2014a). The ultraviolet density ratio for this template is , extremely blue if compared with typical star-forming galaxies at the same redshift (, Siana et al. (2010)). However, we used this extreme case to maximize the effect of the ionizing emission on colors when an fesc=1 is assumed. Even more extreme ionizing emission can be realized as in the Lyman-bump scenario described by Inoue (2010). Here we limit our analysis to the standard BC models. In the same figure a random intergalactic transmission (one out of 10000 at ) is also shown (magenta solid line). In this case a relatively high IGM transparency is present down to Å rest-frame. A galaxy template with a redder and more typical UV slope () has also been adopted (E(B-V)=0, , age=1Gyr).
3 Results of the color selection
, (Steidel et al. 2003), , and (HST/ACS) colors were calculated at each redshift (, ) by convolving 10000 IGM l.o.s. with filters and BC galaxy templates. The escape fraction of ionizing radiation has been turned off or on by imposing zero signal blueward of the Lyman edge (fesc=0) or by retaining the shape of the original BC template (fesc=1). The emerging ionizing flux is consistent with the rest of the ultraviolet emission, meaning that it is not artificially added.
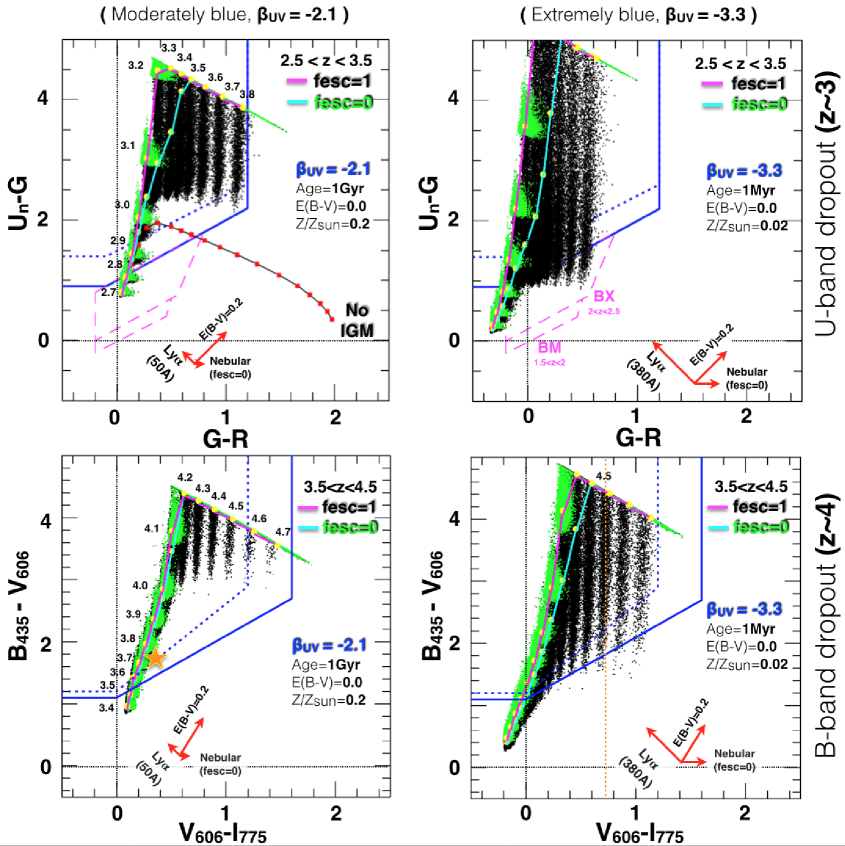
Figure 3 shows the results in the ( vs. ) and ( vs. ) color-color planes typically used to select galaxies in the redshift range (-band dropouts, Steidel et al. 2003) and (-band dropouts, Giavalisco et al. 2004). To set limits in the color diagrams, a one-sigma limiting magnitude of 30 (in all bands) was assumed and the template spectrum was normalized to . The saturation in the upper part of the color-color diagrams visible as a decreasing linear envelope is due to this assumption. In this exercise we did not include photometric scatter (but see the discussion below). While the dust absorbs the UV radiation, both metallicity and age anticorrelate with the production of ionizing radiation, such that the younger the stellar population and/or the lower the metallicity, the higher the production of ionizing photons (e.g., Nakajima & Ouchi 2014).
Two BC templates were adopted and are shown in Fig. 3: the extreme case already mentioned above () aimed to maximize the effect of LyC on colors, and another more typical case (even though it is still relatively blue, ). We indicate in the same figure with an arrow (direction and magnitude) the effect that would have on colors by monotonically extrapolating the law of Calzetti et al. (2000) (see also, Siana et al., 2007). The green and black points shown in Fig. 3 were calculated adopting fesc=0 and 1, and are named green clouds or black stripes in the following.
[fesc=0]: Each green cloud shown in Fig. 3 is made of 10000 points (that is, 10000 l.o.s.), and their behavior represents the color regions with fesc=0 at various redshifts. The redshift intervals explored in the and diagrams are and (with ), respectively. With increasing redshift, the Lyman edge and the null flux at Å enters the -band, producing a rapid drop (-band in the case). The spread in the horizontal and vertical directions reflects the IGM scatter in the non -ionizing domain, Å. In the horizontal axis it only affects the G-band (V-band in the case), while in the vertical axis both and bands are affected. This scatter is in line with that observed in QSOs studies (e.g., Faucher-Giguère et al. 2008; Rollinde et al. 2013; I14). Focusing on the plane, the clear () color cut in the bottom envelope of the green clouds is therefore due to a sharp break at 912Å (fesc=0), and the scatter in the (G-R) reflects the scatter of the IGM at (Å). The barycenters of the green clouds (connected with the magenta line in Fig. 3) resemble the typical color tracks reported in the literature, according to the adopted galaxy template and dust attenuation.
[fesc=1]: More relevant in this work is the case with fesc=1. The stochasticity of the IGM transmission in the LyC region and its effects on colors is appreciable. For example, the tail of transmissions toward high values (transparent l.o.s.) is clearly visible in the diagram as a percolation of points toward relatively blue () values (vertical black stripes). This is more evident in the extreme case (), in which the ionizing emission is maximized in the set of models we used. We note that the median color tracks for fesc=0/1 can differ in the color in the plane by a negligible quantity up to one magnitude in the case. It is even higher for the most extreme template () because the ionizing flux is higher. This difference decreases as redshift increases (because of the decreasing mean free path of ionizing photons with redshift), as shown in the plane (see Fig. 3). However, and most importantly, the escaping ionizing radiation does not significantly move the points outside the selection regions. In particular in the case, there are no solutions outside the selection region as a result of the ionizing emission. The solutions escaping the region in the low-redshift tail, ( in the BVI case) are due to the intrinsic blue slope, regardless of fesc. In the more extreme case, , only a marginal fraction leaves the selection box () at , a redshift range that is also covered by the other higher-z color selection, however. In the and diagrams the fraction is always in the BC template. However, the selection boxes were designed to capture star-forming galaxies with typical properties, therefore it is not surprising that the case does not exactly match the redshift range, especially the lower redshift edge of the selection volume. We recall that the two templates adopted here are dust-free and tend to maximize the contribution of ionizing emission to the colors.
The effect of an escaping ionizing radiation (fesc=1) decreases as redshift increases, mirroring the redshift evolution of the mean free path of ionizing photons. For this reason, the same black stripes in the plane (redshift ) are less prominent than in the lower z plane. If the m.f.p. and its redshift evolution are neglected from the calculation, the dropout signature is strongly attenuated and color tracks escape from the selection region (see next section).
A second-order effect of fesc=1 is a small bending of the stripes in the case of high IGM transmissions if the Lyman edge affects both colors in the given color-color diagram ( or ). An example is indicated with a vertical orange dashed line (Fig. 3, bottom right panel) superimposed to the black stripe at . A bending in the bottom envelope of the stripe at () and () is appreciable. This is because the LyC also boosts the -band, producing slightly bluer values (). However, this is a second-order effect that can be easily erased by photometric noise.
3.1 Marginal effect of the escaping LyC on the broad-band color selection
As shown above, the effect of an escaping ionizing radiation on the color selection is minimal. Conversely, Cooke et al. (2014) found a significant contribution and calculated color tracks that lie outside the selection regions when the escaping ionizing radiation is present. They performed spectrophotometry on composite spectra based on LBGs (e.g., Shapley et al. 2003) and applied various levels of escaping ionizing flux down to a , and assuming various ratios. Two models have been adopted: 1) the case in which is not specified (called flat-model) and 2) the case in which Å rest-frame (called step-model). While the adopted non-ionizing spectrum is (by construction) close to the average of the observed population, the assumptions on the Lyman continuum are too simplistic and lead to unrealistic color tracks, especially in the flat-model. The flat-model neglects the m.f.p. and its redshift evolution, therefore the dropout signature is significantly reduced. The color tracks plotted over the plane in Cooke et al. (2014) (see, e.g., their Fig. 3 and 4) show colors outside the selection region, reaching the extreme case at in which the is close to zero, that is, with increasing redshift, the LyC enters the -band and still survives in the band. At the -band probes Å rest-frame, while the m.f.p. at this redshift is 22Mpc (Worseck et al. 2014), and corresponds to 880Å rest-frame, that is, on average, an ionizing photon survives on a much shorter path than is allowed in the flat-model. The top-left panel of Fig. 3 shows the color track of the BC template with , fesc=1 and assuming 100% IGM transmission blueward of the Lyman edge (Å, solid black line and red squares). The behavior of the flat-model is well reproduced (upturned shape) with the dropout in the -band that never occurs up to (as in Cooke et al.). As discussed above, neglecting the m.f.p. of ionizing radiation in the intergalactic medium leads to a strong attenuation of the observed drop. The comparison between the cyan and red tracks in the same figure shows the strong effect that is achieved when the IGM is neglected in the ionizing domain. The step-model is more realistic than the flat-model and produces color tracks typical of what has been reported in literature (e.g., Steidel et al.), although, again, it does not include the redshift evolution of the m.f.p. of ionizing photons. The m.f.p. at is Mpc proper (Fumagalli et al. 2013; Worseck et al. 2014), which corresponds to Å rest-frame. Therefore the assumption of Å is valid only for a narrow redshift range around and tends to underestimate the growth-rate of the color with increasing redshift ().
We here properly treat the aforementioned limitations, that is, the shape of the LyC flux (modeled with galaxy BC-templates) and the m.f.p. of ionizing photons (statistically described by the I08,I14 prescription) are both included in the MC simulations. Our results show that there is no significant effect of ionizing leakage on the broad-band color selection. However, as discussed in Sect. 4, a leakage of ionizing radiation is in principle identifiable under suitable conditions.
Another effect that can decrease the photometric breaks or change the UV slope in galaxies and move points toward the outer part of the selection regions is the (photometric) contamination by lower redshift superimposed sources, which is not negligible in the case of deep and/or low spatial resolution surveys (e.g., see Vanzella et al. (2010a) for a statistical analysis). Taken as a whole, it is worth noting that this type of contamination is different from the effect produced by a pure escaping ionizing radiation. The latter is modulated by the redshift evolution of the IGM opacity (m.f.p.) and therefore limited in its global contribution to the band. Conversely, the contribution of a lower redshift source mimicking the LyC emission typically affects the entire band(s) blueward of the Lyman edge, which significantly reduces the observed drop or causes the background higher-z galaxy to not drop at all, similarly to what was calculated in the flat-model of Cooke et al.
3.2 Photometric noise, nebular continuum, and emission lines
The effect of photometric noise on color selections has been extensively explored in the literature (e.g., Dahlen et al. 2010; Duncan et al. 2014). The photometric scatter depends on the signal-to-noise ratio (S/N) in the bands, which in turn is related to the depth of the survey and/or to the magnitude of the sources. In the present case - at fixed conditions - the fesc=0 produces fainter -band (or -band) magnitudes than the fesc=1 (by definition), therefore we expect that the fesc=1 case is slightly less scattered than the fesc=0. It is beyond the scope of the present work to address this question or replicate the analysis performed, for instance, by Duncan et al. (2014). We only recall that depending on the adopted depth of the survey and magnitude of the sources, the photometric scatter can move points outside the selection boxes, and vice versa. Duncan et al. (2014) found that most of the cases that escape the selection regions are photometric limits, meaning that they are compatible with the high-z locus in the color space (with virtually infinite photometric accuracy, they would be included in the high-z regions). Clearly, the high-z selection is futile above a certain level of noise.
The line in emission can also affect the observed colors. Since the contribution to the broad-band is proportional to the observed equivalent width of the line, this effect is more significant with increasing redshift. Given the redshift interval explored here (), the contribution of the emission is relatively small and anyway favors the color-color selection criteria, that is, it tends to move points toward the selection region. For the color plane the line always lies in the -band and therefore any emission moves points to the upper left part of the diagram. As an example, the equivalent width of 65Å rest-frame (corresponding to the highest theoretically expected value in the case adopted here and assuming case B recombination) introduces a differential magnitude in the () and () colors, in the redder and bluer directions, respectively (the effect is shown as a vector in Fig. 3). The same occurs for . Clearly, if the line enters the -band (or -band in the case), the effect is the opposite: the line decreases the observed break. However, this is not the case here. In the extreme case adopted here (with ), the effect of a line with rest-frame equivalent width of 375Å is more significant, as expected. The nebular continuum can also redden the UV slope (e.g., Castellano et al. 2014). It is maximized in the fesc=0 case, in which the ionizing radiation concurs to boost flux in the non-ionizing UV range (Schaerer 2002; Inoue et al. 2011b). In the moderate case (), the nebular continuum effect is negligible, producing a , while in the case a is obtained, clearly in line with the extreme physical conditions (the effect on colors is reported with an arrow in Fig. 3).
4 Photometric selection of LyC candidates
Ionizing sources have been searched for by directly examining the Lyman continuum emission at with deep spectroscopy (Steidel et al. 2001; Giallongo et al. 2002; Shapley et al. 2006), narrow-band imaging (e.g., Iwata et al. 2009; Nestor et al. 2013; Mostardi et al. 2013), and deep intermediate and broad-band imaging (e.g., Fernández-Soto et al. 2003; Siana et al. 2007, 2010; Vanzella et al. 2010b, 2012; Boutsia et al. 2011; Grazian et al. 2015). Deep slitless spectroscopy has also provided deep limits at (Bridge et al., 2010).
As discussed in the previous section, the leakage of stellar ionizing radiation (fesc=1) convolved with the IGM does not compromise the color selection of high-z galaxies. Despite this, a statistically significant sample of LyC emitters (fesc¿0) at high redshift is still lacking (e.g., see Vanzella et al. 2012). One reason could be that a significant number of ionizing sources exist only in a much fainter and still unexplored luminosity domain (e.g., Wise et al. 2014; Kimm & Cen 2014), while relatively bright () ionizing sources are rare. The contribution to the ionizing background therefore could be negligible if we focus on the bright part of the luminosity function, but identifying them is still interesting since the physical mechanisms that allow ionizing photons to escape are not fully understood and are probably linked to efficient feedback processes (e.g., AGN).
In the following we describe a method for identifying LyC candidates and apply this to a sample of spectroscopically confirmed galaxies in the GOODS-S field. We defer a systematic study on a larger spectroscopic redshift sample to a forthcoming work.
4.1 Searching for anomalous UV colors as a signature of an escaping ionizing radiation
As shown above, an optimal characterization of the stochasticity of the IGM and a suitable modeling of the ultraviolet emission of star-forming galaxies allows us to investigate the photometric contribution of an escaping LyC radiation in more detail. In particular, if the photometric accuracy is high enough, it is possible to explore the position of the source in the color-color plane, focusing on the color(s) encompassing the Lyman edge, and determine whether it significantly departs from the fesc=0 assumption.
To this aim, we built a set of templates for which we adopted different values of the ages, metallicities, and dust attenuation. Here the dust attenuation is inserted because we compare simulated with observed colors (discussed in the next sections). The following grid was adopted: =1,0.2, and 0.02; E(B-V)=0.0,0.03,0.06,0.1,0.2,0.3,0.4,0.5, and 0.6; age=1Myr up to 2Gyr with steps of 0.05 in logarithmic scale. Both constant and exponentially declining (with ) star formation histories were assumed. The Salpeter initial mass function and Calzetti attenuation law extrapolated down to the LyC were adopted (e.g., Siana et al. 2007). The final sample uniformly covers the age, metallicity, and dust attenuation parameter space.
The basic idea is the following. Given a galaxy with known spectroscopic redshift (zspec)111We have shown that the photometric selection does not preclude the inclusion of LyC emitters., the UV spectral slope () with its one-sigma uncertainty () is measured by computing a multi-band fitting as described in Castellano et al. (2012). The uncertainty on the estimated slope, , contains the photometric uncertainties. The same procedure is performed on BC-templates to derive the UV slope () at the same redshift and using the same bands. Subsequently, a subsample of galaxy templates with compatible with the observed one is selected such that . To be conservative, we furthermore select in this sample the template that maximizes the ionizing output, by measuring the flux density ratio. This also means that we select the template that maximizes the contribution of the non-ionizing ultraviolet emission redward of the Lyman edge (e.g., Å). This part still affects the band even if fesc=0. In this way, we build a galaxy template anchored to the observed UV slope and with the highest possible (modeled) ultraviolet emission. Then we convolve this template with 10000 IGM transmissions at the closest available redshift in the IGM redshift grid, (always ) and derive magnitudes and colors, turning the escape fraction on and off, and normalizing the template to the observed magnitude. In particular, we focus on the realization that assume fesc=0 and compare them with the observed photometry, with the aim to identify a possible excess of the flux in the ionizing domain.
The hypothesis is that we have no direct coverage just blueward of the Lyman edge (912Å), therefore we have no direct probe of the LyC region, as is the case in general for non -dedicated surveys. We wish to infer a signature of the ionizing radiation by focusing on the band in which the LyC is partly covered. While dedicated surveys based on narrow-band imaging and deep spectroscopy are more efficient in capturing the possible escaping ionizing flux just blueward of the Lyman limit (although they are time-consuming and/or limited to narrow redshift intervals), the method described here complements them and allows us to explore possible LyC leakage in a continuous redshift range, exploiting existing deep multifrequency surveys. The mean free path of ionizing photons is Mpc physical at redshift 3 (Fumagalli et al. 2013; Worseck et al. 2014), which corresponds to 80Å rest-frame blueward of the Lyman edge at the same redshift, that is, 320Å in the observed-frame. If compared to the typical width of broad-band filters, this is not negligible (but not dramatic for the high-z selection functions, Sect. 3).
For example, the ()-band starts to include the LyC domain at () and at () half of the ()-band probes ionizing radiation. The distributions of the simulated colors and magnitudes derived assuming fesc=0 and containing the Lyman edge (Å) are then compared with the observations. In the case in which the -band contains the Lyman limit, the probability that at the given observed color , UV slope and spectroscopic redshift (with their uncertainties) is associated with an fesc=0 (P(fesc=0)) is calculated as follows:
| (1) |
where and is the number of realizations with fesc=0 that reproduces the observed color, that is, , calculated adopting the BC galaxy template with the strongest LyC emission of those that are compatible with the observed ultraviolet slope (). Therefore, given the observed quantities (color, redshift, and UV slope), a proper treatment of the IGM transmission (I14) and UV emission (BC-models), the probability of a null fesc can be estimated from MC simulations. In particular, the LyC candidates are those with the lower conditional probability P(fesc=0).
We applied this procedure to a sample of galaxies in the GOODS-S field with known spectroscopic redshift (Vanzella et al. 2008, 2009; Balestra et al. 2010). In this first test-run we focused on the redshift interval. The lower redshift limit was chosen such that more than half of the (ground-based) -band probes the LyC. 222Bluer bands like the ultraviolet channels provided by the HST/WFC3, e.g., F225W, F275W, and F336W, will allow us to investigate lower redshift regimes. The upper limit is mainly given by the short mean free path of ionizing photons at high redshift, (m.f.p. Mpc proper), which makes the contribution to broad-band filters negligible on average. For each source the P(fesc=0) was calculated using the () and (B-V) colors as described above. At the Lyman limit moves redward of the red edge of the -band filter, which means that the -band is a direct probe of the LyC. These cases have previously been explored in detail in Vanzella et al. (2010b), where only one convincing LyC emitter (out of 102 LBGs) was identified and named Ion1 (see below). Several other -band detections at have been identified in the same GOODS-S field, but a careful investigation that exploited the optical and near-infrared high spatial resolution imaging (GOODS+CANDELS) has revealed a probable contamination by foreground sources that mimics the LyC (each of them analyzed in Vanzella et al. 2012). The fraction of contaminants is also compatible with that expected from statistical arguments (see Vanzella et al. 2010a).
In this application we furthermore selected sources with a in all the ultraviolet bands and with secure spectroscopic redshift measurements. We obtained a sample of 32 galaxies in the range , magnitude and ultraviolet colors redward of the typical of LBG populations (e.g., Vanzella et al. 2009). The probabilities we derived (P(fesc=0)) range between 0 and 100%, with some cases of foreground contamination (discussed in Vanzella et al. 2012) and known X-ray detected AGNs. In the following we focus on the sources with the lowest probability P(fesc=0) that are isolated, that is, those without evident contamination from nearby lower z objects, deferring a systematic application on a larger spectroscopic sample and a detailed comparison of LyC emitter candidates and non-candidates to a future work. Here we aim to demonstrate the feasibility of the method. In this way, two out of 32 sources show P(fesc=0): one is the already known Ion1 source at (see next section and Vanzella et al. 2012), the other is a new intriguing candidate ionizer (see Sect. 4.3). These two objects are investigated in more detail in the following.
4.2 LyC emitter: Ion1
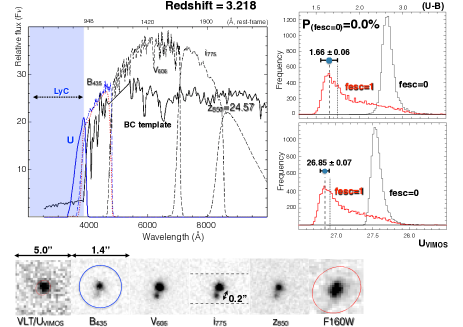
The procedure described above recovers Ion1 as a LyC emitter candidate (CANDELS ID 23836, Guo et al. 2013), even excluding the direct information we have about the LyC detection (i.e., the -band detection333Here the -band refers to the VIMOS -band, Nonino et al. (2009), which is an intermediate-band filter, FWHM=350Å (see also Vanzella et al. 2010b). at Å rest-frame, Fig. 4).
We recall that, currently, the global spectral energy distribution of this source is compatible with a star-forming galaxy: there is no X-ray detection in the 4Ms Chandra observations, and no emission lines (e.g., , NV, CIV) have been measured in the spectrum (Vanzella et al. 2010b, 2012). It is a compact source, but is marginally resolved in the ACS images ( rest-frame) with a pc (see Sect. 4.6).
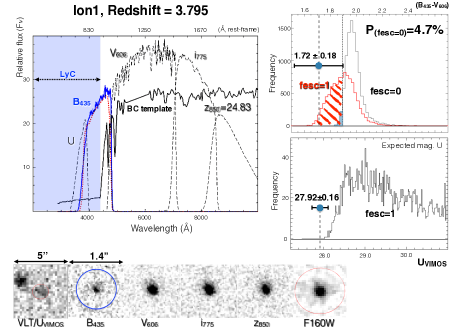
At the redshift of Ion1 more than half of the band probes the ionizing part of the spectrum (Å) (see top-left panel of Fig. 4). The UV slope measured with the five-band fitting procedure gives . The observed color is with an error the -band magnitude is . We derived the probability P(fesc=0) by calculating the expected color including the I14 IGM prescription and adopting the galaxy (BC) model anchored to the observed UV slope, as discussed in the previous section. The distribution of the expected color for the Ion1 source is shown in Fig. 4 and is compared to the observed color. Interestingly, although this source was selected as a -band dropout (indicated with a star in Fig. 3, bottom-left panel), the observed color is reproduced only marginally if fesc=0, that is, P(fesc=0) (shaded region of the fesc=0 histogram shown in Fig. 4, upper right panel). With such a low probability it is selected as a LyC emitter candidate. Conversely, the color is better reproduced with the distribution that assumes fesc=1 (see the red curve in the same figure). We recall that the adopted template is the most ionizing while reproducing the observed UV slope. If we run the same procedure on all the templates that satisfy the condition (239 BC templates) regardless of any constraint on the ionizing emission, color estimates () are derived. In this case, P(fesc=0) is 0.4%.
A similar analysis can be performed on the observed magnitudes that probe the LyC domain. As described above, the galaxy template was normalized to the observed . While the expected magnitude in the -band better matches the fesc=1 distribution (although its error still prevents us from clearly distinguishing between fesc=1/0), the observed -band magnitude of - that probes the Å rest-frame - is more difficult to reproduce fesc=1 and given the observed UV slope, even in the more transparent IGM l.o.s. and fesc=1, see Fig. 4 (the case with fesc=0 produces zero flux in the -band by definition). The measured -band flux can be better explained with bluer and more ionizing BC templates (e.g., ), which contradict the observed , however. This could suggest a non-stellar radiation that progressively dominates at shorter wavelengths (especially in the ionizing domain). In particular, if we adopt a simple underlying power-law template without any break at the Lyman edge (AGN-like), with , we obtain even bluer () colors and brighter -band magnitudes than observed. Obviously, pumping flux into the ionizing regime allows us to recover the -band magnitude as well. We recall that this object is currently not detected in X-ray (the 4Ms Chandra observations provide a limit of ) or in the Spitzer/MIPS observations (Vanzella et al., 2012), and it is spatially resolved in the HST/ACS images (see Sect. 4.6). A possibility is that a mix of stellar and (faint) AGN emission contributes to the ultraviolet spectrum. More in general, it could be that relatively bright ionizing sources host a faint AGN that favors the escaping ionizing radiation by decreasing the column density of neutral hydrogen gas along the line of sight, causing fesc to be higher than zero, as in the Ion1 case (i.e., ). This would imply that faint AGNs can still provide the necessary feedback to increase the transparency toward certain view angles (e.g., Giallongo et al. 2012). The ionizing photons produced by young stars in the compact central region (revealed in the UV at Å as spatially resolved emission, see Sect. 4.6) could share a similar (or the same) physical path of non-stellar ionizing emission (AGN) and escape from the interstellar and the circum-galactic media. In this scenario, the final escaping ionizing radiation would have a stellar and non-stellar origin, with a certain balance among the two, possibly depending on the feedback mechanisms performing differently at different luminosity and mass regimes.
Deeper data with HST/WFC3 UV channels would be needed to examine the spatial distribution of the ionizing radiation (as a probe of a stellar ionizing emission), and/or deeper spectroscopic observations would be necessary to study the covering fraction of neutral gas through absorption line analysis (e.g., Heckman et al. 2011; Borthakur et al. 2014).
4.3 LyC candidate: Ion2
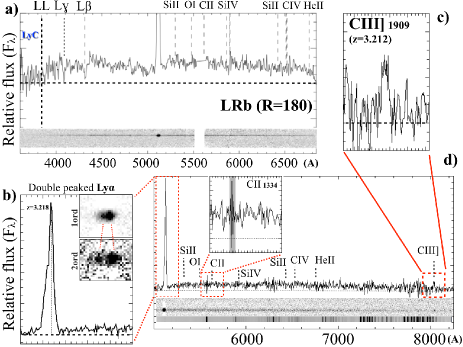
Another source at (CANDELS ID 18320, Guo et al. 2013) with a significant excess in the ultraviolet spectrum has been identified in the same field with a -band magnitude and color ()=.444The -band data used here come from the ultradeep VIMOS observation of GOODS-S, Nonino et al. in preparation. At this redshift the -band probes the wavelength range Å rest-frame, and any significant signal suggests a LyC leakage. From the observed () color and following the methodology described above, we derive P(fesc=0)=0.0% (Fig. 5), which confirms that this source is a LyC candidate (named here Ion2). This result also supports the non-zero emitting flux blueward of the Lyman limit that was tentatively detected in the VIMOS low-resolution spectrum, (see Fig. 6), but with a low (Balestra et al., 2010).
By examining the morphology of the system in more detail, two distinct objects are visible at a separation of in the HST/ACS imaging (corresponding to a physical separation of 1.5kpc if they are at the same redshift, Fig. 5), both of them showing a drop blueward of the -band.
In the following, we refer with a) to the brighter and with b) to the fainter component. They have been detected as a single object both in the optical ACS catalog v2.0 (Giavalisco et al. 2004 and see Vanzella et al. 2009) and in the near-infrared CANDELS catalog (Guo et al., 2013). They are not detected in the X-ray 4Ms Chandra observations, corresponding to limit of . That these are two sources further complicates the interpretation. In the following sections we investigate the nature of the system in more detail.
4.4 Photometric and spectroscopic confirmation of LyC candidates
4.4.1 LyC emission
Another useful feature is detected in the medium-resolution spectrum obtained with VIMOS () that was published in Balestra et al. (2010). The line shows a clear and atypical asymmetric blue tail, at variance with the typically opposite shape toward red wavelengths (Shapley et al. 2003; Verhamme et al. 2008; Vanzella et al. 2009). We performed a dedicated reduction of the VIMOS quadrant containing Ion2 following the reduction prescription described in Vanzella et al. (2014b). The two-dimensional spectrum is shown in Fig. 6 (panel d), in which the C iii] emission line at is clearly identified (S/N=8), and the was detected at the first and second order (the latter with a double spectral resolution, ). In particular, the second-order detection shows a clear double-peaked emission with (see Fig. 6, inset of panel b). There are at least two possible explanations for the two lines in emission around the position: (1) the two sources identified in the ACS images are at a very similar redshift and both with in emission and detected in the MR spectrum; (2) one of them has an intrinsic double-peaked line in emission (as observed, e.g., in Karman et al. 2014; Kulas et al. 2012). It is worth noting that and lines have been clearly detected in absorption in the LRb spectrum; these detections are possible only for the brighter of the two components. The fainter component has an estimated magnitude at the wavelength interval encompassing the and absorption lines (i.e., -band) of , which is too faint to allow a detection of the continuum in the VIMOS LR spectrum with only four hours of integration time (expected to have , running the ESO/Exposure Time Calculator)555http://www.eso.org/observing/etc/, and therefore the detection of any absorption line is prohibitive, too. This implies that they are associated with the brighter component (at ), that is, two magnitudes brighter in the -band. The uncertainty remains whether the (fainter) source (b) is at the same redshift as the main object or not. If it is at a very similar redshift, then it would be interesting to also investigate its ionizing emission. Conversely, a lower redshift source would be less interesting and could contribute to the observed -band magnitude (but not to the LR spectrum, being too faint). The HST/ACS resolution allows us to perform dedicated photometry of both components, in particular, components a) and b) were subtracted from each ACS band (see Sect. 4.6), and the photometry was properly derived by running SExtractor. The two components show very similar photometric behaviors; we derive the following ACS magnitudes for the (brighter) source a): , , , and and for the fainter source b): , , , and . Source b) also shows a clear drop in the -band, appreciable in Fig. 5. If interpreted as due to the IGM decrement, it would be compatible with the redshift and the decrement also observed in the a) companion (). The () colors of the two components are practically the same, for a) and for b), while the drop is slightly larger for the fainter one, supporting its high-z nature. The other possible interpretation for the drop is the Balmer break at . However, at this redshift and given the spectral coverage in the range Å, typical features such as the [O ii], [O iii], and would be easily detectable in the spectra if it were an emission line object. Regardless of the redshift of the fainter component, the estimated -band magnitude of for the system cannot be explained by the b) source alone, even assuming that the b) component maintains the same magnitude in the -band as well.
The two distinct and close objects, the two lines in emission, and the drop blueward of the -band in both objects support the interpretation that the two sources are at very similar redshift with a velocity difference of , with the two lines resolved in the spectrum (they are not spatially resolved with the given slit orientation). Under this assumption, the system remains a convincing LyC candidate, with P(fesc=0)=0.
4.4.2 Low gas-covering fraction ?
Heckman et al. (2011) suggested a link between the low-ionization [C ii] (and [Si ii]) absorption line and the transparency of the interstellar medium to ionizing photons, such that a non-zero residual flux in the [C ii] line is a necessary condition to have a low optical depth at the Lyman edge (see also Jaskot & Oey 2014). Borthakur et al. (2014) found similar features in a local Lyman-break analog with Lyman-continuum leakage. In the present case, the absence of the low-ionization absorption lines of silicon and carbon (see Fig. 6), especially the faintness of the multiple atomic transitions (i.e., the evident non-zero residual flux) of silicon [Si ii] and [C ii] suggests a low covering fraction of neutral gas (see Jones et al. 2013). The available spectral resolution prevents us from performing a more quantitative study, but the absence of these lines supports a possible high transmission along the line of sight, consistent with the potentially high escaping ionizing radiation we inferred indirectly from the MC analysis.
As concluded in the previous section, it is plausible that the two components are at the same redshift, both with in emission. Another piece of information comes from the semi-forbidden doublet (here unresolved) nebular C iii]. In particular, the and the redshift of the bluer peak of the structure, , are fully compatible within an uncertainty of , while the red peak is redshifted by about (). If we adopt the C iii] transition as a proxy of the systemic redshift, then the emerging photons at the systemic redshift could further support a scenario of a low neutral gas column density that would be consistent with the possible ionizing leakage (the resonant scattering is reduced and the photons escape not far from the resonance frequency, close to the systemic velocity, see Verhamme et al. 2014; Schaerer et al. 2011). If this is the case, the escaping ionizing and photons could share a similar (or have the same) physical path through the cavities in the interstellar medium (Behrens et al. 2014).
4.5 Signature of variability: faint AGN component ?
The ACS/ and VLT/VIMOS -band observations have been obtained in two epochs, in 2002 and 2010, respectively. The two filters encompass a very similar wavelength intervals with a small difference in their shape (see Figs. 4 and 5). We quantified the magnitude difference (-) to be in the range (and average ) by convolving the two filters with a large control sample made of BC galaxy templates. The difference of the observed magnitudes =() at the two epochs (corrected for the average offset) and the uncertainty can be computed. The quantity BVAR=ABS() provides an estimate of the significance of the time variation between the two epochs (e.g., Villforth et al. 2010). The rest-frame interval of time probed at redshift 3 is two years. As a sanity check, we calculated this quantity for the known AGNs in the GOODS-S field (Szokoly et al. 2004; Xue et al. 2011), and for several of them the BVAR ranges between , meaning that the variation is evident and significant at more than six sigma (as expected for AGNs, especially in the ultraviolet, e.g., Cristiani et al. 1997). This will be explored in a forthcoming work on the full photometric sample in the GOODS-S field. Here we limit our analysis to the two examples reported above. The derived BVAR for Ion1 and Ion2 is 1.3 and 3.0, respectively (corresponding to a magnitude difference and ). The two sources are isolated and not subject to photometric contamination from other nearby objects. While for Ion1 there is no significant evidence for variability, in the case of Ion2 it is significant at a level. Since the variability is a sufficient condition to confirm nuclear activity, its detection in the case of Ion2 suggests that an AGN component is highly likely. We recall that the two sources are currently not identified with deep 4Ms X-ray observations (Xue et al., 2011), corresponding to limit of for both. In addition, the typical high-ionization spectral features of nuclear activity (e.g., N V , C iv ) are absent as well. However, in a fainter luminosity domain the situation could be different. Silverman et al. (2010) have found X-ray selected AGNs at with optical spectra fully compatible with those of typical star-forming galaxies, that is, without high ionization emission lines and/or without any line in emission (see also Civano et al. 2011). Without the X-ray imaging the AGN component in these systems would not have been identified. The UV slopes of these sources is also compatible with the UV slope observed here. Vanzella et al. (2010b) also reported on two AGNs at and (Balestra et al., 2010) with ionizing radiation directly detected in the -band ultradeep VIMOS observations, both showing a blue color . The two sources Ion1 and Ion2 are magnitude fainter, not detectable in the deep X-ray observations, and may represent a regime in which the stellar and non-stellar ultraviolet emissions are similar.
4.6 Spatially resolved emission
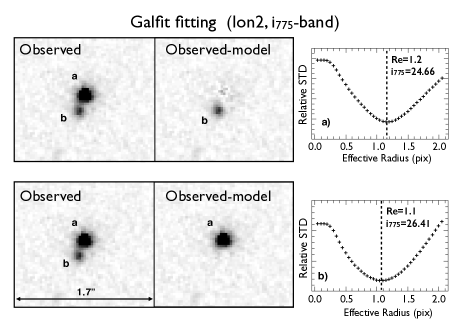
High spatial resolution ACS imaging has been fitted with GALFIT (Peng et al., 2010) to extract the basic PSF-corrected morphological parameters. The assumed PSF in the HST images has been derived empirically from observed stars close to the targets.
First, we note that Ion1 and Ion2 (both the and components for the latter) show a compact uncomplicated shape, so a good fit is reached by adopting a simple Gaussian profile (Sérsic model with ) and leaving the effective radius Re, the axis ratio B/A, the coordinates X,Y, the magnitude, and the position angle (PA) as free parameters (very similar results are also obtained by leaving the Sérsic index as a free parameter). B/A and PA are not relevant parameters in the fit, since all components have a circular symmetry, therefore we fixed them to B/A=1 and PA=0. The coordinates of the sources and their magnitudes were fixed to the best guesses derived from SExtractor. Then GALFIT was run many times by varying the Re parameter from 0.025 to 2.0 pixels. An example is shown in Fig. 7, in which the two components of Ion2 were modeled and subtracted from the -band (Å rest-frame). The behavior of the residuals at the position of the source is shown as a function of the effective radius (right panel of Fig. 7). The minimum of the residuals for pixels is clear (1pix=), and the residuals map provided by GALFIT, as a result subtracting the best-fit model from the original galaxy, do not show significant structures (middle panels of the same figure).
We performed this exercise in all the ACS bands (Å rest-frame), both for Ion1 and Ion2. Both sources (and the two subcomponents of Ion2) are spatially resolved in the ultraviolet, with effective radii of 200 and 300 parsecs ( pc), respectively. While in the previous section we discussed the possible presence of an AGN component, especially from the variability of Ion2, the spatially resolved emission suggests that stellar UV light also contributes to the emerging spectrum. Unfortunately, high spatial resolution imaging in the ionizing domain is not available at the moment. Moreover, the compactness of the central star-forming region within a few hundred parsecs and the leakage of ionizing photons has recently been reported in a local starburst galaxy (Borthakur et al., 2014), in which a high volume density of young stars can generate intense winds able to propel the surrounding interstellar neutral and ionized gas outward at velocities in excess of (Heckman et al., 2011). The two sources discussed here could be the higher redshift counterparts and will merit future investigation of the possible presence of winds.
5 Discussion and conclusions
The rest-frame far UV colors of star-forming galaxies, which at are observed in the optical window, are powerful diagnostics of the forming stellar populations and of the ISM. They are also very useful tools for selecting the galaxies themselves by means of dedicated color-color diagrams, such as the Lyman-break technique (Giavalisco 2002), or by means of photometric redshift selection. The spectral region most often targeted for the construction of colors typically straddles the 912Å Lyman-continuum discontinuity and the resonant line at 1216Å. In general, the dispersion of the observed colors results from the contribution of a number of independent factors, which include the following:
1) the intrinsic scatter of the UV SED of galaxies. This contrbution primarily depends on the scatter of the integrated colors of massive stars and on the scatter of reddening by dust. The former term is dominated by variations of the age of the starburst and variations of the IMF, the latter by variations of the total amount of dust (which is commonly parameterized in terms of the E(B-V) color excess) and of variations of the reddening curve;
2) the scatter of the cosmic opacity, which consists of the Lyman-alpha forest and of DLAs and LLSs. Detailed analyses have been performed in this work by running MC simulations based on the prescriptions of I08 and I14;
3) the scatter of the amount of escaping ionizing radiation, which depends on the HI column density of the ISM of the source along the line of sight. There are no firm constraints on this term, but its effects on the observed color are certainly weak because the number of leaking ionizing photons is small in absolute terms compared to non-ionizing photons. Another cause is the scatter of broad–band colors constructed with passbands that sample the spectral regions to the blue and the red of the Lyman limit are much more strongly affected by small differences in the redshift of the targeted galaxies, which determine the amount of non-ionizing flux that enters the blue passband. This amount of flux is generally much larger than the potential leaking ionizing flux, and so is the corresponding contribution to the scatter of colors. Nevertheless, knowledge of the exact position of the Lyman limit (spectroscopic redshift) has allowed us to define a method for identifying the signature of a possible escaping ionizing radiation;
4) photometric scatter. This term depends on the depth of the photometry used to construct the colors, and thus on the experimental configuration. It is usually accurately measured as a function of the luminosity of the source by means of Monte Carlo simulations. It can provide a comparatively strong contribution to the scatter, especially in colors that include spectral regions where the source is faint, for instance, blueward of the Lyman limit, the Lyman-alpha forest, or both;
5) confusion scatter. This term arises from photometric contamination by nearby spurious interlopers at lower redshift than the targeted source (e.g., Vanzella et al. 2010a). It depends on the angular resolution of the images used to construct the colors, and thus on the instrumental configuration and ground-based seeing (if applicable). Even if the interloper is a very faint galaxy, the contamination can be severe in colors that include spectral regions where the source is faint, for example, blueward of the Lyman limit, the Lyman-alpha forest, or both.
We analyzed the effect of an escaping ionizing radiation on color selection criteria by running dedicated Monte Carlo simulations. On the basis of similar simulations anchored to the observations, a method of selecting LyC continuum emitter candidates from multiband photometry was also discussed and applied to a sample of galaxies.
These are the main results:
-
1.
The redshift evolution of the mean free path of ionizing photons through the intergalactic medium and a proper treatment of the ionizing continuum (galaxy template) indicate that there is no significant effect of LyC leakage on classical broad-band photometric selection techniques (e.g., or ), at variance with what has been reported by Cooke et al. (2014). The effect of an ionizing emission is more significant as the width of the band encompassing the Lyman edge decreases and approaches the expected mean free path at the given redshift (being maximized in the narrow-band surveys or deep spectroscopy, e.g., Mostardi et al. 2013; Giallongo et al. 2002; Shapley et al. 2006). Under the assumption that the IGM prescription of I14 is a good representation of the IGM structure, no significant deviation was found in the non-ionizing part of the IGM attenuation (Å) either, that is, the scatter is not larger than 0.4 mags. Overall, the median color tracks do not differ significantly if fesc = 0 or 1, even in the most extreme stellar ionizing emitters (age=1Myr, E(B-V)=0, ).
-
2.
A method for photometrically selecting LyC-emitter candidates was described and applied to a sample of 35 galaxies belonging to the GOODS-S field. Two candidate LyC emitters were identified: one known LyC emitter at was successfully recovered (Ion1). Another source with possible LyC leakage was reported (Ion2). The probability of a null escaping ionizing radiation is low () for both sources. Detailed analysis based on morphology, variability, and the ultraviolet excess suggests that a probable contribution from faint AGN activity could dominate the LyC emission and/or have played a crucial role in making the medium transparent. The spatially resolved stellar UV emission also suggest there could be a contribution by stellar radiation.
There are caveats for the method described in this work. First, the probability P(fesc=0) depends on the fraction of the band used to probe the LyC region. A large fesc could be present, for example, but might be missed because only a small fraction of the band probes it. This effect can be attenuated by including bluer overlapping bands that ensure a continuous redshift coverage (as is the case in the typical multifrequency surveys such as GOODS/CANDELS). Second, the method tends to select relatively strong LyC emitters on average (it depends on the width of the filters used and the presence of LLSs/DLAs IGM along the line of sight) because they are the most effective in the broad-band contribution. Third, the photometric accuracy is crucial in these analyses to identify the position in the color-color plane with good detail and determine . The higher the photometric S/N ratio in the relevant bands, the more accurate the identification of LyC candidates with this method. The interplay among these limitations is included in the performed MC simulations, however.
Despite these limitations, we have demonstrated that regardless of the nature of the source (AGNs, LyC-galaxy, spurious detection, etc.), this type of objects can in principle be automatically identified with this technique. The color excess in the UV coupled with morphological information has previously been used to select QSOs/AGNs (e.g., Fontanot et al. 2007; Casey et al. 2008; Salvato et al. 2009) and is conceptually similar to what we discussed here. However, the analyses performed here are based on the detailed IGM stochasticity and focused mainly on the LyC part of the spectrum.
From point (1) above it follows that the broad-band photometric selection of high-redshift galaxies does not prevent selecting galaxies with LyC leakage. Nonetheless, a clear sample of ionizing galaxies has not been identified yet. One reason could be that the stellar ionizers exist in a much fainter and still unexplored luminosity domain, while relatively bright () ionizing sources are rare and require efficient physical mechanisms to increase the transparency of the interstellar medium and favor ionizing photons to escape. The variability detected in Ion2 and the difficulty in reproducing (with galaxy templates) the observed -band magnitude of Ion1 (Å) given its observed ultraviolet slope suggest that the two sources could host a faint AGN that possibly contributes to the LyC emission. X-ray detected () AGNs with blue UV-slope and galaxy-like spectra have been reported in the literature (e.g., Civano et al. 2011, Silverman et al. 2010), and the two sources reported here could be AGNs at fainter luminosities (e.g., Maoz 2007). In other words, while the more massive systems would need an efficient feedback (possibly provided by an AGN) to clean the medium and decrease the column density of the neutral gas, the fainter and still unexplored sources could regulate the opacity of the interstellar medium with supernova feedback only if they indeed contain a large portion of the LyC emitter (Wise et al. 2014; Kimm & Cen 2014).
In addition to the possible presence of a faint AGN component, the spatially resolved emission in the ultraviolet 1000-2000Å rest-frame suggests that the stellar emission contributes in this wavelength domain. It is beyond the aim of this work to decompose the two components, we only note that the two might also coexist in the LyC domain. In particular, stellar ionizing photons could share a very similar path of the interstellar and circum galactic media of these photons arising from the nucleus, making the system a sort of hybrid-ionizer (stellar and non-stellar). In this respect, high spatial resolution imaging with HST (WFC3 UV channels) of confirmed LyC emitters would provide precious information about the spatial distribution and the relative balance of the two sources of ionizing radiation.
If there were a faint AGN component in this type of sources, it might also explain the recently observed extreme ultraviolet flux ratios between ionizing and non-ionizing wavelengths in various Lyman alpha emitters reported in the literature (e.g., ), e.g., Nestor et al. (2013), Mostardi et al. (2013). For example, Ion2 is a Lyman alpha emitter without any typical feature, which suggests that it is an AGN (from X-ray and spectral features), but its variability suggests that there is an AGN component. We therefore remark that it is important to investigate the AGN nature at faint luminosity limits in this type of studies.
Finally, convolving the stochasticity of the IGM with galaxy templates anchored to the observed UV slopes and comparing this with the observed colors proved to be an efficient automatic tool to determine the reliability of spectroscopic redshift measurements or to identify photometric contamination from lower-z sources in the UV. In these cases, an addiitonal flux in the ultraviolet is present and is therefore recovered as a possible ionizing leakage. This is particularly useful for large spectroscopic redshift surveys coupled with deep and high spatial resolution imaging, such as VUDS (Le Fevre et al. 2015) and/or the VANDELS survey (ESO public survey 666www.eso.org/sci/observing/PublicSurveys/sciencePublicSurveys.html), which cover the CANDELS fields. We defer the application to these large datasets to a forthcoming work.
Acknowledgements.
We would like to thank the anonymous referee for constructive comments and suggestions. We thank G. Becker, J. Bolton, V. D’Odorico, and S. Cristiani for useful discussions about the IGM transmission and its variance. E.V. thanks M. Brusa and R. Gilli for stimulating discussions and I. Balestra for providing useful information about the VIMOS spectroscopy of Ion2. We acknowledge the financial contribution from the PRIN-INAF 2012. AKI is supported by JSPS KAKENHI Grant Number 26287034.References
- Amorin et al. (2011) Amorín, R., Pérez-Montero, E., Contini, T., Vílchez, J. M., Bolzonella, M., Tasca, L. A. M., Lamareille, F., Zamorani, G., et al., 2014, (arXiv-1403.3441)
- Balestra et al. (2010) Balestra, I., Mainieri, V., Popesso, P., Dickinson, M., Nonino, M., Rosati, P., Teimoorinia, H., Vanzella, E., Cristiani, S., et. al., 2010, A&A, 512, 12
- Becker et al. (2013) Becker, G. D., Hewett, P. C., Worseck, G., Prochaska, J. X., 2013, MNRAS, 436, 1023
- Behrens et al. (2014) Behrens, C., Dijkstra, M., Niemeyer, J. C., A&A, 563, 77
- Borthakur et al. (2014) Borthakur, S., Heckman, T. M., Leitherer, C., Overzier, R. A., 2014, Science, 346, 216
- Boutsia et al. (2011) Boutsia, K., Grazian, A., Giallongo, E., Fontana, A., Pentericci, L., Castellano, M., Zamorani, G., Mignoli, M., Vanzella, E., et al., 2011, ApJ, 736, 41
- Bouwens et al. (2014) Bouwens, R. J., Illingworth, G. D., Oesch, P. A., Trenti, M., Labbé, I., Bradley, L., Carollo, M., van Dokkum, P. G., Gonzalez, V., Holwerda, B., Franx, M., Spitler, L., Smit, R., Magee, D., 2014, (arXiv-1403.4295)
- Bridge et al. (2010) Bridge, C. R., Teplitz, H. I., Siana, B., Scarlata, C., Conselice, C. J., Ferguson, H. C., Brown, T. M., Salvato, M., et al., 2010, ApJ, 720, 465
- Bruzual & Charlot (2003) Bruzual, G., & Charlot, S. 2003, MNRAS, 344, 1000
- Bunker et al. (2004) Bunker, A. J., Stanway, E. R., Ellis, R. S., McMahon, R. G., 2004, MNRAS, 355, 374
- de Barros et al. (2014) de Barros, S., Schaerer, D., & Stark, D. P. 2014, A&A, 563, A81
- Calzetti et al. (2000) Calzetti, D., Armus, L., Bohlin, R. C., Kinney, A. L., Koornneef, J., Storchi-Bergmann, T., 2000, ApJ, 533, 682
- Capak et al (2011) Capak, P., Mobasher, B., Scoville, N. Z., McCracken, H., Ilbert, O., Salvato, M., Menéndez-Delmestre, K.; Aussel, H., Carilli, C., Civano, F., et al., 2011, ApJ, 730, 68
- Casey et al. (2008) Casey, C. M., Impey, C. D., Trump, J. R., Gabor, J., Abraham, R. G., Capak, P., Scoville, N. Z., Brusa, M., Schinnerer, E., 2008, ApJ, 177, 131
- Castellano et al. (2010) Castellano, M., Fontana, A., Boutsia, K., Grazian, A., Pentericci, L., Bouwens, R., Dickinson, M., Giavalisco, M., et al., 2010, A&A, 511, 20
- Castellano et al. (2012) Castellano, M., Fontana, A., Grazian, A., Pentericci, L., Santini, P., Koekemoer, A., Cristiani, S., Galametz, A., Gallerani, S., et al., 2012, A&A, 540, 39
- Castellano et al. (2014) Castellano, M., Sommariva, V., Fontana, A., Pentericci, L., Santini, P., Grazian, A., Amorin, R., Donley, J. L., Dunlop, J. S., Ferguson, H. C., et al., 2014, A&A, 566, 19
- Civano et al. (2011) Civano, F., Brusa, M., Comastri, A., Elvis, M., Salvato, M., Zamorani, G., Capak, P., Fiore, F., Gilli, R., et al., 2011, ApJ, 741, 91
- Cooke et al. (2014) Cooke, J., Ryan-Weber, E. V., Garel, T., Díaz, C. G., 2014, MNRAS, 441, 837
- Cristiani et al. (1997) Cristiani, S., Trentini, S., La Franca, F., Andreani, P., 1997, A&A, 321, 123
- Dahlen et al. (2010) Dahlen, T., Mobasher, B., Dickinson, M., Ferguson, H. C., Giavalisco, M., Grogin, N. A., Guo, Y.,
- Duncan et al. (2014) Duncan, K., Conselice, C. J., Mortlock, A., Hartley, W. G., Guo, Y., Ferguson, H. C., Davé, R., Lu, Y., Ownsworth, J., Ashby, M. L. N., Dekel, A., et al., 2014, MNRAS, 444, 2960
- Faucher-Giguère et al. (2008) Faucher-Giguère, C.-A., Prochaska, J. X., Lidz, A., Hernquist, L., Zaldarriaga, M., 2008, ApJ, 681, 831
- Fernández-Soto et al. (2003) Fernández-Soto, A., Lanzetta, K. M., Chen, H.-W., 2003, MNRAS, 342, 1215
- Finkelstein et al. (2012) Finkelstein, S. L.; Papovich, C., Salmon, B., Finlator, K., Dickinson, M., Ferguson, H. C., et al., 2012, ApJ, 756, 164
- Fontanot et al. (2007) Fontanot, F., Cristiani, S., Monaco, P., Nonino, M., Vanzella, E., Brandt, W. N., Grazian, A., Mao, J., 2007, A&A, 461, 39
- Fumagalli et al. (2013) Fumagalli, M., O’Meara, J. M., Prochaska, J. X., Worseck, G., 2013, ApJ, 775, 78
- Giallongo et al. (2002) Giallongo, E., Cristiani, S., D’Odorico, S., Fontana, A., 2002, ApJ, 568, 9
- Giallongo et al. (2012) Giallongo, E., Menci, N., Fiore, F., Castellano, M., Fontana, A., Grazian, A., Pentericci, L., 2012, ApJ, 755, 124
- Giavalisco (2002) Giavalisco, M., 2002, ARA&A, 40, 579G
- Giavalisco et al. (2004) Giavalisco, M., Dickinson, M., Ferguson, H. C., Ravindranath, S., Kretchmer, C., Moustakas, L. A., Madau, P., et. al., 2004, ApJ, 600, 103
- Grazian et al. (2011) Grazian, A., Castellano, M., Koekemoer, A. M., Fontana, A., Pentericci, L., Testa, V., Boutsia, K., Giallongo, E., Giavalisco, M., Santini, P., 2011, A&A, 532, 33
- Guo et al. (2013) Guo, Y., Ferguson, H. C., Giavalisco, M., Barro, G., Willner, S. P., Ashby, M. L. N., Dahlen, T., Donley, J. L., et al., 2013, ApJ, 207, 24
- Heckman et al. (2011) Heckman, T. M., Borthakur, S.; Overzier, R., Kauffmann, G., Basu-Zych, A., Leitherer, C., Sembach, K., et al., 2011, ApJ, 730, 5
- Ilbert et al. (2009) Ilbert, O., Capak, P., Salvato, M., Aussel, H., McCracken, H. J., Sanders, D. B., Scoville, N., Kartaltepe, J., et al., 2009, ApJ, 690, 1236
- Inoue et al. (2005) Inoue, A. K., Iwata, I., Deharveng, J.-M., Buat, V., Burgarella, D., 2005, A&A, 435, 471
- Inoue & Iwata (2008) Inoue, A. K., Iwata, I., 2008, MNRAS, 387, 1681
- Inoue (2010) Inoue, A., 2010, MNRAS, 401, 1325
- Inoue (2011a) Inoue, A., 2011, MNRAS, 415, 2920
- Inoue et al. (2011b) Inoue, A. K., Kousai, K., Iwata, I., Matsuda, Y., Nakamura, E., Horie, M., Hayashino, T., Tapken, C., Akiyama, M., Noll, S., Yamada, T., Burgarella, D., Nakamura, Y., 2011, MNRAS, 411, 2336
- Inoue et al. (2014) Inoue, A. K., Shimizu, I., Iwata, I., Tanaka, M., 2014, MNRAS, 442, 1805
- Iwata et al. (2009) Iwata, I., Inoue, A. K., Matsuda, Y., Furusawa, H., Hayashino, T., Kousai, K., Akiyama, M.; Yamada, T., Burgarella, D., Deharveng, J.-M., 2009, ApJ, 692, 1287
- Jaskot & Oey (2014) Jaskot, A. E.; Oey, M. S., 2014, ApJ, 791, 19
- Jones et al. (2013) Jones, T. A., Ellis, R. S., Schenker, M. A., Stark, D. P., 2013, ApJ, 779, 52
- Karman et al. (2014) Karman, W.; Caputi, K. I.; Grillo, C.; Balestra, I.; Rosati, P.; Vanzella, E.; Coe, D., et al., 2014, (arXiv-1409.3507)
- Kimm & Cen (2013) Kimm, T., Cen, R., 2013, ApJ, 776, 35
- Kimm & Cen (2014) Kimm, T., Cen, R., 2014, ApJ, 788, 121
- Kulas et al. (2012) Kulas, K. R., Shapley, A. E., Kollmeier, J. A., Zheng, Z., Steidel, C. C., Hainline, Kevin N., ApJ, 745, 33
- Le Fevre et al. (2015) Le Fevre, O., Tasca, L. A. M., Cassata, P., Garilli, B., Le Brun, V., Maccagni, D., Pentericci, L., et al., 2014, arXiv1403.3938L
- Leitherer et al. (2014) Leitherer, C., Ekström, S., Meynet, G., Schaerer, D., Agienko, K. B., Levesque, E. M., 2014, ApJ, 212, 14
- Levesque et al. (2012) Levesque, E. M., Leitherer, C., Ekstrom, S., Meynet, G., Schaerer, D., 2012, ApJ, 751, 67
- Maoz (2007) Maoz, D., 2007, MNRAS, 377, 1696
- Maseda et al. (2014) Maseda, M. V.; van der Wel, A., Rix, H.-W., da Cunha, E., Pacifici, C., Momcheva, I., Brammer, G. B., Meidt, S. E., Franx, M., van Dokkum, P., Fumagalli, M., et al., 2014, ApJ, 791, 17
- McLure et al. (2013) McLure, R. J., Dunlop, J. S., Bowler, R. A. A., Curtis-Lake, E., Schenker, M., Ellis, R. S., Robertson, B. E., at al., 2013, MNRAS, 432, 2696
- Mostardi et al. (2013) Mostardi, R. E., Shapley, A. E., Nestor, D. B., Steidel, C. C., Reddy, N. A., Trainor, R. F., 2013, ApJ, 779, 65
- Nakajima & Ouchi (2014) Nakajima, K., Ouchi, M., 2014, MNRAS, 442, 900
- Nestor et al. (2013) Nestor, D. B., Shapley, A., E., Kornei, K. A., Steidel, C. C., Siana, B.,
- Nonino et al. (2009) Nonino, M., Dickinson, M., Rosati, P., Grazian, A., Reddy, N., Cristiani, S., Giavalisco, M., Kuntschner, H., Vanzella, E., Daddi, E., et al., 2009, ApJ, 183, 244
- O’Meara et al. (2013) O’Meara, J. M., Prochaska, J. X., Worseck, G., Chen, H.-W., Madau, P., 2013, ApJ, 765, 137
- Peng et al. (2010) Peng, C. Y., Ho, L. C., Impey, C. D., Rix, Hans-Walter, 2010, AJ, 139, 2097
- Prochaska et al. (2009) Prochaska, J. X., Worseck, G., O’Meara, J. M., 2009, ApJ, 705, L113
- Prochaska et al. (2010) Prochaska, J. X., O’Meara, J. M., Worseck, G., 2010, ApJ, 718, 392
- Prochaska et al. (2014) Prochaska, J. X., Madau, P., O’Meara, J. M., Fumagalli, M., 2014, MNRAS, 438, 476
- Rollinde et al. (2013) Rollinde, E., Theuns, T., Schaye, J., Paris, I., Petitjean, P., 2013, MNRAS, 428, 540
- Salvato et al. (2009) Salvato, M., Hasinger, G., Ilbert, O., Zamorani, G., Brusa, M., Scoville, N. Z., Rau, A., Capak, P., Arnouts, S., Aussel, H., et al., 2009, ApJ, 690, 1250
- Schaerer & de Barros (2009) Schaerer, D. & de Barros, S., 2009, A&A, 502, 423
- Schaerer & de Barros (2010) Schaerer, D., de Barros, S., 2010, A&A, 515, 73
- Schaerer (2002) Schaerer, D., 2002, A&A, 382, 28S
- Schaerer et al. (2011) Schaerer, D., Hayes, M., Verhamme, A., Teyssier, R., 2011, A&A, 531, 12S
- Shapley et al. (2003) Shapley, A. E., Steidel, C. C., Pettini, M., Adelberger, K. L., 2003, ApJ, 588, 65
- Shapley et al. (2006) Shapley, Alice E.; Steidel, Charles C.; Pettini, Max; Adelberger, Kurt L.; Erb, Dawn K., 2006, ApJ, 651, 688
- Shim et al. (2011) Shim, H., Chary, R.-R., Dickinson, M., Lin, L., Spinrad, H., Stern, D. Yan, C.-H., 2011, ApJ, 738, 69
- Siana et al. (2007) Siana, B., Teplitz, H. I., Colbert, J., et al. 2007, ApJ, 668, 62
- Siana et al. (2010) Siana, B., Teplitz, H. I., Ferguson, H. C., Brown, T. M., Giavalisco, M., Dickinson, M., et al., 2010, ApJ, 723, 241
- Silverman et al. (2010) Silverman, J. D., Mainieri, V., Salvato, M., Hasinger, G., Bergeron, J., Capak, P., Szokoly, G., Finoguenov, A., Gilli, R., Rosati, P., et al., 2010, ApJ, 191, 124
- Smit et al. (2013) Smit, R., Bouwens, R. J., Labbé, I., Zheng, W., Bradley, L., Donahue, M., Lemze, D., Moustakas, J., Umetsu, K., et al., 2014, ApJ, 784, 58
- Songaila & Cowie (2010) Songaila, A., Cowie, L. L., 2010, ApJ, 721, 1448
- Steidel et al. (1999) Steidel, C. C., Adelberger K. L., Giavalisco M., Dickinson M., Pettini M., 1999, ApJ, 519, 1S
- Steidel et al. (2001) Steidel, C. C., Pettini, M., Adelberger, K. L., 2001, ApJ, 546, 665
- Steidel et al. (2003) Steidel, C. C., Adelberger, K. L., Shapley, A. E., Pettini, M., Dickinson, M., Giavalisco, M., 2003, ApJ, 592, 728S
- Szokoly et al. (2004) Szokoly, G. P., Bergeron, J., Hasinger, G., Lehmann, I., Kewley, L., Mainieri, V., Nonino, M., Rosati, P., Giacconi, R., 2004, ApJ, 155, 271
- Telfer et al. (2002) Telfer, R. C.; Zheng, W., Kriss, G. A., Davidsen, A. F., 2002, ApJ, 565, 773
- van der Wel et al. (2011) van der Wel, A., Straughn, A. N., Rix, H.-W., Finkelstein, S. L., Koekemoer, A. M., Weiner, B. J., Wuyts, S., Bell, E. F., Faber, S. M., et al., 2011, ApJ, 742, 111
- Vanzella et al. (2008) Vanzella, E., Cristiani, S., Dickinson, M., Giavalisco, M., Kuntschner, H., Haase, J., Nonino, M., Rosati, P., Cesarsky, C., et al., 2008, A&A, 478, 83
- Vanzella et al. (2009) Vanzella, E., Giavalisco, M., Dickinson, M., Cristiani, S., Nonino, M., Kuntschner, H., Popesso, P., Rosati, P., Renzini, A., et al., 2009, ApJ, 695, 1163
- Vanzella et al. (2010a) Vanzella, E., Siana, B., Cristiani, S., Nonino, M., 2010, MNRAS, 404, 1672
- Vanzella et al. (2010b) Vanzella, E., Giavalisco, M., Inoue, A. K., et al. 2010, ApJ, 725, 1011
- Vanzella et al. (2011) Vanzella, E., Pentericci, L., Fontana, A., Grazian, A., Castellano, M., Boutsia, K., Cristiani, S., Dickinson, M., et al., 2011, ApJ, 730, 35
- Vanzella et al. (2012) Vanzella, E., Guo, Y., Giavalisco, M., Grazian, A., Castellano, M., Cristiani, S., Dickinson, M.; Fontana, A., Nonino, M., Giallongo, E., et al, 2012, ApJ, 751, 70
- Vanzella et al. (2014a) Vanzella, E., Fontana, A., Zitrin, A., et al. 2014, ApJ, 783, L12
- Vanzella et al. (2014b) Vanzella, E., Fontana, A., Pentericci, L., Castellano, M., Grazian, A., Giavalisco, M., Nonino, M., Cristiani, S., Zamorani, G., Vignali, C., 2014b, A&A, 569, 78
- Verhamme et al. (2008) Verhamme, A.; Schaerer, D.; Atek, H.; Tapken, C., 2008, A&A, 491, 89V
- Verhamme et al. (2014) Verhamme, A.; Orlitova, I.; Schaerer, D.; Hayes, M., 2014, A&A in press, (arXiv/1404.2958V)
- Villforth et al. (2010) Villforth, C.,Koekemoer, A. M., Grogin, N. A., 2010, ApJ, 723, 737
- Wise et al. (2014) Wise, J. H., Demchenko, V. G., Halicek, M. T., Norman, M. L., Turk, M. J., Abel, T., Smith, B. D., 2014, MNRAS, 442, 2560
- Worseck et al. (2014) Worseck, G., Prochaska, J. X., O’Meara, J. M., Becker, G. D., Ellison, S. L., Lopez, S., Meiksin, A., Ménard, B., et al., 2014, MNRAS, 445, 1745
- Wyithe et al. (2104) Wyithe, J. Stuart B.; Loeb, Abraham; Oesch, Pascal A., 2014, MNRAS, 439, 1326
- Xue et al. (2011) Xue, Y. Q., Luo, B., Brandt, W. N., Bauer, F. E., Lehmer, B. D., Broos, P. S., Schneider, D. P., Alexander, D. M., Brusa, M., Comastri, A.,, et al., 2011, ApJ, 195, 10