Discovery of a Low-Luminosity, Tight Substellar Binary at the T/Y Transition**affiliation: Data presented herein were obtained at the W.M. Keck Observatory from telescope time allocated to the National Aeronautics and Space Administration through the agency’s scientific partnership with the California Institute of Technology and the University of California. The Observatory was made possible by the generous financial support of the W.M. Keck Foundation. ††affiliation: Some observations were obtained under program ID GN-2012B-DD-5 at the Gemini Observatory, which is operated by the Association of Universities for Research in Astronomy, Inc., under a cooperative agreement with the NSF on behalf of the Gemini partnership: the National Science Foundation (United States), the National Research Council (Canada), CONICYT (Chile), the Australian Research Council (Australia), Ministério da Ciência, Tecnologia e Inovação (Brazil) and Ministerio de Ciencia, Tecnología e Innovación Productiva (Argentina).
Abstract
We have discovered that the brown dwarf WISE J014656.66+423410.0 is a close binary (, AU) from Keck laser guide star adaptive optics imaging. Our photometry for this system reveals that both components are less luminous than those in any known substellar binary. Combining a new integrated-light spectrum (T9p) and resolved -band photometry from Keck allows us to perform spectral decomposition and assign component types of T9 and Y0. Many of the unusual features in the spectrum might be explained by high surface gravity: -band peak broadened to the blue; -band peak broadened to the red; -band peak shifted slightly to the red; and red colors. Interestingly, the very low component luminosities imply that the T9 primary is unexpectedly cold ( K assuming an age of 10 Gyr), making it 100 K cooler than any other late-T dwarf and comparable to Y dwarfs. One intriguing explanation for this apparent discrepancy is that the - and -band spectral features that trigger the transition from T to Y spectral types are highly gravity-dependent. This can be tested directly in the very near future by orbit monitoring. We constrain the orbital period to be 10 yr by combining evolutionary model-based mass estimates for the components (12–21 , 1 at 10 Gyr) with a statistical constraint on the semimajor axis (1.3 AU). Such a period is shorter than any other known T/Y transition binary, meaning that WISE J0146+4234AB will likely yield a dynamical mass within the next few years.
1 Introduction
The last few years have seen a rapid increase in the discovery of brown dwarfs significantly cooler than any previously known objects in the solar neighborhood (Luhman et al., 2011; Liu et al., 2011; Kirkpatrick et al., 2011, 2012; Luhman, 2014). Cushing et al. (2011) presented the discovery of several brown dwarfs from Wide-field Infrared Survey Explorer (WISE) data, and they distinguished these objects from warmer brown dwarfs primarily using spectral features in the and bands and proposed a new “Y” spectral class for the sample. Dupuy & Kraus (2013) presented the first comprehensive sample of parallaxes for the Y dwarfs and derived bolometric luminosities showing that even objects with quite different near-infrared spectra (and thus very different estimates from model atmospheres) in fact had indistinguishable temperatures of 400–450 K. Assuming ages of 1–5 Gyr, typical for field brown dwarfs, evolutionary models predict masses of 6–20 for the Y dwarfs. Thus, Y dwarfs could be free-floating planetary-mass (13 ) objects, but this can only be tested directly with dynamical mass measurements from binaries. However, none of the binaries yet discovered at the T/Y transition (Gelino et al., 2011; Liu et al., 2011, 2012) have short enough estimated periods (20 yr) to enable orbit determinations in the near future.
We present here the discovery of a tight () binary at the Y dwarf boundary from our ongoing Keck laser guide star adaptive optics (LGS AO) imaging survey. Mace et al. (2013a) discovered the unresolved source WISE J014656.66+423410.0, hereinafter WISE J0146+4234, and assigned a spectral type of Y0 based on Keck/NIRSPEC spectroscopy in and bands (also see Kirkpatrick et al., 2012). Using a new, higher signal-to-noise ratio (S/N) Gemini/GNIRS spectrum covering 0.9–2.4 µm we derive an integrated-light spectral type of T9p for WISE J0146+4234. Adopting the parallax distance of pc from Beichman et al. (2014), the projected separation of WISE J0146+4234AB is 0.9 AU, which would make it tighter than any previously known L or T dwarf visual binary at discovery.
2 Observations
2.1 Keck/NIRC2 LGS AO
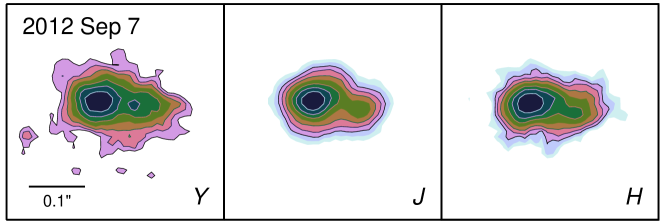
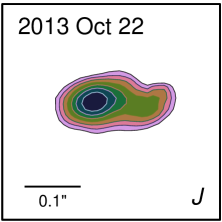
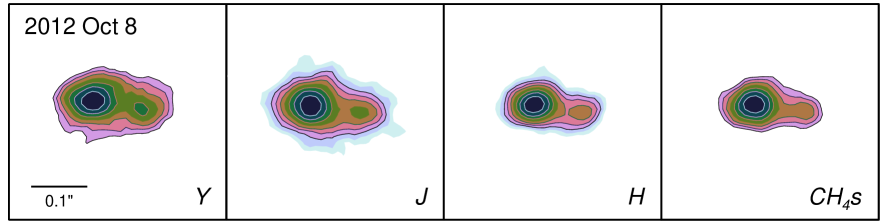
We first observed WISE J0146+4234 during a period of exceptionally good seeing on 2012 Sep 7 UT with the facility near-infrared camera NIRC2 with the LGS AO system at the Keck II telescope (Wizinowich et al., 2006; van Dam et al., 2006). According to the differential image motion monitor (DIMM) at the Canada-France-Hawaii Telescope, the seeing in the visible was on Mauna Kea during our observations. Compared to all archived seeing measurements during 2012, such favorable conditions occur 5% of the time that the DIMM is active. During our dither sequences we kept the LGS centered in NIRC2’s narrow camera field of view. The wavefront sensor recorded an LGS flux equivalent to a –10.2 mag star and a lower bandwidth sensor monitored the star 2MASS J01465144+4234388 ( mag, 65″ away from the target) in order to perform tip-tilt corrections. We later observed WISE J0146+4234 in the same setup on 2012 Oct 8 and 2013 Oct 22 UT, during times of unusually good seeing (– and –, respectively).
We reduced our LGS AO data in the same fashion as our previous work (Liu et al., 2008; Dupuy et al., 2009b, c, 2010). Reduced images from each data set are shown in Figure 1. We measured binary parameters by fitting three-component Gaussians to individual images and determined the uncertainties in these parameters from the rms scatter among each data set. To correct for non-linear distortions in NIRC2 we used the calibration of Yelda et al. (2010), from which we also adopt linear terms of mas pixel-1 for the pixel scale and for the detector’s -axis orientation relative to North. Table 1 presents the binary separation, position angle (P.A.), and flux ratio that we derived from each data set, along with the airmass and AO-corrected FWHM of our images. We note that the astrometry measured in different bandpasses at a given epoch agree well within the errors and have reasonable , supporting our adopted astrometric uncertainties.
2.2 Gemini/NIRI Photometry
WISE J0146+4234 had no previously published photometry on the Mauna Kea Observatories (MKO) system, and the 2MASS system photometry from Kirkpatrick et al. (2012) has very large errors, so we obtained new MKO photometry using the facility camera NIRI at the Gemini-North Telescope (Hodapp et al., 2003) on 2013 Jan 10 and 2013 Jan 12 UT. All data were taken on photometric nights, with seeing typically around 08 and UKIRT FS 6 used for photometric calibration. Our observations at , , , , and bands are summarized in Table 2. We note that our photometry is highly inconsistent with the values presented by Kirkpatrick et al. (2012), even after accounting for the conversion from 2MASS to MKO systems. mag and mag according to synthesized photometry from our GNIRS spectrum (Section 2.3). Our photometry is 1.6 mag (6.0) fainter at band and 2.5 mag (9.3) fainter at band. The cause of this discrepancy is not clear, but we note that Leggett et al. (2013) reported similar cases for three Y dwarfs that they found were significantly fainter (0.5–1.0 mag) than published values from Cushing et al. (2011) and Kirkpatrick et al. (2012). We suspect large systematic errors in the photometry from Kirkpatrick et al. (2012) for WISE J0146+4234 because colors based on those values were noted by Lodieu et al. (2013) to be extremely unusual ( and colors 2 mag redder than objects of similar spectral type), whereas our and magnitudes resolve this discrepancy. Beichman et al. (2014) have also reported -band photometry ( mag) that agrees with our higher precision Gemini measurement. We therefore use our photometry in the following analysis.
2.3 Gemini/GNIRS Spectroscopy
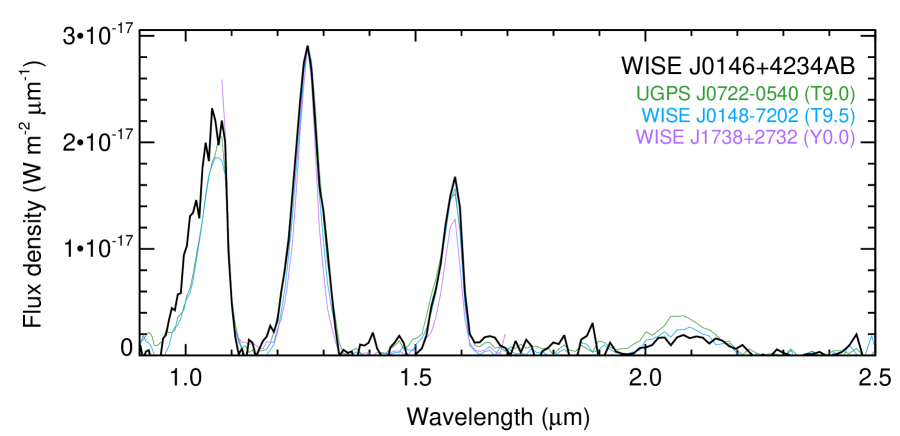
We obtained a full 0.9–2.4 µm spectrum of WISE J0146+4234 using the GNIRS spectrograph (Elias et al., 2006) because the published spectrum from Mace et al. (2013a) had limited wavelength coverage and low S/N. We used the 32 lines mm-1 grating, pixel-1 camera, and slit to achieve a resolving power of over a total integration time of 8400 s (Table 2). We reduced our data in a similar fashion to our previous work (e.g., Leggett et al., 2014a), and the flat fielded, sky subtracted, and rectified integrated-light spectrum of WISE J0146+4234AB is shown in Figure 2. We flux calibrated the spectrum using our NIRI photometry at , , and bands (Table 2). To account for modest discrepancies between our synthesized and measured colors, we added 0.2 mag errors in quadrature to our synthesized photometry to achieve when computing the optimal scaling factor and its error.
From our calibrated spectrum we computed -band photometry as check against our very low S/N NIRI photometry ( mag). After accounting for the uncertainty in the calibration, we synthesized mag. This is inconsistent with our NIRI photometry at 2.3. Both our photometry and the -band portion of our GNIRS spectrum are very low S/N, and our synthesized photometry may be subject to systematic errors associated with extrapolating our flux calibration from to . Therefore, in the following analysis we adopt an average value of mag that is consistent at 1.3 with both measured and synthesized photometry.
3 Results
3.1 Companionship
From our resolved photometry alone, companionship is highly likely. The blue near-infrared colors of the companion WISE J0146+4234B are very similar to WISE J0146+4234A, implying that it not likely to be a background giant. The difference in color of mag between the two components implies that they have similar levels of methane absorption and therefore are both late-type T or Y dwarfs. According to Liu et al. (2012), the probability of finding such an unassociated late-T dwarf in the entire field of view of NIRC2’s narrow camera is , thus the likelihood that the two components of WISE J0146+4234AB are not physically bound is negligible. Moreover, the proper motion of yr-1 and parallax of measured by Beichman et al. (2014) implies that an unassociated background star would move by between our first and last observations, which is strongly ruled out by our astrometry (Table 1).
3.2 Spectral Types
To determine the integrated-light spectral type of WISE J0146+4234AB we directly compared our spectrum to standards from Cushing et al. (2011). For reference, we also computed commonly used spectral indices, which we report in Table 3. In determining spectral types we focus on the - and -band regions of the spectrum, leaving the somewhat unusual -band region to our later discussion in Section 3.5.1.
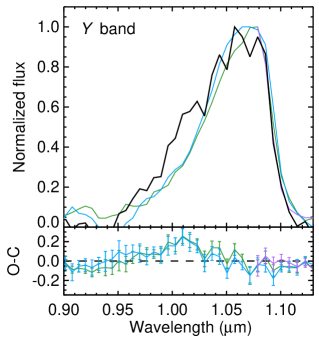
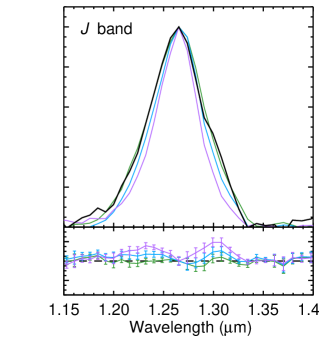
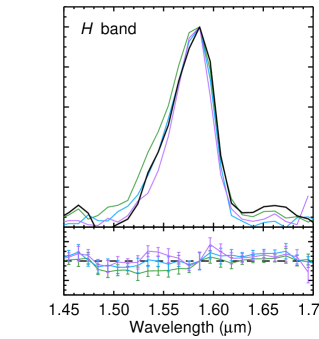
The relative heights of the flux peaks in the and bands better match the T9 standard UGPS J072227.51054031.2 and T9.5 dwarf WISEPC J014807.25720258.7 than the Y0 standard WISEPA J173835.53+273258.9 (Figure 2). The -band region, normalized to its peak flux, best matches the T9 standard UGPS J07220540 because the Y0 standard, and even the T9.5 dwarf WISE J01487202, have notably narrower flux peaks. This is reflected by the fact that -band spectral indices WJ (Warren et al., 2007) and -narrow (Mace et al., 2013a) best match the T9 dwarfs from Mace et al. (2013a). However, the peak-normalized -band region seems to be intermediate between T9 and Y0 standards, best matching the T9.5 dwarf WISE J01487202. In terms of indices, this manifests as an NH index (Delorme et al., 2008) that best matches T9.5 dwarfs. We also note that the wavelength at the peak of the -band flux is shifted slightly to the red by 0.006 µm, a feature that has only previously been observed in WISEPC J140518.40+553421.4, which was typed as Y0(pec?) by Cushing et al. (2011). No two of these three traits (T9-like band, T9.5-like band, and shifted -band peak) have been observed in any other object, making the integrated-light spectrum of WISE J0146+4234AB particularly unusual. The two methane indices (defined by Burgasser et al., 2006b) are broadly consistent with a late-T or Y spectral type. The CH index best matches T9.5 dwarfs but is also consistent with Y0 dwarfs. The CH index is problematic because the numerator has almost no flux in it by the late-T dwarfs. Thus, even though our spectrum has sufficient S/N to accurately measure this index, many comparison objects do not, so our value ends up being consistent within the rms of all T8.5–Y0 spectral type bins.
Overall, we find evidence for both T9 and T9.5 spectral types by visually comparing to spectral standards and examining spectral indices. Most published work has focused on band in determining spectral types at the T/Y transition, and our band spectrum leans more toward a type of T9. Therefore, we assign a type of T9p to the integrated-light spectrum of WISE J0146+4234AB. In this case, the peculiar designation refers to both the 0.006 µm shift in the -band peak, as originally suggested by Cushing et al. (2011) for WISE J1405+5534, and the T9.5-like -band spectrum.
To determine spectral types for the individual components of WISE J0146+4234AB,
we performed spectral decomposition following the method outlined in
Section 5.2 of Dupuy & Liu (2012). Briefly, we consider all
possible pairs from a library of template spectra and find the optimal
scale factors needed for a pair of templates to best match the
observed integrated-light spectrum. We then compute synthetic relative
photometry for these pairings and compute the of these values
compared to the measured flux ratios from our Keck LGS AO imaging.
Unlike in Dupuy & Liu (2012), here we have a much smaller
library of template spectra given the number of objects later than T8
with high quality near-IR spectra. Our library comprises four T8.5
dwarfs (ULAS J003402.77005206.7, WISEPC J121756.91+162640.2A, ULAS J133553.45+113005.2, and
Wolf 940B), two T9 dwarfs (UGPS J07220540 and CFBDSIR J145829+101343AB), one T9.5 dwarf
(WISE J01487202), five Y0 dwarfs (WISEPA J041022.71+150248.5, WISE J1217+1626B, WISE J1405+5534, WISE J1738+2732, and WISEPC J205628.90+145953.3),
and one Y0.5
(WISEPA J154151.66225025.2). Spectra for these objects were published
by Warren et al. (2007), Burningham et al. (2008, 2009), Cushing et al. (2011), and
Leggett et al. (2014a). Another difference in our analysis
compared to Dupuy & Liu (2012) is the wavelength range
tested. Because many published spectra do not extend into or
band, we use only the 1.15–1.85 µm region for our fitting.
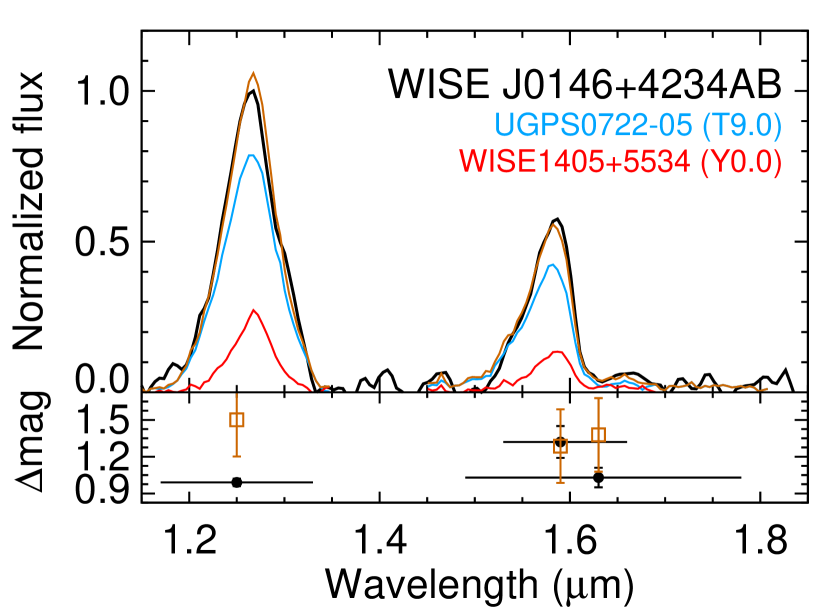
The best matching template pair, both in terms of fitting our integrated-light spectrum and flux ratios at , , and bands, is UGPS J07220540 (T9) and WISE J1405+5534 (Y0p). A primary spectral type of T9 is consistent with the fact that this brighter component should dominate the integrated-light spectrum given our Keck flux ratios of 1.0 mag in and bands. It is not surprising that WISE J1405+5534 provides the best matching secondary component because of some of the features it shares with our integrated-light spectrum (shifted -band peak and large CH index). Figure 3 shows this best-fit template pairing. A number of other template pairings give both a good fit to the spectrum and reasonable flux ratios. These either use UGPS J07220540 (T9) or a T8.5 (ULAS J00340052 or WISE J1217+1626A) as the primary and a Y0 (WISE J1217+1626B, WISE J1738+2732, or WISE J2056+1459) or the T9.5 WISE J01487202 as the secondary. Therefore, we assign component types corresponding to our best-fit template pair (T9+Y0) with uncertainties of 0.5 subtypes in each. Given some of the unusual features seen in integrated light, we note that one or both components may also be peculiar despite our not typing them as such.
3.3 Near- and Mid-Infrared Colors and Magnitudes
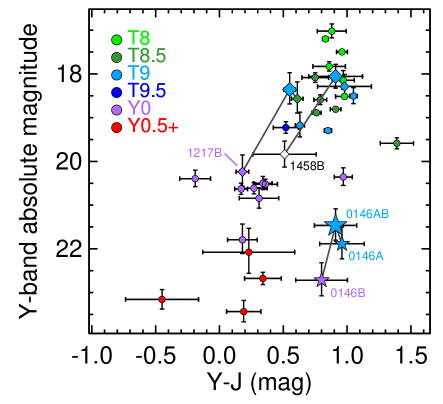
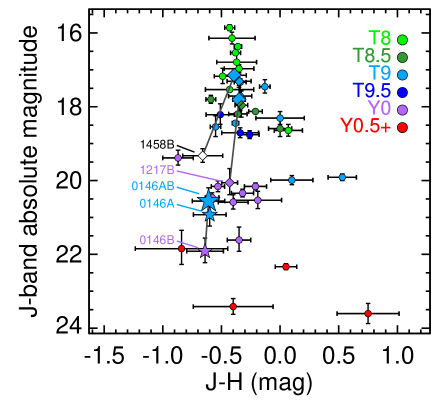
Our new photometry and spectral analysis allow us to compare the colors of WISE J0146+4234AB to other late-T and Y dwarfs (Figure 4). The colors of both components and the integrated-light color are mostly typical of other T8.5–Y0 objects. The color in which the components appear most unusual is , where the Y0 secondary’s color is mag. This would not be unusual for a late-T dwarf, but it is on the extreme red end of colors for Y dwarfs where only one comparably red object is known, the Y0 dwarf WISE J073444.02715744.0 ( mag; Leggett et al., 2014b). Moreover, both components of WISE J0146+4234AB are distinctive in that they are the reddest known objects in at faint absolute magnitude ( mag). Their colors place them on the blue edge of the T/Y sequence in color–magnitude diagrams, and their integrated-light color of mag is normal for objects of comparable absolute magnitude but would be relatively blue for a late-T dwarf.
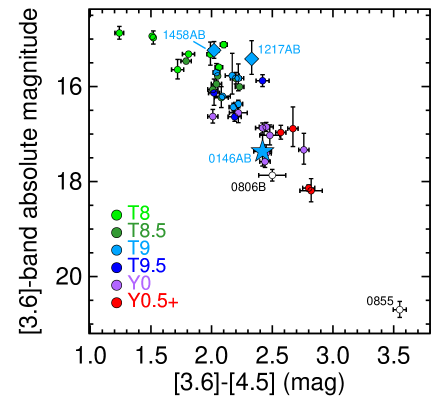
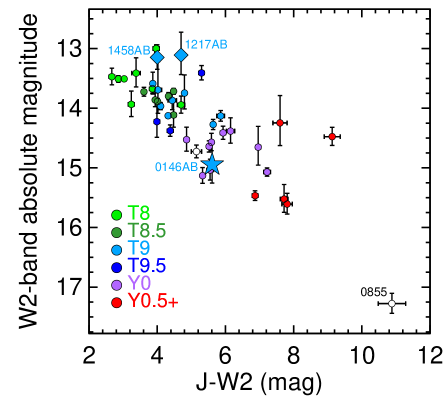
On mid-infrared color–magnitude diagrams, the integrated-light photometry of WISE J0146+4234AB follows the sequence of late-T and Y dwarfs, but its location is unusual given the integrated-light spectral type of T9. WISE J0146+4234AB’s integrated-light color mag is the reddest of any known T9 dwarf, with the next reddest objects being the T8.5+Y0 binary WISE J1217+1626AB (T9 in integrated-light with mag) followed by WISE J033515.01+431045.1 (T9) and WISEPA J213456.73713743.6 (T9p) both with mag. The only late-T dwarf that is as red as WISE J0146+4234AB is WISE J081117.81805141.3 (T9.5:, mag), but like other T9 and T9.5 dwarfs it is 1.0–1.5 mag brighter in -band absolute magnitude than the combined light of WISE J0146+4234AB. The situation is similar but less extreme in color versus -band absolute magnitude. WISE J0146+4234AB is the reddest late-T dwarf ( mag) with the exceptions of WISEPC J232519.54410534.9 (T9p; mag) and WISE J21347137 (T9p; mag). Both of these were typed as peculiar by Kirkpatrick et al. (2011) due to excess flux at band and less flux at band, similar to features seen in the integrated-light spectrum of WISE J0146+4234AB. However, unlike these T9p objects, the integrated-light -band flux of WISE J0146+4234AB is 0.7–0.8 mag fainter, implying that the individual components are 1 mag fainter.
Both components of WISE J0146+4234AB have very faint absolute magnitudes given their spectral types. WISE J0146+4234A is the faintest T9 dwarf known in any near- or mid-infrared bandpass, and WISE J0146+4234B is as faint or fainter than WISE J1405+5534 (Y0p) in near-infrared magnitudes and could be the faintest in the mid-infrared, too, depending on the binary flux ratio at those wavelengths. WISE J0146+4234A is the only late-T dwarf wholly overlapping in colors and magnitudes with the Y dwarfs.
3.4 Bolometric Magnitudes
Dupuy & Kraus (2013) showed that summing fluxes across the near- and mid-infrared can produce an estimate for the bolometric magnitudes () of late-T and Y dwarfs that is only weakly dependent on the assumed model atmospheres. We applied this “super-magnitude” approach to the integrated-light photometry of WISE J0146+4234AB and found mag. To apportion this between the two individual components we employed our resolved near-infrared photometry. For our purposes, only the relative near-infrared super-magnitude between the two components is relevant, and we find mag. To convert this into a bolometric flux ratio requires an estimate of the bolometric correction for each component. Dupuy & Kraus (2013) report bolometric corrections of BC mag at T9 and mag at Y0, and we adopt these values for the primary and secondary, respectively. Thus, the bolometric flux ratio is calculated as mag, and we find bolometric magnitudes of mag and mag for the primary and secondary, respectively.
We compare our apparent bolometric magnitude estimates to the typical absolute magnitudes of late-T and Y dwarfs in order to illustrate an unusual property of WISE J0146+4234AB. Using the values from Table S5 of Dupuy & Kraus (2013), we find that mag for T9 and mag for Y0, where the error bars represent the intrinsic rms scatter in bolometric magnitude among objects of the same spectral type. Assuming spectral types of T9+Y0 for WISE J0146+4234AB, the integrated-light absolute bolometric magnitude would be mag if they were typical of other known objects. However, this is 1.7 mag different from the bolometric magnitude of mag derived from the photometry above and the parallactic distance of pc from Beichman et al. (2014). Therefore WISE J0146+4234AB is significantly less luminous than other known objects of the same spectral type, which at least partly explains its unusual appearance on color–magnitude diagrams as described above.
We consider the alternative that the parallax of mas from Beichman et al. (2014) is in error. They used multiple telescopes (WISE, Spitzer, and Keck) and bandpasses (, , ) to measure the parallax, which introduces the possibility of systematic errors in the astrometry. This is especially true in the case of a T9+Y0 binary where the flux ratio could vary considerably from the near- to mid-infrared causing unaccounted for shifts in center-of-light measurements at different epochs. However, for the components of WISE J0146+4234AB to have normal magnitudes for a T9+Y0 dwarf pair would require a distance of pc, where the error bars account for the uncertainty in the and scatter in as a function of spectral type (Dupuy & Kraus, 2013), and thus a parallax of 40 mas. This would require photocenter shifts of more than half the binary separation, and such shifts would have to be correlated with the parallax factor. Figure 17 of Beichman et al. (2014) shows that there is both Keck and Spitzer data on both sides of the ellipse, so a large error in the parallax due to mixing bandpasses seems unlikely.
We also consider whether orbital motion could have impacted their parallax. Because proper motion accommodates for any linear orbital motion, only acceleration is a concern, and this usually shows up in the residuals of the fit. Beichman et al. (2014) report (27 degrees of freedom), so there are no significant residuals due to orbital motion, but such acceleration could in principle be aligned with the parallax motion by chance. To test this possibility, we fitted just the Beichman et al. (2014) astrometry spanning 2012 October to 2013 November, which is contemporaneous with our Keck data that show only a small amount of orbital motion, mas yr-1. We find a relative parallax of mas in this fit, which is consistent with their reported value. Finally, we have determined a preliminary parallax of mas from our own ongoing astrometry program at the Canada-France-Hawaii Telescope (Dupuy & Liu, 2012), which further supports the unusually low luminosity of WISE J0146+4234AB.
3.5 Estimated Physical Properties
We used the cloud-free Cond evolutionary models of Baraffe et al. (2003) to estimate the physical properties of the binary components from their luminosities and simple assumptions for the system age. We combine our bolometric magnitudes from above and the parallactic distance from Beichman et al. (2014) to compute dex for the primary and dex for the secondary. We interpolate the Cond model grid at ages of 1 Gyr and 10 Gyr to derive masses, temperatures, and other properties from these values and present the results in Table 5.
Some properties that we derive from evolutionary models vary significantly with the assumed age, while others do not. For example, the primary component’s mass and effective temperature are and K at 1 Gyr but and K at 10 Gyr. This is because models predict a radius contraction of only 17% from 1 Gyr to 10 Gyr, so for a given the estimate changes by a small amount. Unlike the radius however, luminosity is a strong function of mass and age at field ages (; Burrows et al., 2001). Consequently, a property like surface gravity that depends on mass changes significantly with the assumed age (0.7 dex) while the effective temperature only changes by 25 K.
3.5.1 High Surface Gravity
There is an extensive literature on the impact of both surface gravity and metallicity variations on the emergent spectra of T dwarfs with –1000 K (e.g., Burrows et al., 2002; Liu et al., 2007; Leggett et al., 2007; Mace et al., 2013b), but similar studies are only beginning for 500 K objects at the T/Y transition. The latest model atmospheres from Morley et al. (2014) show how the shapes of normalized near-IR flux peaks change with varying surface gravity (their Figure 15) at the temperatures of Y dwarfs. Models at dex ( in cgs units) have distinctive features compared to dex at a common K such as substantially increased flux on the blue side of the peak-normalized band, a broader -band peak caused by increased flux on the red side, and a wavelength for the -band flux peak slightly shifted to the red. Note that the -band excess is only a change in the shape of the peak and not its amplitude, as Morley et al. (2014) predict that actually becomes 0.5 mag redder due to the integrated flux at band being more suppressed than at band when going from dex to 5.0 dex.
We observe all of these features in our integrated-light spectrum of WISE J0146+4234AB (Figure 2). To our knowledge, this is the first object known to possess all of these traits. A number of objects have been reported to display enhanced flux on the blue side of band (e.g., Kirkpatrick et al., 2011; Leggett et al., 2014a), but of these only WISE J030449.03270508.3 (Y0p) has been reported to show the slightly increased flux on the red side of the -band peak (Pinfield et al., 2014). WISE J1405+5534 (Y0p) displays the shifted peak wavelength in band (Cushing et al., 2011) but has a normal band and no -band data. Unfortunately, non-solar metallicity models are not yet available at these temperatures, so it is not known if any of these traits could also be reproduced by a sub-solar metallicity, as is often the case for earlier type T dwarfs where the effects of low metallicity and high gravity can be similar (e.g., Burgasser et al., 2006a; Mace et al., 2013b).
We conclude therefore that WISE J0146+4234AB is very likely to be relatively old, having higher surface gravity and/or lower metallicity compared to other known T/Y transition objects. The chief caveat is that we only have an integrated-light spectrum that is likely dominated by the primary along with our resolved broadband photometry to characterize the photospheres of the individual components. Our spectral decomposition analysis in Section 3.2 demonstrates that even a 1 mag fainter secondary can influence the best-fit template match, since in this case it was the Y0p WISE J1405+5534. Among the next tier of best matching templates both components of WISE J1217+1626AB (T8.5+Y0) were often favored, and these are also high surface gravity/low metallicity candidates (Liu et al., 2012; Leggett et al., 2014a).
3.5.2 Semimajor Axis and Orbital Period
The projected separation of WISE J0146+4234AB at discovery was ( AU), and we can use Table 6 of Dupuy & Liu (2011) to convert this into a statistical estimate of the semimajor axis (). The conversion factor for very-low mass visual binaries () gives a semimajor axis estimate of ( AU). However, because we discovered WISE J0146+4234AB very near the resolution limit of our Keck LGS AO images, we are likely in the “moderate discovery bias” case where the inner working angle of the discovery observations () is roughly half the size of the semimajor axis and a different conversion factor applies. Thus, our best estimate for the semimajor axis is ( AU). We note that WISE J0146+4234AB likely has the smallest projected separation in AU at discovery of any visual binary ever found among L, T, or Y dwarfs. The next tightest is 2MASS J153449842952274AB that was discovered at AU (Burgasser et al., 2003).
We can further estimate the orbital period of WISE J0146+4234AB via Kepler’s Third Law using the total system mass estimate we derived from evolutionary models. Assuming an age of 10 Gyr gives and using the smaller of the semimajor axes above (moderate discovery bias) yields a period estimate of yr. Even if WISE J0146+4234AB were much younger and thereby lower mass ( for an age of 1 Gyr), its estimated orbital period would still be quite short ( yr). Thus, regardless of the current uncertainties in the system mass and semimajor axis, WISE J0146+4234AB appears to be an excellent candidate for dynamical mass determination via monitoring of the binary orbit over the next several years, as it typically requires only 30% coverage of the orbital period to enable a direct measurement of the system mass (e.g., Dupuy et al., 2009a). In fact, we already detect a small amount of orbital motion in our Keck LGS AO imaging that spans 1.1 yr ( mas yr-1).
4 Discussion
Both components of WISE J0146+4234AB appear to be less luminous than any other known members of substellar binaries, even the Y dwarf companions CFBDSIR J1458+1013B and WISE J1217+1626B (Liu et al., 2011, 2012). This in turn implies that many of the properties of WISE J0146+4234AB are extreme relative to other known systems. To reach such low luminosities, both components of WISE J0146+4234AB must be planetary mass (13 ) and/or very old. We identify several spectrophotometric features that are indicative of high surface gravity, so it appears likely that the system is indeed old, although sub-solar metallicity models at –500 K are needed to strengthen this conclusion. We estimate component masses that are quite small, with Cond models giving 13–21 for the primary (1 range) and 12–19 for the secondary even if the system is 10 Gyr old. Currently, a large source of uncertainty in the component properties is how the integrated-light bolometric flux should be divided between the two components. Resolved mid-infrared photometry and near-infrared spectroscopy are needed to more precisely determine the physical properties of both components.
The faintness of WISE J0146+4234A is unexpected given its T9 spectral type. Its absolute magnitudes are 1.0–1.5 mag fainter in the mid-infrared and 2 mag fainter in the near-infrared than is typical for its spectral type, even allowing for a 0.5 subtype uncertainty in classification. The faint absolute magnitudes lead to a low bolometric flux estimate, and in turn a low temperature of K for the primary (assuming an age of 10 Gyr). This is 100 K colder than any other known late-T dwarf.111The lowest published -based for a late-T dwarf is K for UGPS J07220540 (T9), assuming an age of 1 Gyr (Dupuy & Kraus, 2013). Examining other objects with recently published parallaxes, we compute that only WISE J23254105 (T9p), WISE J21347137 (T9p), and WISE J01487202 (T9.5) have cooler estimates, ranging from K to K, assuming ages of 1 Gyr and using parallaxes from Tinney et al. (2014) and photometry from Kirkpatrick et al. (2011). According to the Stefan-Boltzmann Law, at a given luminosity . Thus, a 20% discrepancy in could be compensated by the radius being 40% smaller, i.e., 0.55 instead of 0.91 . Such a radius is unphysical as it is significantly smaller than any predicted or measured substellar radii (e.g., Chabrier et al., 2009; Montet et al., 2014, and references therein). According to evolutionary models from Saumon & Marley (2008), assuming an age older than 10 Gyr would have only a small effect (1%) on the radius, and assuming a 2 larger mass would reduce the radius by only 10%. However, these effects might partially explain the apparent temperature discrepancy between WISE J0146+4234A and other T9/T9.5 dwarfs. A systematic error in the Beichman et al. (2014) parallax distance could also mitigate this discrepancy, but to explain it entirely would require an unlikely error of a factor of 2 in the measured parallax. Therefore, we conclude that the discrepancy between WISE J0146+4234A’s spectral type and its temperature cannot be completely explained by systematic errors in the assumed radius or luminosity.
One intriguing explanation for the 100 K cooler of WISE J0146+4234A compared to other objects of similar spectral type is that the features in the and bands that are widely used to determine spectral types for late-T and Y dwarfs are highly dependent on gravity or metallicity. Since these flux peaks are shaped by molecular features (e.g., CH4, H2O, H2, and NH3), a sensitivity to gravity or metallicity is not unexpected. This did not appear to be the case in the initial sample of late-T and Y dwarfs with -based temperatures from Dupuy & Kraus (2013) where spectral types tended to track well with , with the possible exception of T9.5 dwarfs that seemed to be warmer or similar temperature compared to T9 dwarfs. However, as the sample of parallaxes for late-T and Y dwarfs grows, a jumbling of objects with the same but very different spectral types should become clearly apparent if the range of surface gravities and/or metallicities of the field population significantly affect near-infrared spectral types.
With only a few of the coldest known brown dwarfs showing signatures of high surface gravity, it seems that objects like the components of WISE J0146+4234AB must either be relatively uncommon or observationally selected against. Morley et al. (2014) predict that high surface gravity objects at a given temperature are indeed 0.2–0.3 mag fainter in the band that was used to discover most known objects of this type. However, this would lead to lower gravities being over represented by only 30%–50% in a magnitude-limited sample. In fact, given the generic assumption of a declining star formation history in the solar neighborhood (e.g., Aumer & Binney, 2009), older, higher gravity brown dwarfs should be much more common at a given than lower gravity ones, unless the mass function compensates by having a strong preference for producing lower mass brown dwarfs. If higher gravity brown dwarfs are uncommon it would imply either an unusual age distribution for brown dwarfs in the solar neighborhood (favoring younger ages) or a large undiscovered population of planetary-mass brown dwarfs that are the older and colder but similar mass counterparts to the current Y dwarf sample.
Fortunately, WISE J0146+4234AB will soon provide an opportunity to much better constrain its physical properties. With a projected separation of AU and estimated orbital period 10 yr, WISE J0146+4234AB is not only a contender for the tightest known ultracool binary, it is also the first binary discovery at the T/Y transition that is likely to yield a dynamical mass quickly, as other discoveries have estimated orbital periods of 40–400 yr. The relative orbit of WISE J0146+4234AB could be determined by astrometric monitoring within just a few years. A dynamical mass for WISE J0146+4234AB will test the hypothesis that the components are old and massive with high surface gravity, which is solely based on current theoretical predictions of the spectrophotometric properties of brown dwarfs. As perhaps the only planetary-mass brown dwarfs with a dynamical mass measurement for the next several years, WISE J0146+4234AB will be a prime target for James Webb Space Telescope spectroscopy to test cold model atmospheres where the physical parameters are well constrained by observations.
References
- Aumer & Binney (2009) Aumer, M., & Binney, J. J. 2009, MNRAS, 397, 1286
- Baraffe et al. (2003) Baraffe, I., Chabrier, G., Barman, T. S., Allard, F., & Hauschildt, P. H. 2003, A&A, 402, 701
- Beichman et al. (2014) Beichman, C., Gelino, C. R., Kirkpatrick, J. D., et al. 2014, ApJ, 783, 68
- Burgasser et al. (2006a) Burgasser, A. J., Burrows, A., & Kirkpatrick, J. D. 2006a, ApJ, 639, 1095
- Burgasser et al. (2006b) Burgasser, A. J., Geballe, T. R., Leggett, S. K., Kirkpatrick, J. D., & Golimowski, D. A. 2006b, ApJ, 637, 1067
- Burgasser et al. (2003) Burgasser, A. J., Kirkpatrick, J. D., Reid, I. N., et al. 2003, ApJ, 586, 512
- Burningham et al. (2008) Burningham, B., Pinfield, D. J., Leggett, S. K., et al. 2008, MNRAS, 391, 320
- Burningham et al. (2009) —. 2009, MNRAS, 395, 1237
- Burrows et al. (2002) Burrows, A., Burgasser, A. J., Kirkpatrick, J. D., et al. 2002, ApJ, 573, 394
- Burrows et al. (2001) Burrows, A., Hubbard, W. B., Lunine, J. I., & Liebert, J. 2001, Reviews of Modern Physics, 73, 719
- Chabrier et al. (2009) Chabrier, G., Baraffe, I., Leconte, J., Gallardo, J., & Barman, T. 2009, in American Institute of Physics Conference Series, Vol. 1094, 15th Cambridge Workshop on Cool Stars, Stellar Systems, and the Sun, ed. E. Stempels, 102
- Cushing et al. (2011) Cushing, M. C., Kirkpatrick, J. D., Gelino, C. R., et al. 2011, ApJ, 743, 50
- Delorme et al. (2008) Delorme, P., Delfosse, X., Albert, L., et al. 2008, A&A, 482, 961
- Dupuy & Kraus (2013) Dupuy, T. J., & Kraus, A. L. 2013, Science, 341, 1492
- Dupuy & Liu (2011) Dupuy, T. J., & Liu, M. C. 2011, ApJ, 733, 122
- Dupuy & Liu (2012) —. 2012, ApJS, 201, 19
- Dupuy et al. (2009a) Dupuy, T. J., Liu, M. C., & Bowler, B. P. 2009a, ApJ, 706, 328
- Dupuy et al. (2010) Dupuy, T. J., Liu, M. C., Bowler, B. P., et al. 2010, ApJ, 721, 1725
- Dupuy et al. (2009b) Dupuy, T. J., Liu, M. C., & Ireland, M. J. 2009b, ApJ, 692, 729
- Dupuy et al. (2009c) —. 2009c, ApJ, 699, 168
- Elias et al. (2006) Elias, J. H., Joyce, R. R., Liang, M., et al. 2006, in Society of Photo-Optical Instrumentation Engineers (SPIE) Conference Series, Vol. 6269
- Gelino et al. (2011) Gelino, C. R., Kirkpatrick, J. D., Cushing, M. C., et al. 2011, AJ, 142, 57
- Hodapp et al. (2003) Hodapp, K. W., Jensen, J. B., Irwin, E. M., et al. 2003, PASP, 115, 1388
- Kirkpatrick et al. (2011) Kirkpatrick, J. D., Cushing, M. C., Gelino, C. R., et al. 2011, ApJS, 197, 19
- Kirkpatrick et al. (2012) Kirkpatrick, J. D., Gelino, C. R., Cushing, M. C., et al. 2012, ApJ, 753, 156
- Leggett et al. (2014a) Leggett, S. K., Liu, M. C., Dupuy, T. J., et al. 2014a, ApJ, 780, 62
- Leggett et al. (2007) Leggett, S. K., Marley, M. S., Freedman, R., et al. 2007, ApJ, 667, 537
- Leggett et al. (2014b) Leggett, S. K., Morley, C. V., Marley, M. S., & Saumon, D. 2014b, ArXiv e-prints, arXiv:1411.2020 [astro-ph.SR]
- Leggett et al. (2013) Leggett, S. K., Morley, C. V., Marley, M. S., et al. 2013, ApJ, 763, 130
- Leggett et al. (2012) Leggett, S. K., Saumon, D., Marley, M. S., et al. 2012, ApJ, 748, 74
- Liu et al. (2012) Liu, M. C., Dupuy, T. J., Bowler, B. P., Leggett, S. K., & Best, W. M. J. 2012, ApJ, 758, 57
- Liu et al. (2008) Liu, M. C., Dupuy, T. J., & Ireland, M. J. 2008, ApJ, 689, 436
- Liu et al. (2007) Liu, M. C., Leggett, S. K., & Chiu, K. 2007, ApJ, 660, 1507
- Liu et al. (2011) Liu, M. C., Delorme, P., Dupuy, T. J., et al. 2011, ApJ, 740, 108
- Lodieu et al. (2013) Lodieu, N., Béjar, V. J. S., & Rebolo, R. 2013, A&A, 550, L2
- Luhman (2014) Luhman, K. L. 2014, ApJ, 786, L18
- Luhman et al. (2011) Luhman, K. L., Burgasser, A. J., & Bochanski, J. J. 2011, ApJ, 730, L9
- Luhman & Esplin (2014) Luhman, K. L., & Esplin, T. L. 2014, ApJ, 796, 6
- Mace et al. (2013a) Mace, G. N., Kirkpatrick, J. D., Cushing, M. C., et al. 2013a, ApJS, 205, 6
- Mace et al. (2013b) —. 2013b, ApJ, 777, 36
- Montet et al. (2014) Montet, B. T., Johnson, J. A., Muirhead, P. S., et al. 2014, ArXiv e-prints, arXiv:1411.4047 [astro-ph.SR]
- Morley et al. (2014) Morley, C. V., Marley, M. S., Fortney, J. J., et al. 2014, ApJ, 787, 78
- Pinfield et al. (2014) Pinfield, D. J., Gromadzki, M., Leggett, S. K., et al. 2014, MNRAS, 444, 1931
- Saumon & Marley (2008) Saumon, D., & Marley, M. S. 2008, ApJ, 689, 1327
- Tinney et al. (2014) Tinney, C. G., Faherty, J. K., Kirkpatrick, J. D., et al. 2014, ApJ, 796, 39
- van Dam et al. (2006) van Dam, M. A., et al. 2006, PASP, 118, 310
- Warren et al. (2007) Warren, S. J., Mortlock, D. J., Leggett, S. K., et al. 2007, MNRAS, 381, 1400
- Wizinowich et al. (2006) Wizinowich, P. L., et al. 2006, PASP, 118, 297
- Wright et al. (2013) Wright, E. L., Skrutskie, M. F., Kirkpatrick, J. D., et al. 2013, AJ, 145, 84
- Yelda et al. (2010) Yelda, S., Lu, J. R., Ghez, A. M., et al. 2010, ApJ, 725, 331
| Date | Airmass | Filter | FWHM | P.A. | ||
|---|---|---|---|---|---|---|
| (UT) | (mas) | (mas) | (∘) | (mag) | ||
| 2012 Sep 7 | 1.084 | |||||
| 2012 Sep 7 | 1.118 | |||||
| 2012 Sep 7 | 1.091 | |||||
| 2012 Sep 7 | mean | |||||
| 2012 Oct 8 | 1.093 | |||||
| 2012 Oct 8 | 1.236 | |||||
| 2012 Oct 8 | 1.198 | |||||
| 2012 Oct 8 | 1.129 | |||||
| 2012 Oct 8 | mean | |||||
| 2013 Oct 22 | 1.098 |
Note. — All photometry on the MKO photometric system. The identical -band flux ratios are not a typo.
| Filter | Photometry | Date | |
|---|---|---|---|
| (s) | (mag) | (UT) | |
| 2013 Jan 10 | |||
| 2013 Jan 10 | |||
| 2013 Jan 10 | |||
| 2013 Jan 12 | |||
| aaGiven the very low signal-to-noise ratio at band, we suspect our photometric errors in this filter may be underestimated. | 2013 Jan 10 |
| Spectral | WISE J0146+4234AB | Average Median-Flux Values from Mace et al. (2013a) | Best-match | |||||
|---|---|---|---|---|---|---|---|---|
| Index | T8.5 | T9 | T9.5 | Y0 | Spec. Type | |||
| WJ | T9 | |||||||
| -narrow | T9 | |||||||
| CH | T9.5 | |||||||
| CH | T8.5 | |||||||
| NH | T9.5 | |||||||
| -wing | aaThese are the values for the spectral standards UGPS J07220540 (T9) and WISE J1738+2732 (Y0) reported by Pinfield et al. (2014) who originally defined this index. | aaThese are the values for the spectral standards UGPS J07220540 (T9) and WISE J1738+2732 (Y0) reported by Pinfield et al. (2014) who originally defined this index. | T9 | |||||
Note. — All spectral indices except -wing are described in Mace et al. (2013a). We exclude the indices H and H as they are both saturated, i.e., have zero flux in the numerator, for WISE J0146+4234AB.
| Property | Component A | Component B |
|---|---|---|
| Measured | ||
| SeparationaaWeighted average of measurements in different filters at epoch 2012 Sep 7 UT. | ||
| P.A.aaWeighted average of measurements in different filters at epoch 2012 Sep 7 UT. | ||
| (mag) | bbWeighted average of measurements from multiple epochs. | |
| (mag) | bbWeighted average of measurements from multiple epochs. | |
| (mag) | bbWeighted average of measurements from multiple epochs. | |
| (mag) | ||
| (mag) | ||
| (mag) | ||
| (mag) | ||
| (mag) | ||
| Spectral type | T9 | Y0 |
| Estimated | ||
| (mag) | ||
| (mag) | ||
| Model-derived (Cond, Gyr) | ||
| () | ||
| Mass () | ||
| (K) | ||
| Radius () | ||
| (cgs) | ||
| Model-derived (Cond, Gyr) | ||
| () | ||
| Mass () | ||
| (K) | ||
| Radius () | ||
| (cgs) | ||