On the Global Mass Distribution in Disk Galaxies
Abstract
We present a summary of recent assessments of the mass distribution in disk galaxies. Of issue in order to characterise galaxy formation models is to determine the relative fraction of baryons and dark matter at all radii in galaxies. For disk galaxies, various measurements of the mass distribution in galaxies based on vertical kinematics, strong lensing, residuals of scaling relations, fluid dynamical modeling, bar strength and pattern speed, warps, and others, have called for either a maximal or sub-maximal contribution of the baryons in the inner parts of the disk. We propose a global picture whereby all galaxies are typically baryon-dominated (maximal) at the center and dark-matter dominated (sub-maximal) in their outskirts. Using as a fiducial radius the peak of the rotation curve of a pure baryonic exponential disk at , where is the disk scale length, the transition from maximal to sub-maximal baryons occurs within or near for low-mass disk galaxies (with km s-1) and beyond for more massive systems. The mass fraction’s inverse dependence on circular velocity in disk galaxies is largely insensitive to the presence of a bar at . The mean mass fractions of late- and early-type galaxies are shown to be different at the same fiducial radius and circular velocity, pointing to different galaxy formation mechanisms. Feedback, dynamical friction, size, and IMF variations are key ingredients for understanding these differences.
Subject headings:
galaxies: spiral - galaxies: elliptical - galaxies: formation - dark matter1. Introduction
Ever since the first speculations about the presence of “dark matter” in galaxies (Kapteyn, 1922; Oort, 1932), astronomers have endeavored to characterize the fraction of visible to total mass at all radii in galaxies. The relative distribution of matter in galaxies ought to be one of the most definitive predictions of galaxy formation models yet its validation is challenged by numerous observational, theoretical, and operational challenges. While galaxies are believed to be dominated by an invisible matter component in their outskirts, a debate has been blazing for the last two decades regarding the relative fraction of baryons and dark matter in the inner parts of galaxies: whether galaxies are centrally dominated by baryons (“maximal disk”) is of issue. Some of those debates have been misconstrued on account of operational confusion, such as dark matter fractions being measured and compared at different radii. An ultimate goal for galaxy structure studies is to achieve accurate data-model comparisons for the relative fractions of baryonic to total matter at any radius.
In this Letter, we wish to provide a global appreciation of the mass distribution of baryons and dark matter in disk galaxies by combining various reports of the baryon velocity fraction, in disk galaxies, where is the inferred circular velocity ascribed to the baryonic material and is the total measured circular velocity at a given radius. is typically inferred by multiplying a galaxy light profile, , by a suitable mass-to-light ratio, . Any difference between and is viewed as a signature for the presence of dark matter. The dark matter fraction is defined as , where and are the dark matter and total mass enclosed within radius , respectively. The approximation becomes an equality for spherical systems.
How galaxies ultimately arrange their baryonic and non-baryonic matter is the result of numerous complex mechanisms involving their mass accretion history, the depth of the potential well, the initial mass function (which ultimately affects feedback and quenching processes), dynamical friction, dynamical instabilities, and more. Analytical models of galaxy formation strive to predict (Dalcanton et al., 1997; Dutton et al., 2007; Mo et al., 2010) with mitigated success in light of the above challenges; numerical simulations suffer additional limitations too.
Can observations provide unique determinations of as ideal constraints to galaxy formation models? Not yet, but, after decades of muddled debates and incomplete data, a clear picture seems to be emerging.
2. Mass Fraction Assessment
Mass models of disk galaxies, where the observed rotation curve is decomposed into its principal gas, stars, and dark matter components, have historically been embraced as the ideal method to separate baryons and dark matter as a function of radius (Bosma, 1978; Carignan & Freeman, 1985; van Albada et al., 1985). The pros and cons of this approach are addressed in the review on “Galaxy Masses” by Courteau et al. (2014). As stressed in that review (see also Dutton et al., 2005), fundamental degeneracies between the disk and dark halo models prevent a unique baryon/dark matter decomposition based on rotation curve data alone. Other information or methods must be considered to break these degeneracies.
Among others, the quantity is obtained indirectly via a stellar or baryonic mass-to-light ratio () which is itself inferred from stellar population studies or dynamical stability analysis. Current stellar population mass-to-light ratios carry an uncertainty of a factor 2 at best (Conroy, 2013; Courteau et al., 2014). The latter uncertainty is unfortunately large enough to encompass a full range of baryon fractions at a given radius.
For reference, a maximal disk is often defined to obey
| (1) |
where is the inferred velocity of the disk (stars and gas), is the total observed velocity, and is the radius at which reaches its peak value (van Albada et al., 1985; Sackett, 1997).
In terms of dark matter fraction this criterion corresponds to .
2.1. Tully-Fisher residuals
To circumvent the loopholes of mass modeling, Courteau & Rix (1999) observed that the residuals of the velocity-luminosity relation, , contrasted against those of the size-luminosity relation, , can provide a tighter constraints on measured at .
It can be easily shown that for baryon dominated galaxies (Courteau & Rix, 1999) and for dark matter dominated galaxies. Numerous scaling relation analyses of spiral galaxies have found that (Courteau & Rix, 1999; Courteau et al., 2007; Dutton et al., 2007; Reyes et al., 2011). The null slope indicates that both baryons and dark matter contribute to the galaxy dynamics at . Various galaxy structure models whereby the dark matter is compressed adiabatically by the cooling baryons as the galaxy stabilizes dynamically yield a mapping between and the baryon fraction (see references above). These models yield, on average for bright spiral galaxies, . The lower value applies if only adiabatic contraction is at play; a higher value is found if other mechanisms (e.g. feedback) oppose the adiabatic contraction (Courteau & Rix, 1999; Dutton et al., 2007). By virtue of Eq. (1) above, typical galaxy disks are thus, on average, sub-maximal at . Since mass scale as , the dark matter fraction, . Reyes et al. (2011) suggested that is controlled by the surface density of the baryonic material; i.e. if the latter is high, so is (see also Fig. 23 in Bovy & Rix, 2013).
2.2. Vertical Disk Kinematics
A similar result is obtained via the “velocity dispersion” method of (van der Kruit, 1988), as applied by many for a full suite of disk galaxies (Bottema, 1993), edge-on systems (Kregel et al., 2005), or face-on spiral galaxies (Bershady et al., 2011; Martinsson et al., 2013). For a self-gravitating, radially exponential disk with vertical profile of the form , van der Kruit (1988) and Bottema (1993) showed that the peak circular velocity of the stellar disk, , measured at can be related to the vertical velocity dispersion, , and the intrinsic thickness (or scale height) of the disk, , via:
| (2) |
where (Bershady et al., 2011).
, the contribution of the baryonic disk to the total velocity where the rotation curve reaches its peak (at ), can thus be measured directly if the disk scale length, , the scale height, , and the vertical component of the velocity dispersion, , are known. For face-on systems, and can be measured but must be inferred; and vice versa for edge-ons. Van der Kruit’s method is thus statistical in nature and relies on a number of (potentially noisy) scaling transformations. Bovy & Rix (2013) also point out that the velocity dispersions measured from integrated light, as in most applications of Eq. (2) for external galaxies so far, do not trace the older, dynamically-relaxed stellar populations with high fidelity. The younger, brighter, stellar populations traced by the light-weighted spectra tend to have a lower velocity dispersion therefore biasing low and thus favoring sub-maximal disks. Sample selection also plays a substantial role (see Fig. 1 below).
The DiskMass project has made use of van der Kruit’s formalism to extract for a sample of 46 nearly face-on (inclinations degrees) galaxies with rotation velocities between 100 km s-1 and 250 km s-1(Bershady et al., 2011). This survey uses integral-field spectroscopy to measure stellar and gas kinematics using the custom-built SparsePak and PPAK instruments. For 30 DiskMass galaxies covering a range of structural properties, Martinsson et al. (2013) report that the fraction ranges from 0.34 to 0.73 and increases with luminosity, surface brightness, rotation speed, and redder color. The average value of their sample is , in agreement with Courteau & Rix (1999).
2.3. Other methods
Similar and broader results have been achieved through very different techniques for disk dominated systems: such as fluid dynamical modeling (Weiner et al., 2001; Kranz et al., 2003; Athanassoula, 2014, see the latter reference for a more critical outlook) and strong gravitational lensing (Barnabè et al., 2012; Dutton et al., 2013a). For instance, because gravitational lensing is sensitive to projected mass while dynamics trace the mass within ellipsoids, their combination provides additional geometrical dimensions to disentangle the baryons and dark matter in galaxies; this approach is especially efficient for highly-inclined disk galaxies (Dutton et al., 2011b). These methods, reviewed in Courteau et al. (2014), are consistent on average with , but also show a broad range of as a function of maximum circular velocity or disk size. In their hydrodynamical modeling of five grand design non-barred galaxies, Kranz et al. (2003) presciently suggested that galaxy disks appear to be maximal if km s-1, sub-maximal otherwise. The later summarizes rather well the more complete picture about the mass distribution in galaxies that is now clearly emerging.
3. A unified view
Fig. 1 is a compilation of dark matter fractions, , at for various galaxy samples discussed above (others are discussed below), as a function of total circular velocity.
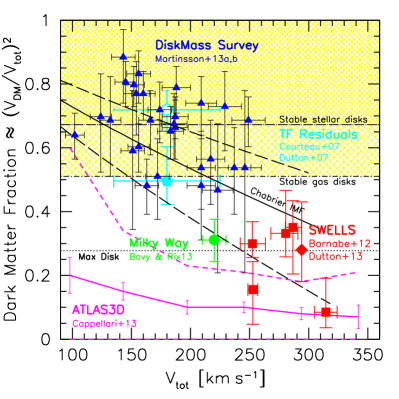
The DiskMass survey (blue points) predominantly samples large-to-average size galaxies thus avoiding the regime of disk maximality (at ). The cyan pentagons represent the parameter space for the Tully-Fisher residual analysis of the Courteau et al. (2007) sample of spiral galaxies with (open pentagon) and without (filled pentagon) adiabatic contraction (Dutton et al., 2007). The Courteau and DiskMass samples target essentially the same sub-maximal galaxy types. Unlike those samples, the SWELLS gravitational lensing survey is intrinsically biased towards high mass systems (Barnabè et al., 2012; Dutton et al., 2013a). The Milky Way study of Bovy & Rix (2013) uses a method similar to that of van der Kruit (1988) but with the added benefit that stellar populations can be disentangled, thus providing less biased measurements of the true underlying structure (scale length, rotation and dispersion) of the dynamical tracer. Their analysis results in a low mass-weighted disk scale length, kpc, and a correspondingly low estimate of at 2.2111Various investigations of the Milky Way mass density profiles are reported in Table 1 of Courteau et al. (2014). The early studies of Dehnen & Binney (1998) and Englmaier & Gerhard (1999) already pointed to a maximal MW disk. Measurements of for the Milky Way hinge significantly on estimates of its disk scale length. A low estimate of yields a high value of (or )..
The short-dash boundary delineates the region where baryon-heavy disk galaxies become disk unstable. The criterion for stability against a bar is 1.1 (Efstathiou et al., 1982; Foyle et al., 2008). The yellow shading shows the stability criteria for stellar () and gaseous () disks. Barred and unbarred galaxies have also been shown to have the same velocity-luminosity and size-luminosity scaling relations (measured at ) (Courteau et al., 2003; Sheth et al., 2012). Thus, in a global dynamical sense, barred and unbarred galaxies behave similarly and have, on average, comparable fractions of luminous and dark matter at a given radius.
The black lines in Fig. 1 show a toy model where we have used the observed scaling relations (Courteau et al., 2007; Dutton et al., 2011a) between disk scale length, rotation velocity and stellar mass (assuming a Chabrier IMF) to estimate the dark matter fraction, assuming the baryonic mass is dominated by an exponential stellar disk (i.e., gas and stellar bulges are ignored). The dashed lines show the effect of changing the disk sizes by dex (the scatter in the size-velocity relation). Changing the stellar masses (e.g., by changing the IMF) by the same amounts leads to similar changes in dark matter fractions. This simple model captures the main features of the observations:
-
1.
Dark matter fraction decreases with galaxy circular velocity;
-
2.
Milky Way mass galaxies ( km s-1) have, on average at , ; and
-
3.
There is significant scatter in dark matter fractions at a given circular velocity driven, at least partly, by size variations.
3.1. Early-Type Galaxies
Measuring dark matter fractions in early-type galaxies is more challenging. Firstly, because measuring total mass profiles is subject to the mass-anisotropy degeneracy, which requires high-quality data to break. Secondly, because there are no direct dynamical means of separating the total mass into baryons and dark matter. Observations of dark matter fractions in early-type galaxies are thus driven by systematics in the mass modeling assumptions, such as dark matter profile, and stellar M/L gradients.
Fig. 1 also shows the distribution of 260 ATLAS3D early-type galaxies (Cappellari et al., 2013), where we have used to transform velocity dispersions, , to circular velocity (Dutton et al., 2011b). An important caveat to these results is the assumption of an NFW dark matter halo (Navarro, Frenk, & White 1997) in the mass modelling. Dark matter fractions as high as are obtained if dark matter haloes contract adiabatically in response to galaxy formation (Dutton et al., 2013b). Note also that ATLAS3D velocity maps do not typically extend beyond 1-1.3 Re, the regime reported for LTG in measuring V2.2. Therefore, the data for ETGs presented in Fig. 1 are likely lower limits; still, the latter probe ETG dynamics in a regime of maximal ‘baryons”.
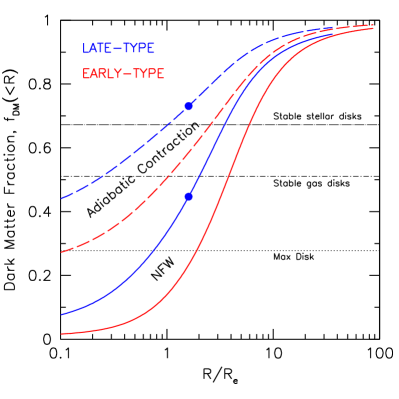
Fig. 2 shows dark matter fractions vs radius for CDM based models of early and late-type galaxies with circular velocity from Dutton et al. (2011a). This shows that for a given halo response, early-type galaxies have lower dark matter fractions than late-type galaxies. These differences are driven by both size (early-types are smaller) and IMF (early-types have heavier IMFs) variations.
4. Future Outlook
The trends observed in Fig. 1 and the characterization of baryon-DM transitions in galaxies over a range of Hubble types are significant constraints that galaxy formation models have yet to uniquely predict (e.g. Fig. 2). This is partly due to additional complications such as the degeneracy between the baryon or dark matter fractions, the stellar initial mass function, adiabatic contraction, and various counter-acting non-gravitational agents such as feedback and dynamical friction (Dutton et al., 2011a; Trujillo-Gomez et al., 2011; Oguri et al., 2014). The advent of new extensive dynamical models of galaxies based on wide-field integral field surveys, such as CALIFA, MaNGA, SAMI (out to ) and SLUGGS (reaching ) heralds a promising future for mapping the mass distributions at all radii in galaxies. Model dependencies and biases could at least be partially offset with reduced sampling errors.
Acknowledgments
S.C. acknowledges support from the Natural Science and Engineering Research Council of Canada through a generous Research Discovery Grant. He is also grateful to the Instituto de Astrofísica de Canarias for their hospitality while this paper was being written. A.A.D. acknowledges support from the Sonder-forschungsbereich SFB 881 “The Milky Way System” (subproject A1) of the German Research Foundation (DFG).
References
- Athanassoula (2014) Athanassoula, E. 2014, MNRAS, 438, L81
- Barnabè et al. (2012) Barnabè, M., Dutton, A. A., Marshall, P. J., et al. 2012, MNRAS, 423, 1073
- Bershady et al. (2011) Bershady, M. A., Martinsson, T. P. K., Verheijen, M. A. W., et al. 2011, ApJ, 739, LL47
- Bosma (1978) Bosma, A. 1978, “The distribution and kinematics of neutral hydrogen in spiral galaxies of various morphological types,” Ph.D. thesis (University of Groningen).
- Bottema (1993) Bottema, R. 1993, A&A, 275, 16
- Bovy & Rix (2013) Bovy, J., & Rix, H.-W. 2013, ApJ, 779, 115
- Cappellari et al. (2013) Cappellari, M., McDermid, R. M., Alatalo, K., et al. 2013, MNRAS, 432, 1862
- Carignan & Freeman (1985) Carignan, C., & Freeman, K. C. 1985, ApJ, 294, 494
- Conroy (2013) Conroy, C. 2013, ARA&A, 51, 393
- Courteau et al. (2014) Courteau, S., Cappellari, M., de Jong, R. S., et al. 2014, Reviews of Modern Physics, 86, 47
- Courteau et al. (2007) Courteau, S., Dutton, A. A., van den Bosch, F. C., et al. 2007, ApJ, 671, 203
- Courteau et al. (2003) Courteau, S., Andersen, D. R., Bershady, M. A., MacArthur, L. A., & Rix, H.-W. 2003, ApJ, 594, 208
- Courteau & Rix (1999) Courteau, S., & Rix, H.-W. 1999, ApJ, 513, 561
- Dalcanton et al. (1997) Dalcanton, J. J., Spergel, D. N., & Summers, F. J. 1997, ApJ, 482, 659
- Dehnen & Binney (1998) Dehnen, W., & Binney, J. 1998, MNRAS, 294, 429
- Dutton (2014) Dutton, A. A., in “Galaxy Masses as Constraints of Formation Models”, Proceedings IAU Symposium No. 311, 2014 M. Cappellari & S. Courteau, eds.
- Dutton et al. (2013b) Dutton, A. A., Macciò, A. V., Mendel, J. T., & Simard, L. 2013b, MNRAS, 432, 2496
- Dutton et al. (2013a) Dutton, A. A., Treu, T., Brewer, B. J., et al. 2013a, MNRAS, 428, 3183
- Dutton et al. (2011b) Dutton, A. A., Brewer, B. J., Marshall, P. J., et al. 2011b, MNRAS, 417, 1621
- Dutton et al. (2011a) Dutton, A. A., Conroy, C., van den Bosch, F. C., et al. 2011a, MNRAS, 416, 322
- Dutton et al. (2007) Dutton, A. A., van den Bosch, F. C., Dekel, A., & Courteau, S. 2007, ApJ, 654, 27
- Dutton et al. (2005) Dutton, A. A., Courteau, S., de Jong, R., & Carignan, C. 2005, ApJ, 619, 218
- Efstathiou et al. (1982) Efstathiou, G., Lake, G., & Negroponte, J. 1982, MNRAS, 199, 1069
- Englmaier & Gerhard (1999) Englmaier, P., & Gerhard, O. 1999, MNRAS, 304, 512
- Foyle et al. (2008) Foyle, K., Courteau, S., & Thacker, R. J. 2008, MNRAS, 386, 1821
- Kapteyn (1922) Kapteyn, J. C. 1922, ApJ, 55, 302
- Kranz et al. (2003) Kranz, T., Slyz, A., & Rix, H.-W. 2003, ApJ, 586, 143
- Kregel et al. (2005) Kregel, M., van der Kruit, P. C., & Freeman, K. C. 2005, MNRAS, 358, 503
- Macciò et al. (2008) Macciò, A. V., Dutton, A. A., & van den Bosch, F. C. 2008, MNRAS, 391, 1940
- Martinsson et al. (2013) Martinsson, T. P. K., Verheijen, M. A. W., Westfall, K. B., et al. 2013, A&A, 557, AA131
- Mo et al. (2010) Mo, H., van den Bosch, F. C., & White, S. 2010, Galaxy Formation and Evolution, by Houjun Mo , Frank van den Bosch , Simon White, Cambridge, UK: Cambridge University Press, 2010,
- Navarro et al. (1997) Navarro J. F., Frenk C. S., White S. D. M. 1997, ApJ, 490, 493
- Oguri et al. (2014) Oguri, M., Rusu, C. E., & Falco, E. E. 2014, MNRAS, 439, 2494
- Oort (1932) Oort, J. H. 1932, Bull. Astron. Inst. Neth., 6, 249
- Reyes et al. (2011) Reyes, R., Mandelbaum, R., Gunn, J. E., Pizagno, J., & Lackner, C. N. 2011, MNRAS, 417, 2347
- Sackett (1997) Sackett, P. D. 1997, ApJ, 483, 103
- Sheth et al. (2012) Sheth, K., Melbourne, J., Elmegreen, D. M., et al. 2012, ApJ, 758, 136
- Trujillo-Gomez et al. (2011) Trujillo-Gomez, S., Klypin, A., Primack, J., & Romanowsky, A. J. 2011, ApJ, 742, 16
- van Albada et al. (1985) van Albada, T. S., Bahcall, J. N., Begeman, K., & Sancisi, R. 1985, ApJ, 295, 305
- van der Kruit & Freeman (2011) van der Kruit, P. C., & Freeman, K. C. 2011, ARA&A, 49, 301
- van der Kruit (1988) van der Kruit, P. C. 1988, A&A, 192, 117
- Weiner et al. (2001) Weiner, B. J., Sellwood, J. A., & Williams, T. B. 2001, ApJ, 546, 931