Sub-mm Jet Properties of the X-Ray Binary Swift J174526
Abstract
We present the results of our observations of the early stages of the 2012–2013 outburst of the transient black hole X-ray binary (BHXRB), Swift J174526, with the VLA, SMA, and JCMT (SCUBA–2). Our data mark the first multiple-band mm & sub-mm observations of a BHXRB. During our observations the system was in the hard accretion state producing a steady, compact jet. The unique combination of radio and mm/sub-mm data allows us to directly measure the spectral indices in and between the radio and mm/sub-mm regimes, including the first mm/sub-mm spectral index measured for a BHXRB. Spectral fitting revealed that both the mm (230 GHz) and sub-mm (350 GHz) measurements are consistent with extrapolations of an inverted power-law from contemporaneous radio data (1–30 GHz). This indicates that, as standard jet models predict, a power-law extending up to mm/sub-mm frequencies can adequately describe the spectrum, and suggests that the mechanism driving spectral inversion could be responsible for the high mm/sub-mm fluxes (compared to radio fluxes) observed in outbursting BHXRBs. While this power-law is also consistent with contemporaneous optical data, the optical data could arise from either jet emission with a jet spectral break frequency of or the combination of jet emission with a lower jet spectral break frequency of and accretion disc emission. Our analysis solidifies the importance of the mm/sub-mm regime in bridging the crucial gap between radio and IR frequencies in the jet spectrum, and justifies the need to explore this regime further.
Subject headings:
black hole physics — ISM: jets and outflows — radio continuum: stars — stars: individual (Swift J174526) — submillimeter: stars — X-rays: binaries1. Introduction
Relativistic jets are powerful, collimated outflows of energy and matter (Fender, 2010). While these jets have been studied for decades in accreting sources, the underlying physics that governs jet behaviour is still poorly understood. Despite the many unknowns, it is clear that these jets play a crucial role in the accretion process (Meier, 2001; Merloni et al., 2003; Fender et al., 2004; Falcke et al., 2004; Gallo et al., 2005b; Falcke & Biermann, 1995; Fender, 2006, 2010; Gallo, 2010; Corbel et al., 2013a; Gallo et al., 2014).
Black hole X-ray binaries (BHXRBs), which contain an accreting stellar mass black hole paired with a companion star (Remillard & McClintock, 2006), are ideal probes for jet phenomena because they vary on short timescales (days to months). Therefore, many different phases of jet behaviour (jet launching, fading, and quenching) can be analyzed in a single system. Additionally, BHXRBs act as analogues to more observationally inaccessible systems, such as active galactic nuclei (AGN; whose entire outbursts evolve on million-year timescales), where jet feedback is thought to play a key role in galaxy formation and evolution (Fabian, 2012).
In BHXRB systems, a compact, steady relativistic jet is present at the beginning of an outburst when the system is typically in the hard accretion state (see Fender & Belloni 2004; Fender et al. 2009; Belloni 2010 for further discussion on accretion states). Jet emission in the hard state reveals a flat to slightly inverted optically thick spectrum (; Fender 2001) extending from radio through sub-mm frequencies (possibly even up to IR frequencies; Corbel & Fender 2002a; Casella et al. 2010; Chaty et al. 2011; Russell et al. 2013b). Around the infrared frequencies, the optically thick jet spectrum breaks to an optically thin spectrum (; Russell et al. 2013b), leading to a rapidly declining flux density with increasing frequency.
Blandford & Königl (1979) were the first to propose a model for this flat/inverted jet emission, where the overall jet spectrum is generally described as the superposition of individual overlapping synchrotron components originating from different scales along the jet. Since then, many variations on this model have been proposed that address and build upon some of the simplifying assumptions of the Blandford & Königl (1979) model (e.g., Hjellming & Johnson, 1988; Falcke & Biermann, 1995; Markoff et al., 2001, 2005; Kaiser, 2006; Pe’er & Casella, 2009; Malzac, 2013a, b, 2014). Although many of these models successfully reproduce the observed jet spectra, they are still limited in describing the main properties and processes within the jet. These detailed jet properties are encoded within the jet spectral energy distribution (SED, e.g., Heinz & Sunyaev 2003; Markoff et al. 2003; Heinz & Grimm 2005; Markoff et al. 2005; Casella & Pe’er 2009; Pe’er & Casella 2009). Thus, high quality, well-sampled broadband observations are key in overcoming these challenges.
Given that jet emission is predicted to dominate over other system components (accretion disc and companion star) at frequencies below the near-IR band during the hard state (Russell et al., 2006), the mm/sub-mm regime is crucial to our understanding of the jet. Currently only a handful of detections of outbursting BHXRBs exist in the mm/sub-mm regime (Fender et al., 2000; Fender & Pooley, 2000; Ogley et al., 2000; Paredes et al., 2000; Fender et al., 2001; Russell et al., 2013a; van der Horst et al., 2013; Russell et al., 2014). However, recent upgrades to such instruments as the Submillimeter Array (SMA) and the Submillimetre Common User Bolometer Array 2 on the James Clerk Maxwell Telescope (SCUBA–2 on the JCMT), as well as the introduction of new instruments such as the Atacama Large Millimetre Array (ALMA) are enabling more detections of these sources with flux densities on the order of a mJy (or even as low as tens of with ALMA).
With mm/sub-mm data we are able to fill in a gap of orders of magnitude in frequency in our broadband coverage. This is especially important when attempting to constrain the location of the spectral break, which is postulated to mark the location where particles are first accelerated to a power-law distribution in the jet (Markoff et al., 2001, 2005; Polko et al., 2010, 2013, 2014). Additionally, the flux and frequency of this spectral break can reveal insights into universal jet properties, such as minimum radiative jet power, key system parameters, such as accretion rate, black hole mass, radius of the inner accretion disc and magnetic field strength (Heinz & Sunyaev, 2003; Markoff et al., 2003; Heinz & Grimm, 2005; Markoff et al., 2005; Casella & Pe’er, 2009; Pe’er & Casella, 2009; Chaty et al., 2011; Pe’er & Markoff, 2012; Russell et al., 2013a), as well as uncover physical conditions in the jet, such as the base jet radius, velocity, and opening angle (Russell et al. 2013a, b; Russell et al. 2014). However, the break has only been directly detected in three black hole sources, GX 339–4 (Corbel & Fender, 2002b; Gandhi et al., 2011), MAXI J1659152 (van der Horst et al., 2013), and V 404 Cyg (additionally in this source the radio–IR spectrum was curved, requiring a second break in the flat/inverted spectral regime; Russell et al. 2013b), and indirectly constrained111Observing the spectral break indirectly refers to estimating the spectral break frequency by interpolating between the radio and IR-optical power-laws (through the unknown mm/sub-mm regime) as opposed to directly observing the spectral break within the data. in other black hole sources. Most recently Russell et al. (2013b) presented indirect jet break constraints for a large sample of sources, and similar results are available for Cyg X1 (Rahoui et al., 2011; Nowak et al., 2005), and MAXI J1836194 (Russell et al. 2013c; Russell et al. 2014). This indirect interpolation process introduces significant uncertainties in the derived location of the break (up to an order of magnitude in MAXI J1836-194; Russell et al. 2013c) and requires that the radio–sub-mm spectrum can be accurately represented by a single power-law. Data in the mm/sub-mm part of the spectrum allow us to make direct spectral measurements intermediate between radio frequencies and the spectral break, mitigating the uncertainties that come with interpolation and testing this single radio–sub-mm power-law assumption.
Recent results from observing campaigns of the BHXRB sources MAXI J1836–194 and MAXI J1659–152 show evolving SEDs, suggesting an evolving jet break that appears to tend toward lower radio frequencies as the accretion rate increases, and the compact jet begins to switch off during the transition to softer states at the peak of the outburst (Russell et al., 2013c; van der Horst et al., 2013; Russell et al., 2014). Additionally, Corbel et al. (2013b) found that the jet break in GX 339–4 evolved as the jets switched back on in the reverse state transition. With mm/sub-mm data we can directly track the evolution of the break through mm/sub-mm frequencies and down to the radio band. Tracking the break could allow us to correlate the changing break frequency with accretion properties, such as X-ray hardness (Russell et al. 2014 find tentative evidence that the break frequency may correlate with X-ray hardness in MAXI J1836–194), which is essential in understanding what physical processes are driving changes within the jet.
Although mm/sub-mm observations of BHXRBs are sparse, the few mm/sub-mm detections of BHXRBs to date in the literature (e.g., Fender et al. 2001; Russell et al. 2013a) have measured considerably higher flux densities than seen at radio frequencies (). These high mm/sub-mm fluxes could be “anomalous”, in which the excess emission (above that of a flat spectrum extending across radio frequencies) at mm/sub-mm frequencies was produced by a yet unknown process not included in standard jet models (e.g., see Markoff et al. 2001). On the other hand, high mm/sub-mm fluxes could be the result of a more inverted (rather than flat) radio through sub-mm spectrum (e.g., inverted radio through IR spectra have been observed in V404 Cyg; Gallo et al. 2005a; Hynes et al. 2009, A0620–00; Gallo et al. 2007, and XTE J1118480; Fender et al. 2001). Therefore, it is essential to first understand the origin of the mm/sub-mm flux in BHXRBs before dynamic broad-band SEDs can be used to constrain jet properties.
1.1. Swift J174526
Swift J174510.8-262411 (also known as Swift J174526) is a transient black hole candidate (Vovk et al., 2012) source discovered in the Galactic centre region () by NASA-led Swift Burst Alert Telescope (BAT; ) on 2012 September 16 (Cummings et al., 2012a). An X-ray counterpart was confirmed in the hard X-rays () by the X-ray telescope (XRT) on the Swift satellite on 2012 September 17 (Cummings et al., 2012b; Sbarufatti et al., 2012). X-ray spectral and timing observations from Swift and the International Gamma-Ray Astrophysics Laboratory (INTEGRAL) were used to classify this source as a low mass X-ray binary (LMXB) black hole candidate system (White et al., 1995). In addition, this outburst was classified as “failed” (Belloni et al., 2012; Sbarufatti et al., 2013), as it did not reach the soft state (see Brocksopp et al. 2004 for further discussion on failed outbursts). A radio detection was made on 2012 September 17–18 with the Karl G. Jansky Very Large Array (VLA) in the 5.0 and 7.45 GHz bands of and , respectively, suggesting that the emission likely originated from a partially self-absorbed compact jet (; Miller-Jones et al. 2012). Follow-up radio observations with the Australia Telescope Compact Array (ATCA) confirmed the presence of a partially self-absorbed compact jet (; Corbel et al. 2012). Further, Curran et al. (2014) performed a detailed radio frequency study of the entire outburst and Kalemci et al. (2014) analyzed the decay of the outburst at X-ray, optical, and radio frequencies. The source outburst ended approximately 2013 June 20, when it could no longer be detected by Swift BAT.
Between 2012 September 20 and 2012 September 26 (i.e., early in the outburst), we obtained quasi-simultaneous radio and multiple band mm & sub-mm observations of the source, combining data from the VLA, SMA, and JCMT SCUBA–2. These data afford us the unique opportunity to directly measure the spectral indices in and between the radio and mm/sub-mm regimes. In §2 we describe the data collection and reduction processes for the SMA, JCMT SCUBA–2, and VLA. In §3 we present the radio through sub-mm spectrum, outline the spectral fitting process, and show the results of the spectral fits. §4 contains an interpretation of the spectral behaviour presented in §3, as well as a discussion on the origin of high mm/sub-mm fluxes and variability at radio frequencies. A summary of the results is presented in §5.
2. Observations and Data Analysis
2.1. SMA
SMA observations (Project Code: 2012A-S055) of Swift J174526 were taken on three nights at 230 GHz (see Table 1). The very extended array configuration was used with a total of 5 antennas on September 20th, and 7 antennas on September 22nd and 25th (out of a possible 8 antennas). All observations were made in double bandwidth mode (single receiver, 4 GHz bandwidth) and with precipitable water vapour measurements of on September 20, 22, and 25 respectively. We used 1924-292 and 3C84 as bandpass calibrators, 1924-292 and NRAO 530 as gain calibrators, and Neptune as a flux calibrator222The SMA calibrator list can be found at http://sma1.sma.hawaii.edu/callist/callist.html.. Data were reduced in the Common Astronomy Software Application (CASA; McMullin et al. 2007) using standard procedures outlined in the Casaguides for SMA data reduction. Currently, CASA is unable to handle SMA data in its original format; therefore the SMA scripts, sma2casa.py and smaImportFix.py were used to convert the data into CASA MS format and perform the correction333Links to the SMA Casaguides and these scripts are publicly available at www.cfa.harvard.edu/sma/casa.. On September 20 poor weather conditions, the limited number of antennas, and phase de-correlation led to overall poor quality data that prevented us from placing any constraints on source brightness. Swift J174526 was significantly detected on both the 22nd and 25th, and careful phase self-calibration, ensuring we obtained smoothly varying solutions with time, was used to correct for any phase de-correlation that occurred on these nights. All Swift J174526 flux densities, as measured by fitting a point source in the image plane with imfit in CASA, are presented in Table 1444Note that difmap was also used to model fit the visibilities in the uv-plane rather than the image plane. All flux density values obtained from fitting in the uv-plane were consistent with those found from fitting in the image plane..
2.2. JCMT SCUBA–2
JCMT observations (Project Code: M12BC25) of Swift J1745-26 were taken on the night of 2012 September 21 in the band (352.697 GHz). Two observations spaced approximately 45 minutes apart were obtained with the SCUBA–2 detector (Chapin et al., 2013; Holland et al., 2013). Observations of the flux calibrators (Dempsey et al., 2012) Uranus, CRL618, and CRL2688 were present but we chose to use CRL2688 as it was closest in both time and space to our target source. The daisy configuration was used, producing a 3 arcmin map. During the observations we were in the Grade 2 weather band with a 225 GHz opacity of 0.07-0.08. Data were reduced in the Starlink package using standard procedures outlined in the SCUBA–2 cookbook and the SCUBA–2 Quick Guide555www.jach.hawaii.edu/JCMT/continuum/scuba2/
scuba2_quickguide.html.
We had minutes on source per observation for a total time of minutes on source.
The Swift J174526 flux density values calculated for each observation as well as the co-added observations are listed in Table 1, where the uncertainty in the flux density measurements include a substantial contribution from the uncertainty in the flux conversion factor (FCF). Note that data in the (666.205GHz) band were obtained simultaneously with the band, but the source was not significantly detected at , with an upper limit at that was not strongly constraining ().
2.3. VLA
We re-reduced the VLA data presented in Curran et al. (2014) during the epochs taken within two days of our mm/sub-mm observations (see Table 1). These radio epochs are quasi-simultaneous with our mm/sub-mm epochs, and thus represent the best opportunity to constrain the jet spectrum. The re-reduction was performed in CASA following the same flagging, calibration, and imaging procedure as Curran et al. (2014), with more up-to-date antenna positions that were not published at the time of the initial analysis. All flux densities presented include the conventional VLA systematic errors of 1% (), 3% (), and 5% (). Poor weather on September 26 meant that observations above 32 GHz suffered from complete phase de-correlation. As such, these measurements may include significant, unaccounted for errors and were not used in our analysis (further discussion is presented in §3.1).
| Date | MJD | Time on | Freq. | Flux | |
|---|---|---|---|---|---|
| (2012) | Source | (GHz) | (mJy) | ||
| (min) | |||||
| VLA | Sep 20 | 56190.09 | 10.97 | 5.0 | 17.720.25 |
| VLA | Sep 20 | 56190.09 | 10.97 | 7.5 | 17.970.22 |
| SMA | Sep 20 | 56190.12 | 186.6 | 219.2 | …11footnotemark: 1 |
| SMA | Sep 20 | 56190.12 | 186.6 | 232.6 | …11footnotemark: 1 |
| JCMT | Sep 21 | 56191.27 | 33.6 | 352.7 | 45.277.16 |
| JCMT | Sep 21 | 56191.29 | 33.6 | 352.7 | 37.237.12 |
| JCMT | Sep 21 | co-added22footnotemark: 2 | 69.6 | 352.7 | 39.855.04 |
| SMA | Sep 22 | 56192.13 | 160.0 | 219.2 | 32.101.30 |
| SMA | Sep 22 | 56192.13 | 160.0 | 232.6 | 35.321.71 |
| VLA | Sep 23 | 56193.07 | 1.99 | 5.0 | 25.830.35 |
| VLA | Sep 23 | 56193.07 | 1.99 | 7.5 | 26.190.36 |
| VLA | Sep 23 | 56193.06 | 1.99 | 20.8 | 26.781.68 |
| VLA | Sep 23 | 56193.06 | 1.99 | 25.9 | 26.731.67 |
| VLA | Sep 25 | 56195.03 | 2.49 | 5.0 | 25.820.35 |
| VLA | Sep 25 | 56195.03 | 2.49 | 7.5 | 25.260.41 |
| VLA | Sep 25 | 56195.02 | 3.99 | 20.8 | 28.351.11 |
| VLA | Sep 25 | 56195.02 | 3.99 | 25.9 | 27.901.11 |
| SMA | Sep 25 | 56195.13 | 164.4 | 219.2 | 35.111.11 |
| SMA | Sep 25 | 56195.13 | 164.4 | 232.6 | 37.831.52 |
| VLA | Sep 26 | 56196.03 | 2.49 | 1.4 | 21.830.62 |
| VLA | Sep 26 | 56196.03 | 2.49 | 1.8 | 23.580.57 |
| VLA | Sep 26 | 56196.02 | 3.99 | 31.5 | 31.311.03 |
| VLA | Sep 26 | 56196.02 | 3.99 | 37.5 | 36.461.67 |
| VLA | Sep 26 | 56196.01 | 3.99 | 41.5 | 38.863.33 |
| VLA | Sep 26 | 56196.01 | 3.99 | 47.5 | 40.983.52 |
3. Results
3.1. Light Curves and Spectrum
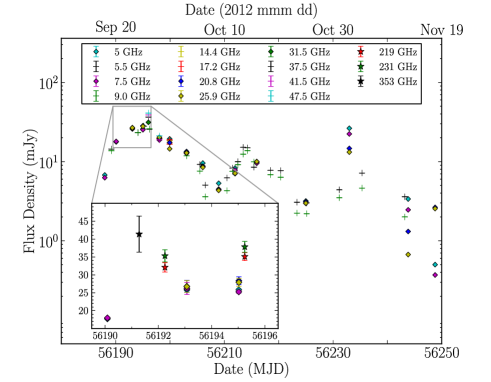
Figure 1 shows the radio frequency light curve spanning the first 60 days of the 2012-2013 outburst of Swift J174526 (Curran et al., 2014), with an inset panel that zooms in on the 6-day period at the beginning of the outburst (September 20–26) for which we have mm/sub-mm coverage.
Our observations show that, at mm/sub-mm frequencies, the source may have evolved somewhat differently than at radio frequencies, possibly even not evolving at all in the mm/sub-mm bands. At radio frequencies we see a rise in source brightness, culminating in a brightness peak at 2012 September 26 (corresponding to the peak observed radio brightness over the outburst; Curran et al. 2014). Whereas, at mm/sub-mm frequencies, while the source brightness appears to remain relatively constant over our observations, poor temporal sampling prevents us from ruling out any variability, or drawing any further conclusions on differences in temporal behaviour between the radio and mm/sub-mm regimes.
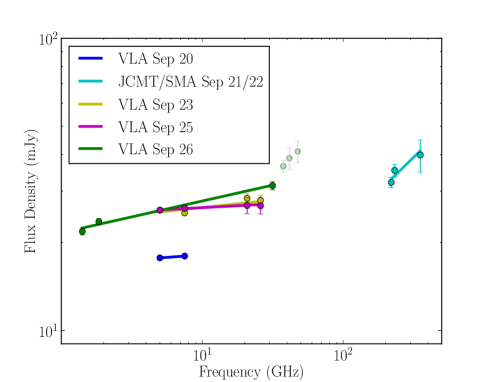
The radio–sub-mm spectrum of Swift J174526 through different epochs during its 2012–2013 outburst can be seen in Figure 2 (along with power-law fits, described in §3.2). All of the radio and mm/sub-mm flux measurements were made within days (i.e., quasi-simultaneous) of each other in an attempt to best constrain the jet spectrum. Clear flux variability is observed between epochs at radio frequencies. Additionally, a more inverted spectrum is seen at higher radio frequencies in the 2012 September 26 epoch, where we see an apparent flux increase of between (transparent green points on Figure 2). However, due to complete phase de-correlation, attempts at phase self-calibration produced solutions that are not smoothly varying with time, but look like pure noise above 32 GHz (see §2.2 above). Therefore, while the upward trend in the highest frequency data from 2012 September 26 is intriguing, it is possibly (and perhaps most likely) an artifact of the self-calibration process in the presence of unstable atmospheric conditions. We caution against over-interpreting this feature and the remainder of our analysis will not include these data points.
The source brightness at mm/sub-mm frequencies is higher than that at radio frequencies (up to a factor of ), similar to other BHXRB sources with mm/sub-mm detections (Fender et al., 2000; Fender & Pooley, 2000; Ogley et al., 2000; Fender et al., 2001; Russell et al., 2013c; van der Horst et al., 2013; Russell et al., 2014). We discuss possible causes of high mm/sub-mm fluxes further in §4.1 and §4.3 below.
3.2. Spectral Fitting in the Individual (radio & mm/sub-mm) and Global (radio through sub-mm) Regimes
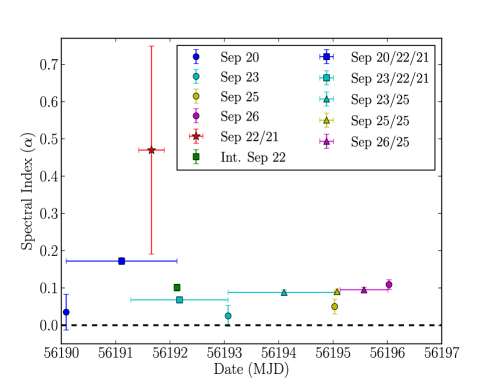
Standard jet models (Blandford & Königl, 1979) predict that a self-absorbed compact jet would produce emission that follows a single power-law from radio through sub-mm frequencies, and as such we would expect . On the other hand, while this simple jet model has been proven to match observations at radio frequencies in multiple sources, its predictions have not been tested at higher mm/sub-mm frequencies. To test these models in the mm/sub-mm regime, we chose to fit a power-law to our jet spectrum, using an affine-invariant ensemble sampler for Markov chain Monte Carlo (MCMC Foreman-Mackey et al., 2013) and the standard least squares algorithm in logarithmic space for power-law fitting to determine the best-fit and obtain accurate (1-) parameter uncertainties. Figure 2, Figure 3, and Figure 4 display various spectral fits in the individual (here a power-law was fit across radio only or mm/sub-mm only data) and global (here a constant slope power-law extending from radio through sub-mm frequencies was fit to the data) regimes for different epochs of data, Figure 5 displays all spectral indices calculated over the time period we had data, and Table 2 displays the results of all the spectral fits.
In the individual regime fits (Figure 2), both the radio and mm/sub-mm are fit reasonably well with a single power-law (low given the number of degrees of freedom). All of the epochs of radio data display a relatively flat spectral index () as expected from a simple self-absorbed jet. In the mm/sub-mm regime, the spectrum is more inverted () than at radio frequencies in both epochs, albeit this is only a result. The high level of uncertainty in this index is mainly due to the poorly constrained 350 GHz data point, in which limited time on source ( hr) led to weak limits on flux density. As a result, all spectral indices (radio and mm/sub-mm in all epochs) are consistent with each other at the confidence level.
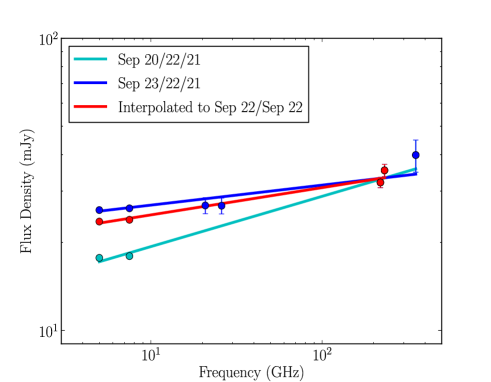
In the global regime, we once again see that the data are reasonably well fit by a power-law (e.g., Figure 3). However, it is clear that some epochs are fit better with a power-law than others (with poorer fits showing deviations from a single power-law at the level). In particular, the data sets containing the September 20 radio data show a much poorer fit than those containing the September 23 radio data, even when both data sets are paired with the same mm/sub-mm data (see Table 2). We believe that these poorer quality fits mainly result from flux variability at radio frequencies occurring between the days on which we have data, as the radio flux density was stable from September 23–25, whereas it rose significantly between September 20 and 23.
In an effort to mitigate this effect, we interpolated the radio frequency data to the days on which the SMA mm data were taken (see Fig. 4 and Table 2).
| Frequency | Figure | Data Sets | Power-Law | dof 11footnotemark: 1 | 22footnotemark: 2 | |
|---|---|---|---|---|---|---|
| Band(s) | (Color/Panel) | Fitted (2012 Sep dd) | Spectral Index () | |||
| radio | 2 (blue) | 20 | 33footnotemark: 3 | 0 | 0 | 1.00 |
| radio | 2 (magenta) | 23 | 0.06 | 2 | 0.97 | |
| radio | 2 (yellow) | 25 | 4.98 | 2 | 0.08 | |
| radio | 2 (green) | 26 | 1.68 | 1 | 0.19 | |
| mm+sub-mm | 2 (cyan) | 22+21 | 1.30 | 1 | 0.25 | |
| radio+mm+sub-mm | 4(cyan) | 20+22+21 | 11.56 | 3 | 0.01 | |
| radio+mm+sub-mm | 4(blue) & 3(left) | 23+22+21 | 6.06 | 5 | 0.30 | |
| radio+mm | … | 23+25 | 7.39 | 4 | 0.12 | |
| radio+mm | 3(right) | 25+25 | 11.37 | 4 | 0.02 | |
| radio+mm | … | 26+25 | 4.97 | 3 | 0.17 | |
| radio+mm | … | 25/26+25 | 15.57 | 7 | 0.03 | |
| radio+mm+sub-mm | 4 | interp. to 22 | 3.14 | 2 | 0.21 |
While the quality of the fits improved following interpolation, we still noticed some epochs with radio and mm data sets separated by only hours show poorer quality fits than those epochs with radio and mm data separated by days (for instance, the data sets that both contain SMA mm data from September 25, but differ in the fact that they contain VLA radio data from September 23 or September 25; see Table 2). As such we opted to take a closer look at the individual radio bands by examining data on a per sub-band basis rather than a per baseband basis.
We fit a power-law within the lower frequency radio bands using per sub-band based data (in higher frequency radio bands, , the fractional bandwidth, , is so narrow that it is not particularly useful to measure flux densities on a per sub-band basis). While all the bands follow a single power-law quite accurately as expected, surprisingly the indices within the bands do not always match the global indices across the bands (with deviations between ). As VLA data are observed sequentially (not simultaneously) in some frequencies (e.g., while 5 and 7.5 GHz are observed simultaneously, as are 21 and 26 GHz, 5 and 21 GHz are observed sequentially), this result could be suggestive of rapid variability occurring on even shorter timescales, perhaps less than our observational cadence (minutes rather than days). We discuss possible causes of the potential rapid variability further in §4.4 below.
3.3. Jet Spectral Break Constraints
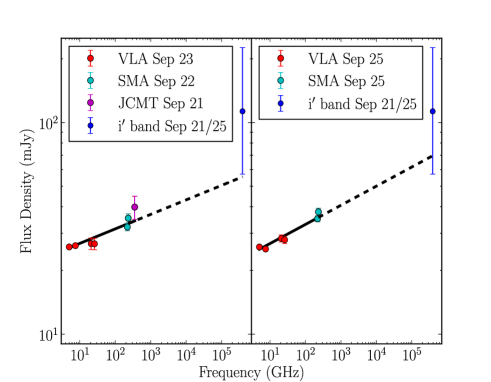
Munoz-Darias et al. (2013) present optical frequency measurements (Sloan i’, Bessel I, V & R Johnson) of Swift J174526 that are coincident with our mm/sub-mm observations. To calculate de-reddened flux densities we use the prescription in Cardelli et al. (1989), adopting the value of from Kalemci et al. (2014), which corresponds to (Guver & Ozel, 2009). This leads to large uncertainties on the de-reddened fluxes, especially for the (bluer) optical bands, that prevents us from constraining the normalization and spectral index in the optical/IR regime. Therefore, we cannot estimate the frequency of the jet spectral break through interpolation between the radio/sub-mm and optical/IR power-laws, as is typically done.
We can compare the de-reddened flux density in the i’ band () from the 2m Faulkes Telescope South (FTS) of (corresponding to the average of all i’ band observations, i’ = ) to contemporaneous radio and mm/sub-mm measurements. We find that the i’ flux density lies above the extrapolated radio–sub-mm spectrum in all our global fits (see Figure 3); however, the error of the i’ flux density allows for it to be consistent or below the extrapolated radio–sub-mm flux densities. Since high extinction prevented Munoz-Darias et al. (2013) from obtaining reliable optical/IR spectral information needed to place accurate constraints on the optical emission processes in Swift J1745-26, we consider two extreme cases for the origin of the i’flux density, emission arising completely from the jet or minimal emission arising from the jet. In the latter case, the reprocessing of X-rays in the outer accretion disc (e.g., van Paradijs & McClintock, 1995; Charles & Coe, 2006) is the dominant emission process (Russell et al., 2006).
If the i’ flux density arises entirely from jet emission, than the jet spectral break could be located either near or bluer than the i’ band. To better estimate the lower limit for the jet spectral break, we performed Monte Carlo simulations that include extrapolations to i’-band of our radio to sub-mm power-law fit (and its errors) and the fully propagated errors on the i’ flux density. When the simulated i’ flux densities were above the power-law extrapolation, we assigned a lower limit of . When the simulated i’ flux densities were below the power-law extrapolation, we assumed a canonical optically thin spectral index of (Mirabel & Rodriguez, 1999) and solved for the jet spectral break frequency. Our 99% confidence interval lower limits for the jet spectral break frequency are and for data near September 21 and September 25, respectively.
If the i’ flux density arises (almost) entirely from accretion disc processes, then that implies a significantly lower jet spectral break frequency. This assumption is not unreasonable given the high accretion disc fractions of emission in i’ band in other BHXRBs and the fact that typically in a BHXRB the radio and optical flux densities are about the same to within an order of magnitude (Russell et al., 2006). Thus, in this case, we can only constrain a lower limit on the jet spectral break frequency using the radio through sub-mm data. Given the small errors on our mm-data from the SMA and the fact that they are always above the extrapolation of the radio spectral index, this sets a lower limit to the jet spectral break at the upper side band frequency for the SMA data, . We note that if we use the same assumptions as in the above paragraph, then only of the i’ flux density needs to arise from jet emission to be consistent with this jet spectral break frequency.
4. Discussion
4.1. Interpretation of Spectral Indices
The results of our spectral fitting in the individual regimes show that the radio spectral indices are all nearly flat () as expected for a typical partially self-absorbed synchrotron jet (Fender, 2001), and similar to what has been seen in other BHXRB sources in the hard state (Russell et al. 2013b and references therein; Russell et al. 2013c; van der Horst et al. 2013). Conversely, the mm/sub-mm index appears more inverted when compared to all the radio indices.
We have to be cautious when taking this result at face value as the highly inverted mm/sub-mm index is poorly constrained due to weak limits on the flux measurement at 350 GHz. Therefore, while the data suggest conflicting spectral behaviour between radio and mm/sub-mm regimes (and in turn the possibility of changing physical conditions in the jet), the plausibility of systematic problems with the relative flux measurements (i.e., spectral indices), combined with the fact that all indices are consistent within , suggests that the discrepancy between regimes could be entirely due to the combination of systematic and statistical uncertainties.
If we compare the indices calculated with only radio measurements to the global indices containing the same radio measurements paired with the mm/sub-mm measurements (see Figure 5), the global indices are noticeably more inverted (driven higher by the bright mm/sub-mm measurements). For instance, there is a difference between the 2012 September 23 radio spectral index (Figure 2 yellow) and the radio through sub-mm index from data interpolated to 2012 September 22 (Figure 3 red). Therefore, when comparing absolute fluxes between the radio and mm/sub-mm regimes rather than relative fluxes (compare radio only and mm/sub-mm only indices), we find even stronger evidence for spectral inversion driving high mm/sub-mm fluxes in BHXRBs.
Recent work (Kaiser, 2006; Pe’er & Casella, 2009) suggests that a more inverted jet spectrum (when compared to a flat, spectrum) at radio through sub-mm frequencies could be caused by factors such as adiabatic expansion losses, high magnetic fields ( G) at the base of the jet or a more confined jet geometry. Internal energy dissipations (e.g., internal shocks) in the jet can lead to multiple acceleration episodes as particles propagate along the jet (Kaiser, 2006; Jamil et al., 2010), and thus could be an additional factor governing the observed spectral indices in this regime. Further, noticeable inversion in the radio–sub-mm spectrum can occur if the jet plasma accelerates due to the longitudinal pressure gradient, as the Doppler factor changes non-linearly farther out from the central compact object (Falcke, 1996; Falcke & Markoff, 2000; Markoff et al., 2001). The magnitude of such inversion is sensitive to many system parameters, in particular, the inclination of the system, where the inversion is more significant when the jet axis is not pointed along the line of sight (i.e., high inclinations). While this alone is not enough to explain the inversion in the Swift J174526 spectrum, it could be a contributing factor. Additionally, the acceleration profile or the presence of additional, unaccounted for cooling processes could also be factors contributing to the spectral inversion.
Similar spectral behaviour can be seen in low luminosity AGN (LLAGN; Ho 1999), such as Sgr A*, where the spectrum becomes more inverted when approaching sub-mm frequencies (i.e., the sub-mm bump; Zylka et al. 1992; Falcke et al. 1998; Melia & Falcke 2001; An et al. 2005). This sub-mm bump can be well explained by synchrotron emission (Falcke & Markoff, 2000) originating in the region near the black hole from the base of a jet (although this sub-mm emission can also be explained by particles in the inner accretion flow; Yuan et al. 2003), which in turn suggests that similar conditions (e.g., geometry) may exist in the innermost regions of LLAGN and BHXRBs. We note that while Swift J1745-26 was orders of magnitude higher in than Sgr A * during this outburst, Plotkin et al. (2015) find that the differences in jet power between quiescent and hard state systems (leading to weaker particle acceleration and a cooler more compact jet base in quiescent systems) primarily leads to changes in the optically thin part of the spectrum rather then the optically thick part to which we are referring here.
4.2. Jet Spectral Break Frequency Lower Limit
Based on the radio through optical measurements, we placed lower limits on the jet spectral break frequency of or , depending on whether the optical emission arises from an accretion disc or the jet, respectively. The former is consistent with jet spectral breaks in other BHXRBs, while the latter would be one of the highest lower limits placed on a jet spectral break in a BHXRB to date (cf Russell et al., 2013b). However, even the assumption that all the optical flux arises from jet emission does not require that Swift J174526 is an outlier among BHXRBs.
We observed Swift J174526 early in its outburst, only two to six days after its highest and hardest X-ray flux on 2012 September 18 (MJD 56188.7; Belloni et al., 2012), which corresponded to a 2–10 keV X-ray luminosity of (Munoz-Darias et al., 2013). The discovery of a high frequency near the peak hardness of an outburst would be consistent with an evolving jet break that evolves towards lower frequencies as X-ray hardness decreases (as seen in MAXI J1836–194; Russell et al. 2013a; Russell et al. 2014). In addition, the discovery of a high frequency near the peak luminosity (and thus the maximum accretion rate) of this outburst would be consistent with the Russell et al. (2014) results that suggest that evolution of does not scale with the source luminosity in the hard state.
However, the large uncertainty on the optical flux density measurements combined with the uncertainty in the optical emission processes in Swift J1745-26 prevents us from drawing any further conclusions within the scope of this paper.
4.3. High mm/sub-mm Fluxes
The few BHXRBs observed in the mm/sub-mm regime have been surprisingly bright when compared to radio frequency measurements (for example, XTE J1118480; Fender et al. 2001, MAXI J1836194; Russell et al. 2013a, and Swift J174526). Historically, astronomers have typically found flat type spectra in jetted sources (Fender, 2006) and it has only been recently that more inverted spectra have been observed in some sources (; e.g., Russell et al. 2013c). As such, it has been suggested that these high fluxes could in fact be an anomalous spectral feature, as they do not fit in with the standard flat spectral picture. For example, Markoff et al. (2001) found an alternative model-fit for the SED of XTE J1118+480 (as opposed to Fender et al. 2001 who fit the SED with a simple broken power-law), where the sub-mm (350GHz) flux is considered anomalous. Neglecting the sub-mm data point, the radio through X-ray emission can be almost entirely fit by synchrotron emission. As a result, Markoff et al. (2001) find a flatter radio to IR spectral index than Fender et al. (2001). This in turn results in a significant change in the location of the spectral break (from to ), implying different physical conditions in the jet.
With recent evidence suggesting an evolving jet spectral break, we have to be careful when labelling high mm/sub-mm fluxes as anomalous if they are not compared to contemporaneous radio measurements (i.e., day). In XTE J1118480, the sub-mm measurement was not simultaneous with the radio measurements (Fender et al., 2001), thus it is difficult to determine whether this measurement is in fact anomalous or not (as is the case with Cyg X–1; Fender et al. 2000, and GRS 1915105; Fender & Pooley 2000; Ogley et al. 2000). In MAXI J1836–194 (Russell et al., 2013c), the mm measurement is clearly consistent with the contemporaneous radio measurements, and the radio through mm spectrum is quite accurately represented by a single power-law through multiple epochs. Additionally, the Herschel detections of GX 339-4 at even higher frequencies (/ or /), were also consistent with the extrapolation of an inverted radio frequency power-law (Corbel et al., 2013b).
Similarly, in our global (radio through sub-mm) spectral fits, both the SMA (230GHz) mm and JCMT (350GHz) sub-mm measurements are consistent with contemporaneous radio measurements (with deviations ). Therefore, we now have evidence from three sources that challenge the hypothesis that high mm/sub-mm fluxes are anomalous in all BHXRB sources, and supports our suggestion presented in the last section that the same mechanism driving spectral inversion, could be driving high mm/sub-mm fluxes. This result clearly justifies the need to continue to sample this mm/sub-mm regime more completely in multiple sources to confirm whether this result holds across the Galactic BHXRB population, especially considering our sparse temporal coverage in the mm/sub-mm regime and the high level of uncertainty in our sub-mm (350 GHz) measurement.
4.4. Radio Frequency Variability
In §3.1 and §3.2 we presented evidence for flux variability at radio frequencies that might be occurring on timescales of minutes (between bands within a VLA observation) to days (between VLA and SMA/JCMT observations). The variability we see in the spectrum may result from the uncertainty introduced either in calibrating the data, interpolating the data, systematic errors introduced from combining data from different telescopes, or a combination of the three. However, previous observing campaigns of BHXRBs have revealed the presence of variability in the hard state (e.g., GX 339–4 at radio through X-ray frequencies; Corbel et al. 2000; Coriat et al. 2009, and correlated IR-mm-radio flares in GRS 1915105; Fender & Pooley 2000). Further, jet models of Malzac (2013a, b, 2014) and Jamil et al. (2010) suggest a possible mechanism that could lead to such rapid variability. In these models, collisions between discrete shells of plasma (injected at the base of the jet with variable bulk Lorentz factors) cause internal shocks in the jet that can naturally produce multi-wavelength variability, possibly occurring on minute timescales at radio frequencies. Such variation is smeared out in longer integrations but could cause the scatter we see here at radio frequencies. Conclusively distinguishing between these two options requires further in depth analysis of the data, and thus will be explored in future work.
5. Summary
In this paper, we have presented the results of our observations of the BHXRB source, Swift J174526 during its 2012–2013 outburst at radio and mm/sub-mm frequencies with the VLA, SMA and JCMT. This campaign marked both the first time that (quasi) simultaneous radio and multiple band mm & sub-mm observations of a BHXRB have been obtained and the first time that the mm/sub-mm spectral index of a BHXRB jet has been measured. The combination of radio and mm/sub-mm measurements allowed us to compare the spectral behaviour between the two regimes and directly probe a part of the jet spectrum that has never been thoroughly sampled before. Through this work we aimed to test whether the jet emission we see was consistent with standard (power-law) jet models, as well as constrain the origin of the large mm/sub-mm fluxes we see in outbursting BHXRBs.
To analyze the jet spectrum in terms of standard jet models we fit a power-law model (, where is constant) to the radio, mm/sub-mm, and global (radio through sub-mm) regimes for the different epochs when we had data.
Our spectral fitting revealed a more inverted spectral index in data sets that contain mm/sub-mm measurements (), when compared to data sets containing radio-only measurements (). Therefore, our measurements suggest a more inverted spectral index across radio–sub-mm frequencies is contributing to the high mm/sub-mm fluxes seen in BHXRBs, and perhaps the same mechanism behind the inversion may also be driving high mm/sub-mm fluxes seen in outbursting BHXRBs. Interestingly, this spectral inversion in the mm/sub-mm regime may be analogous to that seen in the sub-mm bump of LLAGN spectra (e.g., Sgr A*), possibly suggesting a common mechanism for bright sub-mm emission in LLAGN and BHXRBs.
Combining our radio and mm/sub-mm data with optical measurements from Munoz-Darias et al. (2013), we find that the i’band flux density may lie along the extrapolation of the radio–sub-mm power-law. Assuming that the i’band emission is entirely from the jet, this allows us to place 99% confidence interval lower limits for the jet spectral break frequency of early in the outburst. While these are one of the highest lower limits placed on a jet spectral break in a BHXRB to date (cf Russell et al., 2013b), they are consistent with the emerging picture that links X-ray hardness and jet spectral break frequency, where a harder X-ray spectrum tends to have a higher (Russell et al., 2014). However, as the optical flux density may contain significant contributions from an accretion disc, we can place an alternative lower limit to the jet spectral break frequency (using only radio and sub-mm data) of , with the optical flux density from the jet lying well below the extrapolated radio–sub-mm power-law. Such a lower limit to the jet spectral break frequency is similar to that seen in MAXI J1836194.
While our data were reasonably well fit with a single power-law, small deviations at radio frequencies could suggest the possibility of rapid radio flux variability (timescales less than our observational cadence). However, these deviations from a single power-law are only known at confidence, and could be explained by poor quality data. In addition to possible rapid variability, we find clear day to day variability at radio frequencies. Therefore, taking into account that we observe jet emission from the optical depth, surface at each frequency, resulting in an unknown travel time delay in the jet where variation will be observed at mm frequencies before cm frequencies, we conclude that obtaining simultaneous ( day) overlapping multi-wavelength observations across multiple epochs is necessary to accurately probe the jet spectrum in BHXRBs.
Although our results contain some uncertainty, they clearly point out the vital importance of the mm/sub-mm regime in understanding the jet spectrum, demonstrate the capacity of current mm/sub-mm instruments to address questions in this regime, and justify the need to explore this regime further. More high-quality, well-sampled SEDs of BHXRBs in outburst, including the mm/sub-mm regime, will help further constrain the jet spectrum, aid in developing more accurate jet models, and ultimately help understand the underlying physics of relativistic jets in BHXRBs.
6. Acknowledgments
AJT would like to thank Erik Rosolowsky for sharing his extensive knowledge of MCMC and Craig Heinke for helpful discussions. AJT and GRS are supported by an NSERC Discovery Grant. This work was supported by Australian Research Council grant DP120102393. This work was supported by the Spanish Ministerio de Economía y Competitividad and European Social Funds through a Ramòn y Cajal Fellowship (S.M.) and the Spanish Ministerio de Ciencia e Innovaciòn (S.M.; grant AYA2013-47447-C03-1-P). The Submillimeter Array is a joint project between the Smithsonian Astrophysical Observatory and the Academia Sinica Institute of Astronomy and Astrophysics, and is funded by the Smithsonian Institution and the Academia Sinica. The James Clerk Maxwell Telescope has historically been operated by the Joint Astronomy Centre on behalf of the Science and Technology Facilities Council of the United Kingdom, the National Research Council of Canada and the Netherlands Organisation for Scientific Research. Additional funds for the construction of SCUBA–2 were provided by the Canada Foundation for Innovation. The National Radio Astronomy Observatory is a facility of the National Science Foundation operated under cooperative agreement by Associated Universities, Inc.
References
- An et al. (2005) An, T., Zhao, J., Hong, X., et al. 2005, ApJ, 634, L49
- Belloni (2010) Belloni, T. 2010, in The Jet Paradigm - From Microquasars to Quasars, ed. Belloni, T.M., Lecture Notes in Physics 794, Springer
- Belloni et al. (2012) Belloni, T., Cadolle Bel, M., Casella, P., et al. 2012, The Astronomer’s Telegram, 4450, 1
- Blandford & Königl (1979) Blandford, R., & Königl, A. 1979, ApJ, 232, 34
- Brocksopp et al. (2004) Brocksopp, C., Bandyopadhyay, R., & Fender, R. 2004, New Astronomy, 9, 249
- Cardelli et al. (1989) Cardelli, J., Clayton, G., & Mathis, J. S. 1989, ApJ, 345, 245
- Casella & Pe’er (2009) Casella, P., & Pe’er, A. 2009, ApJ, 703, L63
- Casella et al. (2010) Casella, P., Maccarone, T., O’Brien, K., et al. 2010, MNRAS, 404, L21
- Chapin et al. (2013) Chapin, E., Berry, D., Gibb, A., et al. 2013, MNRAS, 430, 2545
- Charles & Coe (2006) Charles, P. A., & Coe, M. 2006, in Compact Stellar X-ray Sources, ed. Lewin W.H.G., van der Klis M., Cambridge Astrophysics Series, No. 39, 215
- Chaty et al. (2011) Chaty, S., Dubus, G., & Raichoor, A. 2011, A&A, 529, A3
- Corbel et al. (2013a) Corbel, S., Coriat, M., Brocksopp, C., et al. 2013a, MNRAS, 428, 2500
- Corbel et al. (2012) Corbel, S., Edwards, P., Tzioumis, T., et al. 2012, ATel, 4410, 1
- Corbel & Fender (2002a) Corbel, S., & Fender, R. 2002a, ApJ, 573, L35
- Corbel & Fender (2002b) —. 2002b, ApJ, 573, L35
- Corbel et al. (2000) Corbel, S., Fender, R., Tzioumis, A.K. amd Nowak, M., et al. 2000, A&A, 359, 251
- Corbel et al. (2013b) Corbel, S., Aussel, H., Broderick, J., et al. 2013b, MNRAS, 431, L107
- Coriat et al. (2009) Coriat, M., Corbel, S., M.M., B., et al. 2009, MNRAS, 400, 123
- Cummings et al. (2012a) Cummings, J., Gronwall, C., Grupe, D., et al. 2012a, GCN Circular, 13774, 1
- Cummings et al. (2012b) Cummings, J., Barthelmy, S., Baumgartner, W., et al. 2012b, GCN Circular, 13775, 1
- Curran et al. (2014) Curran, P., Coriat, M., Miller-Jones, J., et al. 2014, MNRAS, 437, 3265
- Dempsey et al. (2012) Dempsey, J., Friberg, P., Jeness, T., et al. 2012, MNRAS, 430, 2534
- Fabian (2012) Fabian, A. 2012, ARA&A, 50, 455
- Falcke (1996) Falcke, H. 1996, ApJ, 464, L67
- Falcke & Biermann (1995) Falcke, H., & Biermann, P. 1995, A&A, 293, 665
- Falcke et al. (1998) Falcke, H., Goss, W., Matsuo, H., et al. 1998, ApJ, 499, 731
- Falcke et al. (2004) Falcke, H., Kording, E., & Markoff, S. 2004, A&A, 414, 895
- Falcke & Markoff (2000) Falcke, H., & Markoff, S. 2000, A&A, 362, 113
- Fender (2001) Fender, R. 2001, MNRAS, 322, 31
- Fender (2006) —. 2006, in Compact Stellar X-ray Sources, ed. Lewin W.H.G., van der Klis M., Cambridge Astrophysics Series, No. 39, 381
- Fender (2010) —. 2010, in The Jet Paradigm - From Microquasars to Quasars, ed. Belloni, T.M., Lecture Notes in Physics 794, Springer
- Fender & Belloni (2004) Fender, R., & Belloni, T. 2004, ARA&A, 42, 317
- Fender et al. (2004) Fender, R., Belloni, T., & Gallo, E. 2004, MNRAS, 355, 1105
- Fender et al. (2001) Fender, R., Hjellming, R., Tilanus, R., et al. 2001, MNRAS, 322, L23
- Fender et al. (2009) Fender, R., Homan, J., & Belloni, T. 2009, MNRAS, 396, 1370
- Fender & Pooley (2000) Fender, R., & Pooley, G. 2000, MNRAS, 318, L1
- Fender et al. (2000) Fender, R., Pooley, G., Durouchoux, P., Tilanus, R., & Brocksopp, C. 2000, MNRAS, 312, 853
- Foreman-Mackey et al. (2013) Foreman-Mackey, D., Hogg, D. W., Lang, D., & Goodman, J. 2013, PASP, 125, 306
- Gallo (2010) Gallo, E. 2010, in The Jet Paradigm - From Microquasars to Quasars, ed. Belloni, T.M., Lecture Notes in Physics 794, Springer
- Gallo et al. (2005a) Gallo, E., Fender, R., & Hynes, R. 2005a, MNRAS, 356, 1017
- Gallo et al. (2005b) Gallo, E., Fender, R., Kaiser, C., et al. 2005b, Nature, 436, 819
- Gallo et al. (2007) Gallo, E., Migliari, S., Markoff, S., et al. 2007, ApJ, 670, 600
- Gallo et al. (2014) Gallo, E., Miller-Jones, J., Russell, D., et al. 2014, MNRAS, 445, 290
- Gandhi et al. (2011) Gandhi, P., Blain, A., Russell, D., et al. 2011, ApJ, 740, L13
- Guver & Ozel (2009) Guver, T., & Ozel, F. 2009, MNRAS, 400, 2050
- Heinz & Grimm (2005) Heinz, S., & Grimm, H. 2005, ApJ, 633, 384
- Heinz & Sunyaev (2003) Heinz, S., & Sunyaev, R. 2003, MNRAS, 343, L59
- Hjellming & Johnson (1988) Hjellming, R., & Johnson, K. 1988, ApJ, 328, 600
- Ho (1999) Ho, L. 1999, ApJ, 516, 672
- Holland et al. (2013) Holland, W., et al. 2013, MNRAS, 430, 2513
- Hynes et al. (2009) Hynes, R., Bradley, C., Rupen, M., et al. 2009, MNRAS, 399, 2239
- Jamil et al. (2010) Jamil, O., Fender, R., & Kaiser, C. 2010, MNRAS, 401, 394
- Kaiser (2006) Kaiser, C. 2006, MNRAS, 367, 1083
- Kalemci et al. (2014) Kalemci, E., Arabaci, M. O., Guver, T., et al. 2014, MNRAS, 445, 1288
- Malzac (2013a) Malzac, J. 2013a, in The Innermost Regions of Relativistic Jets and Their Magnetic Fields, EPJ Web of Conferences, Volume 61 ed. J.L. Gómez
- Malzac (2013b) —. 2013b, MNRAS, 429, L20
- Malzac (2014) —. 2014, MNRAS, 443, 229
- Markoff et al. (2001) Markoff, S., Falcke, H., & Fender, R. 2001, A&A, 372, L25
- Markoff et al. (2003) Markoff, S., Nowak, M., Corbel, S., Fender, R., & Falcke, H. 2003, A&A, 397
- Markoff et al. (2005) Markoff, S., Nowak, M., & Wilms, J. 2005, ApJ, 635, 1203
- McMullin et al. (2007) McMullin, J. P., Waters, B., Schiebel, D., Young, W., & Golap, K. 2007, Astronomical Data Analysis Software and Systems XVI, ed. R.A. Shaw, F. Hill and D.J. Bell, Astronomical Society of the Pacific Conference Series, Volume 376, 127
- Meier (2001) Meier, D. 2001, ApJ, 548, L9
- Melia & Falcke (2001) Melia, F., & Falcke, H. 2001, ARA&A, 39, 309
- Merloni et al. (2003) Merloni, A., Heinz, S., & Di Matteo, T. 2003, MNRAS, 345, 1057
- Miller-Jones et al. (2012) Miller-Jones, J., Sivakoff, G., & on behalf of the larger JACPOT XRB collaboration. 2012, ATel, 4394, 1
- Mirabel & Rodriguez (1999) Mirabel, I., & Rodriguez, L. 1999, ARA&A, 37, 409
- Munoz-Darias et al. (2013) Munoz-Darias, T., de Ugarte Postigo, A., Russell, D. M., et al. 2013, MNRAS, 432, 1133
- Nowak et al. (2005) Nowak, M., Wilms, J., Heinz, S., et al. 2005, ApJ, 626, 1006
- Ogley et al. (2000) Ogley, R., Bell Burnell, S., Fender, R., Pooley, G., & Waltman, E. 2000, MNRAS, 317, 158
- Paredes et al. (2000) Paredes, J., Marti, J., Peracaula, M., Pooley, G., & Mirabel, I. 2000, A&A, 357, 507
- Pe’er & Casella (2009) Pe’er, A., & Casella, P. 2009, ApJ, 699, 1919
- Pe’er & Markoff (2012) Pe’er, A., & Markoff, S. 2012, ApJ, 753, 177
- Plotkin et al. (2015) Plotkin, R., Gallo, E., Markoff, S., et al. 2015, MNRAS, 446, 4098
- Polko et al. (2010) Polko, P., Meier, D., & Markoff, S. 2010, ApJ, 723, 1343
- Polko et al. (2013) —. 2013, MNRAS, 428, 587
- Polko et al. (2014) —. 2014, MNRAS, 438, 559
- Rahoui et al. (2011) Rahoui, F., Lee, J., Heinz, S., et al. 2011, ApJ, 736, 63
- Remillard & McClintock (2006) Remillard, R., & McClintock, J. 2006, ARA&A, 44, 49
- Russell et al. (2006) Russell, D., Fender, R., Hynes, R., et al. 2006, MNRAS, 371, 1334
- Russell et al. (2013a) Russell, D., Gallo, E., & Fender, R. 2013a, MNRAS, 431, 405
- Russell et al. (2013b) Russell, D., Markoff, S., Casella, P., et al. 2013b, MNRAS, 429, 815
- Russell et al. (2013c) Russell, D., Russell, T., Miller-Jones, J., et al. 2013c, ApJ, 768, L35
- Russell et al. (2014) Russell, T., Soria, R., Miller-Jones, J., et al. 2014, MNRAS, 439, 1390
- Sbarufatti et al. (2013) Sbarufatti, B., Kennea, J., Stroh, M., et al. 2013, ATel, 4782, 1
- Sbarufatti et al. (2012) Sbarufatti, B., B., Kennea, J., Burrows, D., et al. 2012, ATel, 4383, 1
- van der Horst et al. (2013) van der Horst, A., Curran, P., Miller-Jones, J., et al. 2013, MNRAS, 436, 2625
- van Paradijs & McClintock (1995) van Paradijs, J., & McClintock, J. 1995, in X-Ray Binaries, ed. Lewin, W.H.G., van Paradijs, J., van den Heuvel, E.P.J., Cambridge Astrophysics Series, No. 26, 58
- Vovk et al. (2012) Vovk, I., Ferrigno, C., Bozzo, E., et al. 2012, ATel, 4381, 1
- White et al. (1995) White, N., Nagase, F., & Parmar, A. 1995, in X-Ray Binaries, ed. Lewin, W.H.G., van Paradijs, J., van den Heuvel, E.P.J., Cambridge Astrophysics Series, No. 26, 1
- Yuan et al. (2003) Yuan, F., Quataert, E., & Narayan, R. 2003, ApJ, 598, 301
- Zylka et al. (1992) Zylka, R., Mezger, P., & Lesch, H. 1992, A&A, 261, 119