Multiple-pulse lasing from an optically induced harmonic confinement in a highly photoexcited microcavity
Abstract
We report the observation of macroscopic harmonic states in an optically induced confinement in a highly photoexcited semiconductor microcavity at room temperature. The spatially photomodulated refractive index changes result in the visualization of harmonic states in a micrometer-scale optical potential at quantized energies up to 4 meV even in the weak-coupling plasma limit. We characterize the time evolution of the harmonic states directly from the consequent pulse radiation and identify sequential multiple 10 ps pulse lasing with different emitting angles and frequencies.
Optical trapping of atoms is essential to realize atomic Bose-Einstein condensates Bagnato and Kleppner (1991). Similarly, the 2D spatial confinement of excitons or exciton-polaritons by inhomogeneous strains Balili et al. (2007), natural defects and potential fluctuations Lai et al. (2004); Sanvitto et al. (2009); De Giorgi et al. (2014); Nguyen et al. (2014), nanofabrication Kaitouni et al. (2006); Lai et al. (2007); Bajoni et al. (2008); Wertz et al. (2010, 2012); Maragkou et al. (2010); Zajac and Langbein (2012), and optical potentials Manni et al. (2011); Tosi et al. (2012); Cristofolini et al. (2013); Dreismann et al. (2014) in a semiconductor heterostructure/microcavity is considered conducive for the formation and control of the condensates of these quasiparticles. These dynamic condensates can form a meta-stable state in a finite-momentum state Lai et al. (2007); Nelsen et al. (2013) and multiple spatial modes Krizhanovskii et al. (2009). The optical visualization of macroscopic interacting quantum states in solid-state systems has been demonstrated in condensates of excitons (bound electron-hole pairs) and kindred quasiparticles. Such light–matter hybrid condensates are typically formed at cryogenic temperatures in a photoexcited density much below the Mott transition where constituent quasiparticles can be considered boson-like. Optically defined potentials enabled by the effective repulsive interactions of polaritons result in further real-time manipulation of these light-matter fluids in a steady state Tosi et al. (2012); Cristofolini et al. (2013); Dreismann et al. (2014). On the other hand, relaxation oscillations with 10–50 ps period caused by the interplay between reservoir feeding and Bose stimulation have been reported in localized condensates in natural potential fluctuations De Giorgi et al. (2014).
In this study, we report the optical visualization of dynamic quantized states in a highly photoexcited microcavity at room temperature. Photoexcitation creates mainly free pairs of electrons and holes in a III-V-based semiconductor quantum well (QW) as a result of thermal ionization at high temperature Chemla and Miller (1985); Colocci et al. (1990). In the highly photoexcited microcavity studied here, the nonlinearly photomodulated refractive index results in a sizable effective cavity resonance shift, which enabls optically induced confinement. In an optical confinement initiated by spatially modulated nonresonant ps pulse excitation, sequential multiple-pulse lasing commences at several quantized energy levels. The transverse optical modes in a spatially modulated refractive index can also be understood as an optically induced potential for a fictitious quasiparticle (see Supplemental Material), e.g., correlated e-h pairs (cehp) resulting from the effective coupling to the cavity light field. Multiple-pulse lasing from discrete states in a harmonic confinement (potential) manifests as a result of the time- and energy-dependent competition between the gain and reservoir carrier relaxation.
The Fabry–Pérot microcavity sample consists of a GaAs cavity layer containing three sets of three InGaAs/GaAs QWs embedded within GaAs/AlAs distributed Bragg reflectors (DBRs) (see also Supplemental Material). The sample is nonresonantly excited by a 2-ps pulse pump laser at = 1.58 eV at room temperature. The pump energy is about 250 meV above the QW band gap ( 1.33 eV) and 170 meV above the cavity resonance ( 1.40–1.41 eV). The high-density e-h plasmas of a density per QW per pulse are formed momentarily after non-resonant pulse excitation as a result of rapid (10 ps) energy dissipation through optical phonons. The radiative recombination rate of these e-h carriers in the reservoir is suppressed because the cavity resonance is detuned to 70–80 meV above the QW bandgap , i.e., the transition between the first quantized electron and (heavy-)hole states in a QW. Below the lasing threshold, the high-density e-h plasmas in the microcavity are subject to non-radiative loss with a long decay time (500 ps) (Supplemental Fig. S1). Therefore, the chemical potential of the e-h plasmas () appears to be stationary within 100 ps after pulse excitation. The bare cavity resonance of the sample studied here is close to , the transition between the second quantized electron and hole levels of InGaAs/GaAs QWs.
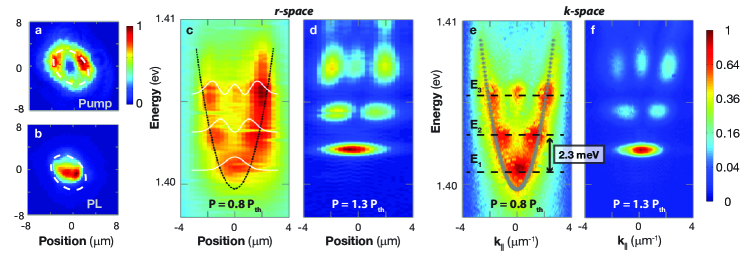
When advances toward , the average refractive index near can be considerably modified, and this results in a sizable blueshift of the effective cavity resonance () and consequent emission energy (Supplemental Fig. S2a). In general, increases with the photoexcited density and can be seen as an effective potential for cehps (Supplemental Material section S3). Therefore, a quasi-stationary confining potential for cehps can be established by a ring-shaped spatial distribution of photoexcited carrier density. In our experiments, we use a double-hump-shaped beam to fixate the orientation of the optically defined potential (Fig. 1a–b).
Real-space (r-space) imaging spectra provide direct visualization of the optical potential. Fig. 1c–d shows the r-space imaging spectra of a narrow cross-sectional stripe across the trap. A nearly parabolic potential well of 10 meV across 3 m is revealed. Such a quasi-1D harmonic potential, , is spontaneously formed under 2 ps pulse excitation. The resultant radiation appears in-between the two humps, a few micrometers away from the pump spot. The r-space intensity profiles agree with the probability distributions of the quantized states of a harmonic oscillator (harmonic states). The deviations of the actual potential from a perfectly harmonic trap result in slightly asymmetric luminescence intensity distributions. These standing wave patterns form in the self-induced harmonic optical potential when a macroscopic coherent state emerges. At a critical density, the occupation number of cehps () in these quantized harmonic states approaches unity when the conversion from the reservoir () overcomes the decay of the harmonic states. Consequently, when a stimulated process () prevails, and the resultant radiation increase nonlinearly by a few orders of magnitude with the increasing .
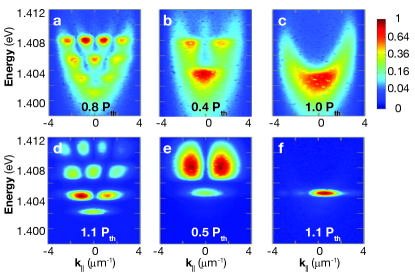
An even more regular pattern appears in k-space imaging spectra (Fig. 1e–f). The vs. dispersion measured below the threshold allows the direct measurement of the effective mass , where is the electron rest mass. Moreover, the strength of the optically defined harmonic potential can be tuned through a variation in the spatial distance between two humps of the pump beam (Fig. 2). The energy quantization () varies with , while the emission patterns evolve into the probability distributions for a particle with an effective mass in (Fig. 2 and Supplemental Fig. S3).
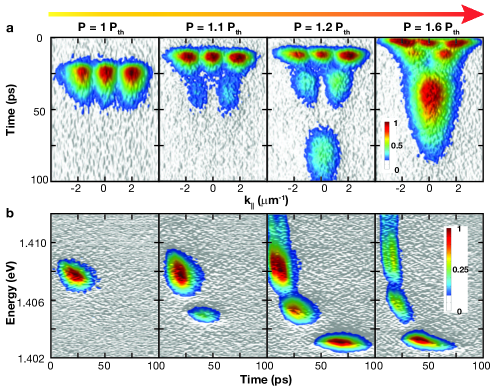
Temporally, these harmonic states emerge sequentially and display distinct density-dependent dynamics. In Fig. 3a, we study the time evolutions of three harmonic states in k-space. The corresponding time-integrated imaging spectra in k-space are shown in Supplemental Fig. S4. The energy relaxation of these three states is revealed in the time-resolved spectra in Fig. 3b. At a critical photoexcited density, the high-energy state arises 25 ps after pulse excitation and lasts for 20 ps. The corresponding pump flux is defined as the threshold (). With the increasing pump flux, the state emerges 25 ps after at 1.1 , whereas the ground state appear 50 ps after at 1.2 . In the optically induced harmonic confinement studied here, the effective cavity resonance decreases with time as a result of the decay of reservoir carriers. However, the conversion from the reservoir to specific confined state can be efficient only when is resonant with . Such a temporally decrease in results in a time- and energy-dependent conversion efficiency for these confined harmonic states (Fig. S1) and consequent multiple-pulse lasing above the critical density threshold.
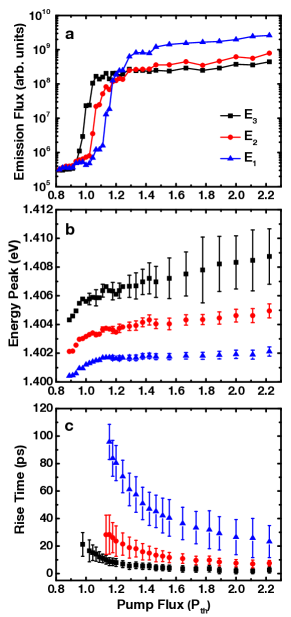
We further analyze the emission flux and energy of these harmonic states by using time-integrated spectra measured with increasing photoexcited density (Fig. 4 and Supplemental Fig. S2). Far below the threshold (), emission is dominated by luminescence from GaAs spacer layers. When the pump flux is increased, the emissions from the cehp states become increasingly dominant, and the state eventually lases at the threshold. The emission fluxes of all three states increase nonlinearly by more than two orders of magnitude across a threshold and then reach a plateau at a saturation density (Fig. 4a). On the other hand, the emission energy of these three states increases to a constant with the increasing pump flux (Fig. 4b). The energy spacing only increases slightly with density. The spectral linewidths increase slightly for the state but by about a factor of 10 for the state. Next, we study the density-dependent dynamics. Fig. 4c shows the rise times and pulse durations for , , and . The product of the variances of the spectral linewidth () and the pulse duration () is found to be close to that of a transform-limited pulse: and for the and states, respectively. These harmonic states are macroscopically coherent states with finite phase and intensity fluctuations induced by interactions.
We use a rate-equation model to describe the dynamic formation of quantized states in an optically defined harmonic confinment (Supplemental Material Sec. S4Supplemental Material). This phenomenological model reproduces qualitatively the dynamics and integrated emission flux of the harmonic states when photoexcited density is varied (Supplemental Figs. S5, S6, and S7). Non-equilibrium polariton condensates have been modeled by a modified Gross–Pitaevskii (GP) (or complex Ginzberg–Landau [cGL]) equation that accounts for the finite lifetime of polaritons Szymańska et al. (2006); Wouters and Carusotto (2007). However, cGL-type equations are inapplicable for the multiple dynamic states examined in this study. Additionally, the formation of a BEC-like condensate that underpins the GP- or cGL-type equation is not necessarily justified in our room-temperature experiments.
Transverse light-field patterns and confined optical modes have been identified in nonlinear optical systems Mandel and Tlidi (2004), vertical-cavity surface-emitting lasers (VCSELs) Chang-Hasnain et al. (1991); Zhang et al. (2004), and microscale photonic structures Reithmaier et al. (1997). In principle, the multiple transverse mode lasing in a high-density e-h-plasma described in the present study can be modeled by a self-consistent numerical analysis with Maxwell-Bloch equations developed for conventional semiconductor lasers Koch et al. (1995); Sarzala et al. (2012), provided that the strong optical nonlinearities induced by Coulomb many-body effects, such as screening, bandgap renormalization, and phase-space filling, are all considered. For example, one can consider the formation of index-guided multiple transverse modes as a result of an optically-induced refractive index reduction (). The cavity resonance shift () can be estimated from , where is the effective refractive index averaged over the longitudinal cavity photon mode which spans over m in the growth direction. Therefore, a cavity resonance shift 10 meV (Figs. 1 and 2) corresponds to 1%. Such a significant refractive index is probable with resonance-enhance optical nonlinearity from the e-h correlation Schmitt-Rink et al. (1986); Campi et al. (1998); Tanguy (1999); Kamide et al. (2012) or carrier-induced change in refractive index at a high carrier density (of cm-3 or more) Lee et al. (1986); Bennett et al. (1990); Huang et al. (1998). To uncover the microscopic formation mechanisms of such a sizable spatial modulation in refractive index or equivalent effective harmonic confinement under pulse excitation, further characterizing the photoexcited density distribution with the use of other ultrafast spectroscopic techniques, such as a pump-probe spectroscopy, is necessary.
We identify sequential multiple 10 ps pulse lasing in an optically induced harmonic confinement in a semiconductor microcavity at room temperature. Laser radiation emerges at the quantized states of an optically induced harmonic confinement. The lasing frequency, rise time, pulse width, and radiation angle can be controlled through a variation in the photoexcited density or optical pump spot dimensions in real time. The sample has a composition structure similar to those used for studies of polariton condensates/lasers and the widely used VCSELs. In the highly photoexcited microcavity studied here, harmonic confinement can be optically induced and controlled as a result of photomodulated refractive index changes even in the weak-coupling plasma limit. Our demonstration of macroscopic harmonic states in a room-temperature optically induced harmonic confinement improves our understanding of nonlinear laser dynamics and should stimulate studies on emergent ordered states near the Fermi edge of a high-density e-h plasma in a semiconductor cavity Nozières and Schmitt-Rink (1985); Keeling et al. (2005); Yamaguchi et al. (2013).
Acknowledgements.
We thank Cheng Chin, Mark Dykman, Brage Golding, Peter B. Littlewood, John A. McGuire, David W. Snoke and Carlo Piermarocchi for the discussions. This work was supported by NSF grant DMR-0955944 and J. Cowen endowment at Michigan State University.References
- Bagnato and Kleppner (1991) V. Bagnato and D. Kleppner, Phys. Rev. A 44, 7439 (1991).
- Balili et al. (2007) R. Balili, V. Hartwell, D. Snoke, L. Pfeiffer, and K. West, Science 316, 1007 (2007).
- Lai et al. (2004) C. W. Lai, J. Zoch, A. C. Gossard, and D. S. Chemla, Science 303, 503 (2004).
- Sanvitto et al. (2009) D. Sanvitto, A. Amo, L. Viña, R. André, D. Solnyshkov, and G. Malpuech, Phys. Rev. B 80, 045301 (2009).
- De Giorgi et al. (2014) M. De Giorgi, D. Ballarini, P. Cazzato, G. Deligeorgis, S. I. Tsintzos, Z. Hatzopoulos, P. G. Savvidis, G. Gigli, F. P. Laussy, and D. Sanvitto, Phys. Rev. Lett. 112, 113602 (2014).
- Nguyen et al. (2014) H. S. Nguyen, Z. Han, K. Abdel-Baki, X. Lafosse, A. Amo, J.-S. . Lauret, E. Deleporte, S. Bouchoule, and J. Bloch, Appl. Phys. Lett. 104, 081103 (2014).
- Kaitouni et al. (2006) R. I. Kaitouni, O. El Daif, A. Baas, M. Richard, T. Paraiso, P. Lugan, T. Guillet, F. Morier-Genoud, J. D. Ganiere, J. L. Staehli, V. Savona, and B. Deveaud, Phys. Rev. B 74, 155311 (2006).
- Lai et al. (2007) C. W. Lai, N. Y. Kim, S. Utsunomiya, G. Roumpos, H. Deng, M. D. Fraser, T. Byrnes, P. Recher, N. Kumada, T. Fujisawa, and Y. Yamamoto, Nature 450, 529 (2007).
- Bajoni et al. (2008) D. Bajoni, P. Senellart, E. Wertz, I. Sagnes, A. Miard, A. Lemaitre, and J. Bloch, Phys. Rev. Lett. 100, 047401 (2008).
- Wertz et al. (2010) E. Wertz, L. Ferrier, D. D. Solnyshkov, R. Johne, D. Sanvitto, A. Lemaître, I. Sagnes, R. Grousson, A. V. Kavokin, P. Senellart, G. Malpuech, and J. Bloch, Nature Phys. 6, 860 (2010).
- Wertz et al. (2012) E. Wertz, A. Amo, D. D. Solnyshkov, L. Ferrier, T. C. H. Liew, D. Sanvitto, P. Senellart, I. Sagnes, A. Lemaître, A. V. Kavokin, G. Malpuech, and J. Bloch, Phys. Rev. Lett. 109, 216404 (2012).
- Maragkou et al. (2010) M. Maragkou, A. J. D. Grundy, E. Wertz, A. Lemaitre, I. Sagnes, P. Senellart, J. Bloch, and P. G. . G. Lagoudakis, Phys. Rev. B 81, 081307 (2010).
- Zajac and Langbein (2012) J. M. Zajac and W. Langbein, Phys. Rev. B 86, 195401 (2012).
- Manni et al. (2011) F. Manni, K. G. Lagoudakis, T. C. H. Liew, R. André, and B. Deveaud-Plédran, Phys. Rev. Lett. 107, 106401 (2011).
- Tosi et al. (2012) G. Tosi, G. Christmann, N. G. Berloff, P. Tsotsis, T. Gao, Z. Hatzopoulos, P. G. Savvidis, and J. J. Baumberg, Nature Phys. 8, 190 (2012).
- Cristofolini et al. (2013) P. Cristofolini, A. Dreismann, G. Christmann, G. Franchetti, N. G. Berloff, P. Tsotsis, Z. Hatzopoulos, P. G. Savvidis, and J. J. Baumberg, Phys. Rev. Lett. 110, 186403 (2013).
- Dreismann et al. (2014) A. Dreismann, P. Cristofolini, R. Balili, G. Christmann, F. Pinsker, N. G. Berloff, Z. Hatzopoulos, P. G. Savvidis, and J. J. Baumberg, Proc. Natl. Acad. Sci. U.S.A. , 201401988 (2014).
- Nelsen et al. (2013) B. Nelsen, G. Liu, M. Steger, D. W. Snoke, R. Balili, K. West, and L. Pfeiffer, Phys. Rev. X 3, 041015 (2013).
- Krizhanovskii et al. (2009) D. N. Krizhanovskii, K. G. Lagoudakis, M. Wouters, B. Pietka, R. A. Bradley, K. Guda, D. M. Whittaker, M. S. Skolnick, B. Deveaud-Plédran, M. Richard, R. André, and L. S. Dang, Phys. Rev. B 80, 045317 (2009).
- Chemla and Miller (1985) D. S. Chemla and D. A. B. Miller, J. Opt. Soc. Am. B 2, 1155 (1985).
- Colocci et al. (1990) M. Colocci, M. Gurioli, and A. Vinattieri, J. Appl. Phys. 68, 2809 (1990).
- Szymańska et al. (2006) M. H. Szymańska, J. Keeling, and P. B. Littlewood, Phys. Rev. Lett. 96, 230602 (2006).
- Wouters and Carusotto (2007) M. Wouters and I. Carusotto, Phys. Rev. Lett. 99, 140402 (2007).
- Mandel and Tlidi (2004) P. Mandel and M. Tlidi, J. Opt. B: Quantum Semiclass. Opt. 6, R60 (2004).
- Chang-Hasnain et al. (1991) C. J. Chang-Hasnain, J. P. Harbison, G. Hasnain, A. C. Von Lehmen, L. T. Florez, and N. G. Stoffel, IEEE J. Quantum Electron. 27, 1402 (1991).
- Zhang et al. (2004) H. Zhang, G. Mrozynski, A. Wallrabenstein, and J. Schrage, IEEE J. Quantum Electron. 40, 18 (2004).
- Reithmaier et al. (1997) J. P. Reithmaier, M. Röhner, H. Zull, F. Schäfer, A. Forchel, P. A. Knipp, and T. L. Reinecke, Phys. Rev. Lett. 78, 378 (1997).
- Koch et al. (1995) S. W. Koch, F. Jahnke, and W. W. Chow, Semicond. Sci. Technol. 10, 739 (1995).
- Sarzala et al. (2012) R. Sarzala, T. Czyszanowski, M. Wasiak, M. Dems, L. Piskorski, W. Nakwaski, and K. Panajotov, Adv. Opt. Technol. 2012, 17 (2012).
- Schmitt-Rink et al. (1986) S. Schmitt-Rink, C. Ell, and H. Haug, Phys. Rev. B 33, 1183 (1986).
- Campi et al. (1998) D. Campi, G. Colí, and M. Vallone, Phys. Rev. B 57, 4681 (1998).
- Tanguy (1999) C. Tanguy, Phys. Rev. B 60, 10660 (1999).
- Kamide et al. (2012) K. Kamide, M. Yoshita, H. Akiyama, M. Yamaguchi, and T. Ogawa, J. Phys. Soc. Jpn. 81, 093706 (2012).
- Lee et al. (1986) Y. H. Lee, A. Chavez-Pirson, S. W. Koch, H. M. Gibbs, S. H. Park, J. Morhange, A. Jeffery, N. Peyghambarian, L. Banyai, A. C. Gossard, and W. Wiegmann, Phys. Rev. Lett. 57, 2446 (1986).
- Bennett et al. (1990) B. R. Bennett, R. A. Soref, and J. A. del Alamo, IEEE J. Quantum Electron. 26, 113 (1990).
- Huang et al. (1998) L. Huang, J. P. Callan, E. N. Glezer, and E. Mazur, Phys. Rev. Lett. 80, 185 (1998).
- Nozières and Schmitt-Rink (1985) P. Nozières and S. Schmitt-Rink, J. Low Temp. Phys. 59, 195 (1985).
- Keeling et al. (2005) J. Keeling, P. R. Eastham, M. H. Szymanska, and P. B. Littlewood, Phys. Rev. B 72, 115320 (2005).
- Yamaguchi et al. (2013) M. Yamaguchi, K. Kamide, R. Nii, T. Ogawa, and Y. Yamamoto, Phys. Rev. Lett. 111, 026404 (2013).
See pages ,1,,2,,3,,4,,5 of quantum_oscillator_r05_20150707_prl_supp_revision.pdf