CSI 2264: Characterizing Young Stars in NGC 2264 with Short-Duration, Periodic Flux Dips in their Light Curves ***Based on data from the Spitzer and CoRoT missions, as well as the Canada France Hawaii Telescope (CFHT) MegaCam CCD, and the European Southern Observatory Very Large Telescope, Paranal Chile, under program 088.C-0239. The CoRoT space mission was developed and is operated by the French space agency CNES, with particpiation of ESA’s RSSD and Science Programmes, Austria, Belgium, Brazil, Germany, and Spain. MegaCam is a joint project of CFHT and CEA/DAPNIA, which is operated by the National Research Council (NRC) of Canada, the Institute National des Sciences de l’Univers of the Centre National de la Recherche Scientifique of France, and the University of Hawaii.
Abstract
We identify nine young stellar objects (YSOs) in the NGC 2264 star-forming region with optical CoRoT light curves exhibiting short-duration, shallow, periodic flux dips. All of these stars have infrared (IR) excesses that are consistent with their having inner disk walls near the Keplerian co-rotation radius. The repeating photometric dips have FWHM generally less than one day, depths almost always less than 15%, and periods (3 11 days) consistent with dust near the Keplerian co-rotation period. The flux dips vary considerably in their depth from epoch to epoch, but usually persist for several weeks and, in two cases, were present in data collected on successive years. For several of these stars, we also measure the photospheric rotation period and find that the rotation and dip periods are the same, as predicted by standard “disk-locking” models. We attribute these flux dips to clumps of material in or near the inner disk wall, passing through our line of sight to the stellar photosphere. In some cases, these dips are also present in simultaneous Spitzer IRAC light curves at 3.6 and 4.5 microns. We characterize the properties of these dips, and compare the stars with light curves exhibiting this behavior to other classes of YSO in NGC 2264. A number of physical mechanisms could locally increase the dust scale height near the inner disk wall, and we discuss several of those mechanisms; the most plausible mechanisms are either a disk warp due to interaction with the stellar magnetic field or dust entrained in funnel-flow accretion columns arising near the inner disk wall.
Subject headings:
open clusters and associations: individual (NGC 2264)—circumstellar matter—stars: pre-main sequence—stars: protostars—stars: variables: T Tauri1. Introduction
Understanding how young stellar objects (YSOs) assemble themselves and how the accretion process works requires understanding the structure and evolution of the inner disk on size scales 0.1 AU. Even with the advent of infrared (IR) and radio interferometry, imaging of even the nearest YSOs to detect structure on these size scales is impractical. It therefore becomes necessary to infer the spatial structure and composition on these size scales indirectly from, for example, spectral energy distributions (SEDs), high-resolution spectra, or variability studies.
SEDs have provided some of the most important insights into the structure and evolution of the inner disks of YSOs. These SEDs have been used not only to argue for the presence of an inner disk wall, located roughly at the dust sublimation boundary, but also that the upper edge of the wall is in most cases curved (McClure et al. 2013). Some YSOs have both inner and outer optically thick disks separated by an optically thin gap, with the gap likely the result of gravitational sweeping by an embedded giant planet (Quillen et al. 2004). Mid-IR spectrophotometric variability seen in a number of YSOs suggest that the height of their inner disk wall varies by up to 20% on timescales of days or weeks (Espaillat et al. 2011).
Optical or near-IR photometric variability studies offer another path to understanding inner disk structure and to the physics of the interaction between the inner disk and the parent star. Such studies date back more than half a century (Joy 1945), where variability was used as one of the defining characteristics of the new class of young, forming stars. Herbst et al. (1994) summarized the available information on T Tauri star variability, identifying several different classes dominated variously by rotational modulation of cold or hot spots, variable accretion or variable extinction. Variable extinction is particularly attractive as a means to study inner disk structure because in principle it can yield information on very small size scales, if the cadence of the time series photometry is high enough. Bouvier et al. (1999) showed that AA Tau has broad, periodic flux dips whose amplitude and shape vary from epoch to epoch, which they ascribe to variable extinction resulting from a warp in the star’s inner disk and to large variation in the amount of material at the inner disk rim on week timescales. Photometric surveys of entire star forming regions (e.g., Carpenter et al. 2001; Flaherty et al. 2012; Findeisen et al. 2013) with modern 2-D arrays have also allowed other types of variable extinction events – both periodic and aperiodic – to be identified.
We have recently obtained the highest cadence, highest signal-to-noise (S/N) time domain survey of a large population of YSOs in a star-forming region during two campaigns in 2008 and 2011. We have used those data for NGC 2264 for an initial study of the AA Tau-type variables in the cluster (Alencar et al. 2010); to provide a statistical basis for a new YSO light-curve morphology classification scheme (Cody et al. 2014); and to identify a set of YSOs whose light curves are dominated by short duration accretion bursts (Stauffer et al. 2014). In this paper, we use this dataset to identify a small set of YSOs whose light curves exhibit short duration, often near-Gaussian shaped, periodic flux dips which must arise from dust structures near the inner disk wall. In a companion paper (McGinnis et al. 2015), we provide a quantitative analysis of all of the other YSOs in our NGC 2264 sample with flux dips due to variable extinction events.
2. Observational Data
A detailed description of the photometric data we collected in our 2008 and 2011 observing campaigns for the NGC 2264 star-forming region is provided in Cody et al. (2014)111The CoRoT and Spitzer light curves for all probable NGC 2264 members, as well as our broad band photometry for these stars, are available at http://irsa.ipac.caltech.edu/data/SPITZER/CSI2264.. The subset of the data sources that we use here include several sets of time-series, photometric monitoring data (the first four items below) plus additional single-epoch ancillary photometry (the last two items): * A 2008 campaign using the CoRoT (Convection, Rotation, and planetary Transits; Baglin et al. 2009) satellite, designated as SRa01 within the CoRoT mission, with photometry being collected from roughly MJD 54534 to 54556, a period of 23 days. The observing cadence was generally every 512 seconds; however, bright targets and targets of known special interest could be done at 32 second cadence (and the spacecraft could autonamously switch to 32 second cadence if transit-like events were detected). The passband is set just by the sensitivity curve for the CoRoT CCD, corresponding to a broad V R filter. Only stars present in an input catalog have CoRoT light curves. For each cataloged star, a specific pixel mask was designated to determine which set of pixels was queried to derive the photometry for that star. For the light curves discussed in this paper and illustrated in the figures, typical RMS uncertainties in the CoRoT relative photometry range from about 2 mmag at the bright end (e.g. Mon-250, Figure 1a) to about 6 mmag at the faint end (Mon-6975, Figure 1f). * A 2011 campaign designated as SRa05 within the CoRoT mission, with data collected from roughly MJD 55897 to 55936. The noise level in these light curves is both higher and more spatially variable due to increased CCD radiation damage. In some cases, the same star was observed with different pixel masks in the two epochs, which can also change the derived flux. The observing cadence and basic pipeline reduction steps were, however, the same for the two campaigns. * Spitzer (Werner et al. 2004) warm mission Infrared Array Camera (IRAC; Fazio et al. 2004) 3.6 and 4.5 m data obtained simultaneous with the CoRoT SRa05 campaign, roughly from MJD 55900 to 55930. The cadence was approximately every 2 hours. Stars near the lower or upper edge of the mapped region have data in only one of the two channels. All of the Spitzer light curves discussed in this paper are for stars that are fairly bright at IRAC wavelengths, with expected RMS uncertainties of order 1% for their relative photometric accuracies. * -band imaging using the US Naval Observatory (USNO) 40” telescope obtained on clear or partially clear nights during two campaigns (winter 2010 and winter 2011), roughly MJD 55505 to 55560 and MJD 55890 to 55990. Typically, 100-200 epochs of data were collected in 2010, and of order 900 epochs in 2011/2012. For each campaign, imaging was obtained for an approximately 23’x23’ region, centered on the cluster center. Aperture photometry was performed for all stars in all images. The zero-points for each CCD frame were established by identification of a set of non-variable stars in the region surveyed, and forcing the photometry for these stars to be constant across all images. Each light curve was normalized to a mean relative magnitude of zero. For the stars in Table 1, the USNO relative photometry should have RMS uncertainties of less than 1% at the bright end, rising to of order 2% for the faintest of our stars. * Single epoch imaging of the entire cluster, with standard Sloan Digital Sky Survey (SDSS) filters, obtained using Megacam on the Canada-France-Hawaii Telescope (CFHT) during two observing runs in 2010 and 2012. These data are presented in detail in Venuti et al. (2014). * Spitzer IRAC 3.6, 4.5, 5.8 and 8.0 m and MIPS 24 m single epoch imaging photometry of the entire cluster obtained early in the cryogenic mission, and reported in Sung et al. (2009) and Teixeira et al. (2012).
3. Overview of YSOs Whose Light Curves are Dominated by Variable Extinction Events
If a clump of circumstellar dust passes through our line of sight to a YSO, the light from the star will dim by an amount roughly proportional to the column density of dust, modified according to the size distribution of the grains (if the clump is optically thin), or by an amount proportional to the fractional area of the star that is covered (if the clump is optically thick but small in angular size relative to the star). If the dust clump is long lived and relatively fixed in location, the flux dips it produces should be periodic at the Keplerian rotation period for that clump. For some stars, a warped inner disk has been invoked (e.g., AA Tau – Bouvier et al. 1999; Flaherty & Muzerolle 2010) to explain deep flux dips that extend over half or more of the star’s rotation period. Dust clumps produced by instability processes in the disk, and levitated above the disk plane into our line of sight, could produce flux dips that do not repeat (Turner et al. 2010). Other longer timescale variable extinction events could be associated with Keplerian rotation in the outer disk bringing dust into our line of sight (Bouvier et al. 2013); with orbital motion of a binary system causing our line of sight to intersect a circumbinary disk (Plavchan et al. 2008a); or with dust entrained in a spatially or temporally variable disk wind (Bans & Königl 2012).
In our 40+ day monitoring of the star-forming region NGC2264 with CoRoT and Spitzer, we have identified three different morphological light curve signatures which appear to be associated with variable extinction events. Figure 1 shows light curves for NGC 2264 Classical T Tauri stars (CTTS) which illustrate each of these different modes. These three modes are:


-
•
AA Tau analogs (examples illustrated in Figure 1a and b.) Light curves of this type have relatively flat continua, punctuated by deep, broad flux dips occurring at the Keplerian orbital period for material near the inner disk rim. The generally accepted physical explanation is that there is a warp in the inner disk, and that a portion of this warp occults our line of sight (Bouvier et al. 1999);
-
•
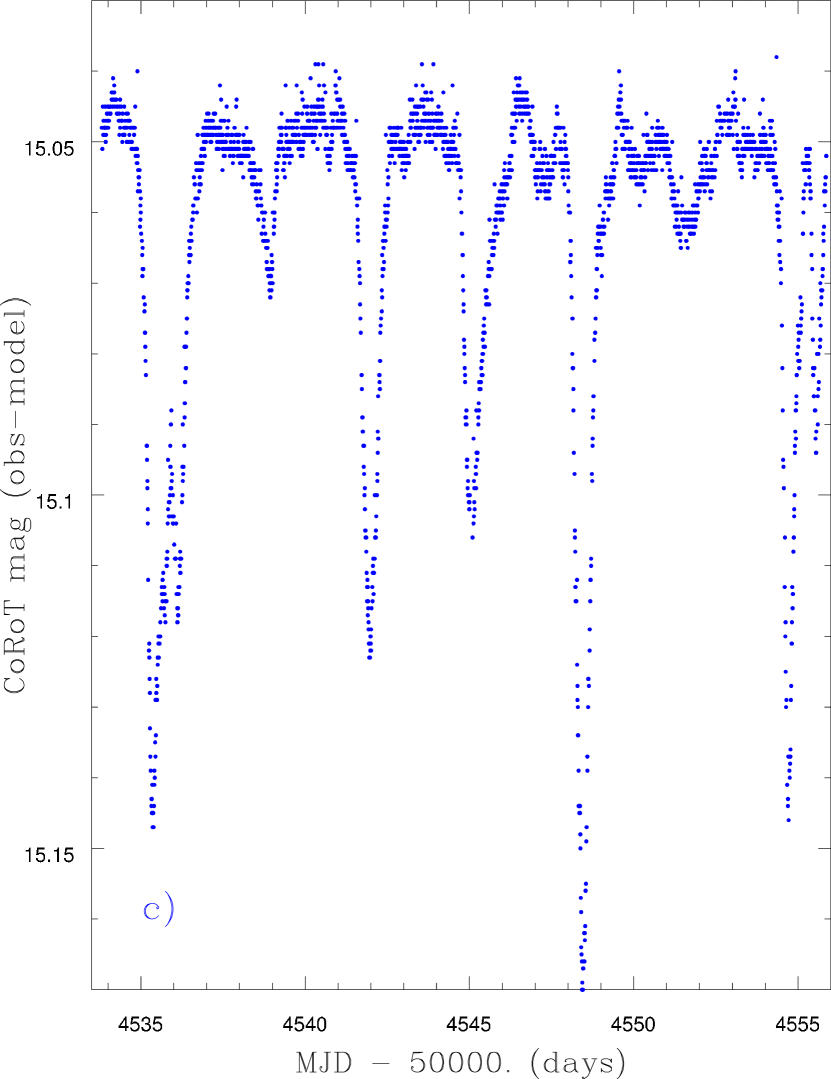
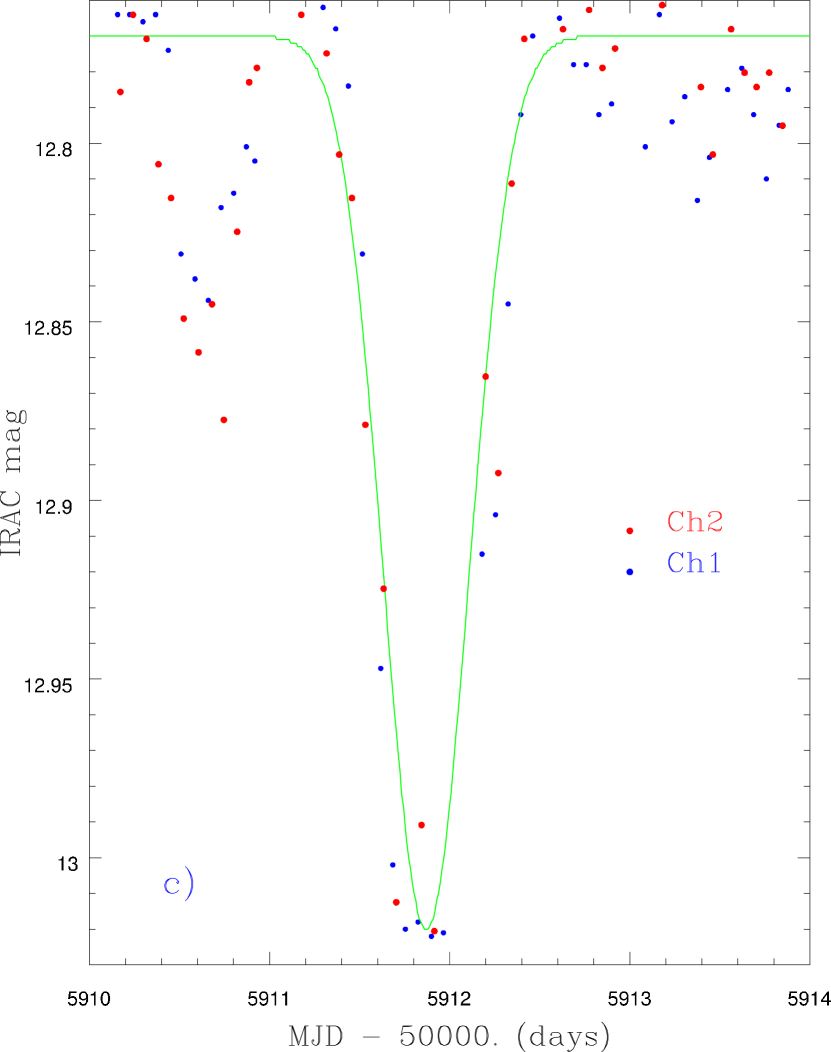
Aperiodic extinctors (examples illustrated in Figure 1c and d.) Light curves of this type have relatively flat continua and deep, narrow and/or broad flux dips but with no obvious periodicity. A possible physical mechanism is dust levitated relatively high above the disk mid-plane by magneto-resonance instabilities (MRI) or other instabilities, which then settles back towards the mid-plane, accretes onto the star, or escapes or sublimates on timescales of hours to days. See McGinnis et al. (2015) for a discussion of these stars;
-
•
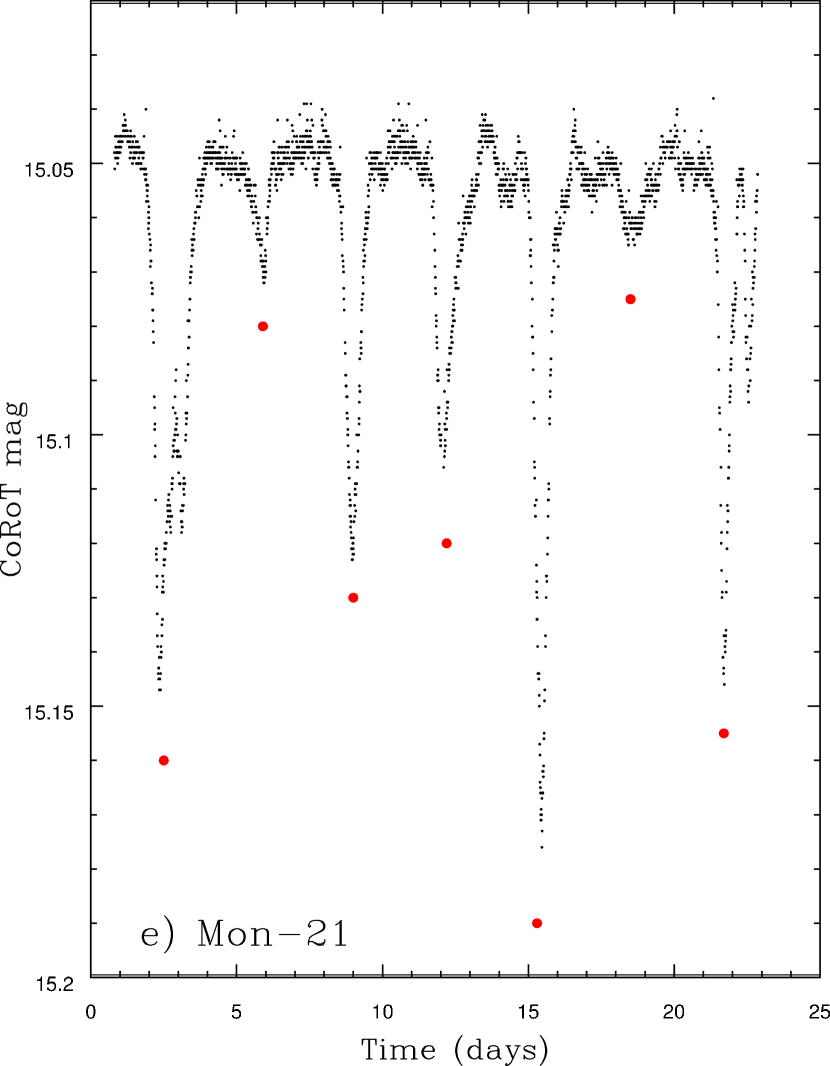
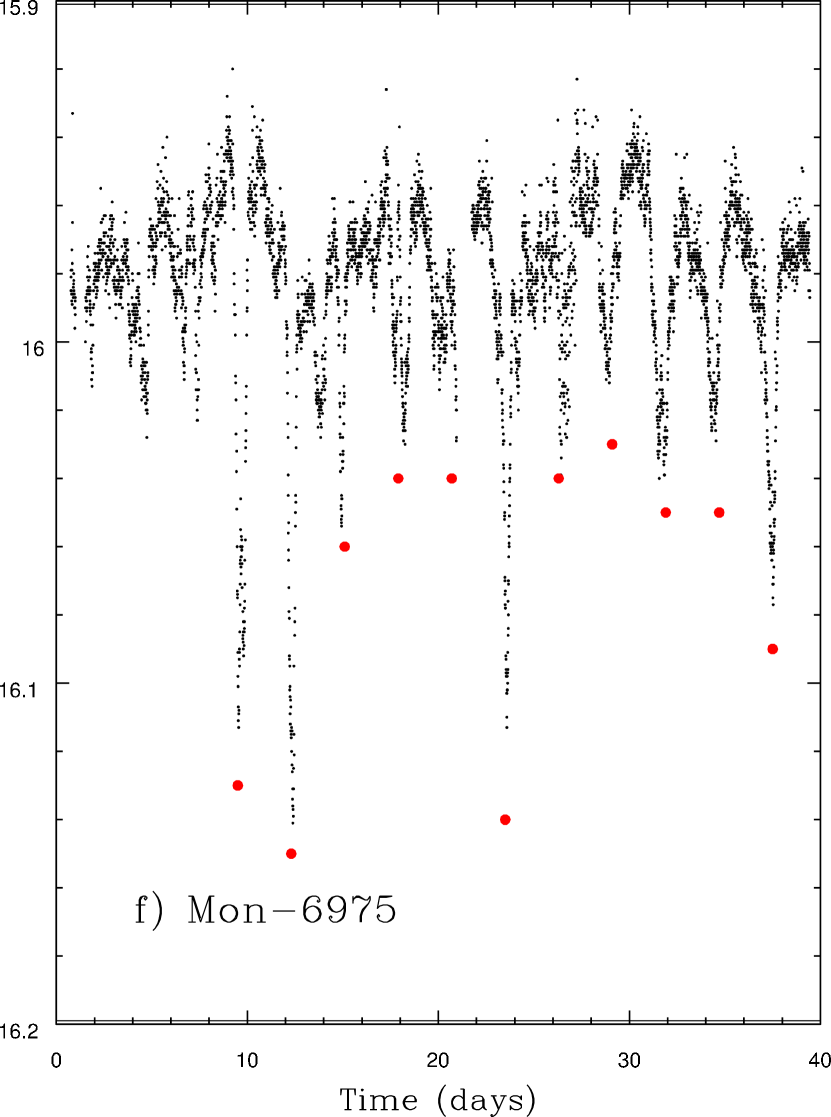
Short duration, periodic dippers (newly identified group - examples illustrated in Figure 1e and f). Light curves of this type have relatively shallow, relatively narrow flux dips with periods generally in the range 3-10 days, and with dip shapes often approximately Gaussian. Sometimes these dips are superposed on a relatively flat continuum, but sometimes the dips are superposed on sine-wave light variations which we attribute to other physical mechanisms. A physical mechanism for these flux dips must also involve dust structures in or near the inner disk rim that are brought into our line of sight by orbital motion. We discuss options for the origin of these structures in §7.
There are other types of variables – primarily eclipsing binaries (or systems with transiting exoplanets) – which also have narrow flux dips in their light curves, but their light curves are distinctively different from those illustrated throughout this paper. Figure 2 shows two eclipsing binary (EB) light curves from the 2008 NGC 2264 campaign. Figure 2a is the light curve for Mon-256, a dM-dM binary member of NGC 2264 (Gillen et al. 2014) that is a borderline CTTS (broad and structured H profile; modest IR excess); this is the only EB in NGC 2264 with an IR excess presumably due to circumstellar or circumbinary dust. For well-detached systems, eclipses by stellar-sized bodies yield flux dips that are of much shorter duration (with a Gaussian fit width of = 0.045 days for the eclipses of Mon-256) than those which we study in this paper. The eclipse depths for Mon-256 appear to vary considerably with time primarily due to the varying continuum level – once that is removed, the depths are quite stable, though slightly different at the primary and secondary eclipse since each star has slightly different radius and effective temperature. Figure 2b shows the light curve of a field star projected towards NGC 2264; its light curve is that for a near-contact binary ( 11 day) where the continuum variations are primarily due to the ellipsoidal shapes of the stars superposed on which are narrow flux dips from the primary and secondary eclipses. The Gaussian width for the eclipse dip in this case ( = 0.21 days) is within the range of the widths for the short-duration flux dips we discuss in this paper. However, the regularity imposed in an EB system yields a very stable light curve which is easily distinguishable from light curves associated with variable circumstellar extinction.


4. Identification and Initial Characterization of YSOs with Short-Duration, Periodic Flux Dips in their Light curves
First results from our 2011-2012 intensive monitoring of NGC 2264 with CoRoT and Spitzer have been published in Cody et al. (2014) and Stauffer et al. (2014). While working on those papers, we noticed a small set of stars that shared some similarities but did not seem to fit into the primary groupings identified by Cody et al. Often, the “narrow” flux dips in these light curves are superposed on other, larger amplitude, types of variability – primarily semi-sinusoidal light curves normally attributed to photospheric spots – making identification of this new light curve signature more difficult.
These narrow flux dips presumably arise because some physical structure transits our line of sight to the stellar photosphere. As mentioned in the previous section, there is already a light curve class (AA Tau analogs) with periodic, variable extinction events and for which a standard physical model has been developed. It is possible that this new light curve class can be fit into the same physical model; however, we believe there are a number of reasons to consider alternate physical models which we will discuss in §7. To emphasize the primary morphological differences between the “classical” AA Tau analogs and our proposed new class, Figure 3 compares the average widths and depths of the flux dips for the new group of stars to those of the AA Tau analogs in NGC 2264 identified in the companion paper by McGinnis et al.222Primarily because our definition of the AA Tau class requires that the optical light curves satisfy two quantitative tests (Cody et al. 2014), our (Stauffer and Cody) list of NGC 2264 AA Tau analogs is slightly smaller than that of McGinnis et al. (2015). Specifically, we do not include Mon-358, Mon-654, Mon-1054, and Mon-1167; we also do not include Mon-56 and Mon-1131 because we instead place them in our new category of stars with narrow, periodic flux dips. While the distribution of points in Figure 3 could be regarded as simply one population with a range of properties, it could also be viewed as two populations whose properties only slightly overlap. The goal of this paper is to better characterize the light curves with these narrow flux dips, thereby determining if they should be considered as a new class of event or if they should simply be regarded as an extension of the AA Tau class. Throughout the paper, we use the terms “narrow” and “short-duration” interchangeably to describe the flux-dips of this set of stars, and “broad” (or long-duration) to describe the flux dips for the classic AA Tau light curves, with the dividing line being approximately FWHM/Period = 0.25 (see Figure 3).
In Table 1 and Table 2, we provide basic photometric and spectroscopic data for the nine stars which we believe fall into this “narrow-dip” group, compared to a total of 159 NGC 2264 CTTS with CoRoT light curves (McGinnis et al. 2015). All but one of these stars are previously identified members of NGC 2264 that had been classified as CTTS based on either H emission or SEDs. Spectral types are available for all of these objects, and all are low mass stars with spectral types of K5 or later. In the remainder of this section, we provide a brief description of each star and its light curve properties. In Table 3, we provide the fitted times, widths and depths of all the flux dips for these stars where those quantities could be determined accurately, and we give a label for each of these dips - the dip ID column of the table - primarily as a means for us to refer to specific dips in the text.
| Mon IDaaThe CSIMon IDs are our internal naming scheme for stars in the field of NGC 2264 – see Cody et al. (2014) and http://irsa.ipac.caltech.edu/data/SPITZER/CSI2264forRAsandDecsandalternativeIDs. In the main text of this paper, we omit the “CSI” and the leading zeros in the object names for brevity. | 2MASS ID | CoRoTbbCoRoT identification number in 2008 SRa01 campaign. | CoRoTccCoRoT identification number in 2011 SRa05 campaign. | SpTddSee Cody et al. (2014) and the Appendix for the sources of the spectral type and H equivalent width (EW) data. Here we use the convention that negative values are in emission, which is opposite to the convention in Cody et al. | H EW ddSee Cody et al. (2014) and the Appendix for the sources of the spectral type and H equivalent width (EW) data. Here we use the convention that negative values are in emission, which is opposite to the convention in Cody et al. | FR4.5eeFR4.5 is an estimate of the ratio of the flux from the disk to the flux from the stellar photosphere at 4.5 m, based on all the available broad-band photometry and the published spectral types. Because the SED models do not include veiling, these values are likely lower limits. | PeriodffPeriod determined in this paper, see Section 3. | L∗ggStellar luminosity and radius estimates from Venuti et al. (2014). | R∗ggStellar luminosity and radius estimates from Venuti et al. (2014). | RcohhCo-rotation radius; see formula in Bouvier et al. (1999). | RdiiDust sublimation radius; see formula in Monnier & Millan-Gabet (2002). We adopt values of 1500 K for the dust sublimation temperature, and minimum and maximum values of their QR parameter of 1.0 and 4.0, based on their Figure 2. |
|---|---|---|---|---|---|---|---|---|---|---|---|
| (Å) | (days) | (L⊙) | (R⊙) | (R⊙) | (R⊙) | ||||||
| CSIMon-000021 | 06405944+0959454 | 223980412 | 223980412 | K5 | -7.4 | 1.6 | 3.2 | 0.96 | 1.69 | 9.7 | 7.3/14.5 |
| CSIMon-000056 | 06415315+0950474 | 223994760 | 223994760 | K5 | -1.8 | 1.0 | 5.83 | 0.77 | 1.51 | 14.3 | 6.5/13.0 |
| CSIMon-000378 | 06405292+0944544 | 616872605 | K5.5 | -8.5 | 2.1 | 11.1 | 0.90 | 1.71 | 21.3 | 7.0/14.0 | |
| CSIMon-000566 | 06405275+0943004 | 400007955 | 400007955 | M3.5 | -19.4 | 0.9 | 4.5 | 0.16 | 1.23 | 7.3 | 2.9/5.9 |
| CSIMon-001076 | 06403819+0929524 | 400007702 | 605424384 | M1 | -2.6 | 0.6 | 5.85 | 0.26 | 1.25 | 10.4 | 3.8/7.5 |
| CSIMon-001131 | 06393441+0954512 | 223957455 | 223957455 | M1.5: | -31.1 | 1.4 | 5.2 | 0.55 | 2.02 | 8.9 | 5.5/11.0 |
| CSIMon-001165 | 06404192+0943551 | M3: | -7.9 | 1.3 | 5.5 | 0.13 | 1.15 | 8.5 | 2.7/5.3 | ||
| CSIMon-001580 | 06410285+1007119 | 223981250 | M1: | -17.2 | 0.6 | 7.1 | 0.27 | 1.28 | 11.9 | 3.8/7.7 | |
| CSIMon-006975 | 06395318+1001137 | 616803898 | M2.5: | -15. | 0.2 | 2.8 | 3.42 | 3.44 | 5.8 | 9.3/18.6 |
| Mon ID | [3.6] | [4.5] | [5.8] | [8.0] | [24] | |||||||
|---|---|---|---|---|---|---|---|---|---|---|---|---|
| CSIMon-000021 | 18.174 | 15.835 | 14.810 | 14.452 | 12.781 | 12.093 | 11.685 | 11.248 | 10.936 | 10.707 | 10.052 | 7.556 |
| CSIMon-000056 | 18.785 | 16.205 | 15.056 | 14.475 | 12.959 | 12.302 | 12.003 | 11.717 | 11.390 | 11.038 | 10.290 | 7.866 |
| CSIMon-000378 | 18.277 | 16.142 | 14.943 | 14.239 | 12.699 | 11.862 | 11.267 | 10.882 | 10.540 | 10.091 | 9.371 | 6.270 |
| CSIMon-000566 | 20.988 | 19.109 | 17.747 | 16.418 | 14.318 | 13.588 | 13.279 | 12.823 | 12.576 | 12.140 | 11.132 | |
| CSIMon-001076 | 20.754 | 18.336 | 16.896 | 16.012 | 13.931 | 13.194 | 12.891 | 12.485 | 12.289 | 12.025 | 11.278 | 8.566 |
| CSIMon-001131 | 18.769 | 17.180 | 15.832 | 14.856 | 12.991 | 12.215 | 11.932 | 11.492 | 11.152 | 10.893 | 10.195 | 6.998 |
| CSIMon-001165 | 21.924 | 19.528 | 17.983 | 16.427 | 14.679 | 13.845 | 13.582 | 13.043 | 12.789 | 12.380 | 11.571 | |
| CSIMon-001580 | 20.489 | 17.976 | 16.553 | 15.678 | 13.978 | 13.218 | 12.874 | 12.624 | 12.455 | 12.223 | 11.244 | 8.013 |
| CSIMon-006975 | 20.027 | 17.974 | 16.626 | 13.476 | 12.576 | 12.151 | 11.666 | 11.56 | 11.10 |
Note. — Broad-band photometry for the stars from Table 1, in AB magnitudes for but in Vega magnitudes for longer wavelengths. The data are from CFHT, as reported in Venuti et al. (2014); the data are from the on-line 2MASS all-sky point source catalog; the IRAC data are from Sung et al. (2009), or from our own analysis of archival IRAC imaging. Typical photon-noise and calibration uncertainties for these magnitudes are of order 0.02 mag; however, because all of these stars are photometric variables with amplitudes up to several tenths of a magnitude, these single-epoch data could differ from absolute, time-averaged values by 0.1 mag or more.
4.1. Mon-21
Mon-21, also known as V602 Mon, is a relatively poorly studied member of NGC 2264 of spectral type K5 (Rebull et al. 2002), with weak H emission (Furesz et al. 2006) and a relatively modest IR excess. It has no discernible ultraviolet (UV) excess (Venuti et al. 2014). We obtained CoRoT light curves for it in both 2008 and 2011, and an IRAC light curve for it in 2011.
| Mon ID | Year | Dip ID | Center (days) | Width (days) | Percent Depth |
|---|---|---|---|---|---|
| MJD-50000. | |||||
| CSIMon-000021 | 2008 | A1 | 4535.39 | 0.17 | 10% |
| CSIMon-000021 | 2008 | A2 | 4536.15 | 0.17 | 7% |
| CSIMon-000021 | 2008 | B | 4541.99 | 0.18 | 7% |
| CSIMon-000021 | 2008 | C | 4545.07 | 0.18 | 5% |
| CSIMon-000021 | 2008 | D | 4548.47 | 0.17 | 12% |
| CSIMon-000021 | 2008 | E1 | 4554.73 | 0.16 | 10% |
| CSIMon-000021 | 2008 | E2 | 4555.60 | 0.15 | 4% |
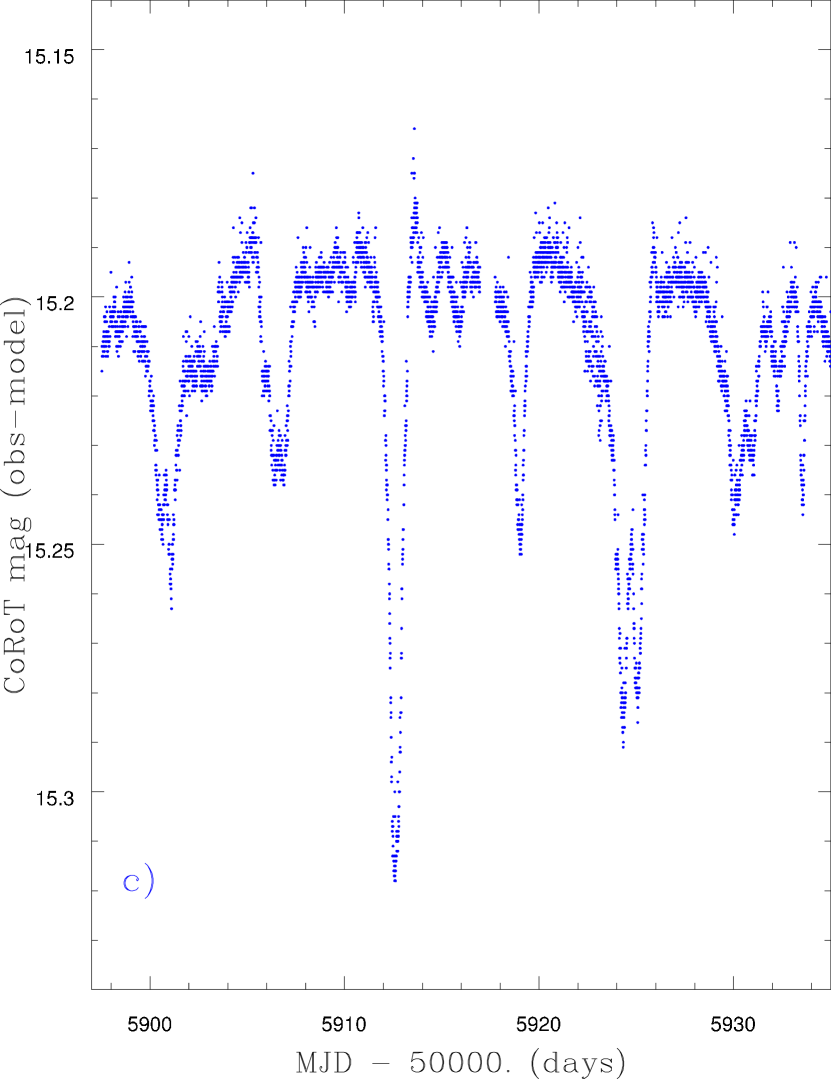
| CSIMon-000021 | 2011 | A | 5897.65 | 0.22 | 10% |
| CSIMon-000021 | 2011 | B1 | 5900.35 | 0.35 | 2.5% |
| CSIMon-000021 | 2011 | B2 | 5900.77 | 0.29 | 4.5% |
| CSIMon-000021 | 2011 | C | 5910.29 | 0.26 | 8% |
| CSIMon-000021 | 2011 | D1 | 5913.10 | 0.33 | 3.5% |
| CSIMon-000021 | 2011 | D2 | 5913.30 | 0.11 | 3.5% |
| CSIMon-000021 | 2011 | D3 | 5913.64 | 0.18 | 6% |
| CSIMon-000021 | 2011 | E | 5916.31 | 0.41 | 4% |
| CSIMon-000021 | 2011 | F1 | 5919.23 | 0.38 | 4.5% |
| CSIMon-000021 | 2011 | F2 | 5919.73 | 0.25 | 6.5% |
| CSIMon-000021 | 2011 | G1 | 5922.51 | 0.25 | 6.0% |
| CSIMon-000021 | 2011 | G2 | 5922.96 | 0.20 | 8.2% |
| CSIMon-000021 | 2011 | H1 | 5925.04 | 0.34 | 1.5% |
| CSIMon-000021 | 2011 | H2 | 5925.86 | 0.29 | 10% |
| CSIMon-000021 | 2011 | I1 | 5928.60 | 0.35 | 5.5% |
| CSIMon-000021 | 2011 | I2 | 5929.20 | 0.27 | 10% |
| CSIMon-000021 | 2011 | J1 | 5931.79 | 0.39 | 4% |
| CSIMon-000021 | 2011 | J2 | 5932.37 | 0.23 | 12% |
| CSIMon-000056 | 2011 | A | 5912.63 | 0.32 | 12.5% |
| CSIMon-000056 | 2011 | B | 5919.00 | 0.25 | 5.5% |
| CSIMon-000056 | 2011 | C1 | 5924.30 | 0.25 | 8.3% |
| CSIMon-000056 | 2011 | C2 | 5925.08 | 0.27 | 7.7% |
| CSIMon-001165 | 2011 | A | 5911.87 | 0.20 | 25% |
| CSIMon-001165 | 2011 | B | 5922.83 | 0.15 | 14% |
| CSIMon-006975 | 2011 | A1 | 5905.54 | 0.10 | 15% |
| CSIMon-006975 | 2011 | A2 | 5905.82 | 0.10 | 12% |
| CSIMon-006975 | 2011 | B | 5908.36 | 0.13 | 14% |
| CSIMon-006975 | 2011 | C | 5910.94 | 0.10 | 7% |
| CSIMon-006975 | 2011 | D | 5919.59 | 0.11 | 11% |
| CSIMon-001131 | 2011 | A | 5901.06 | 0.30 | 24% |
| CSIMon-001131 | 2011 | B | 5906.14 | 0.30 | 23% |
| CSIMon-001131 | 2011 | C1 | 5910.66 | 0.27 | 12% |
| CSIMon-001131 | 2011 | C2 | 5911.03 | 0.18 | 10% |
| CSIMon-001131 | 2011 | C3 | 5911.56 | 0.36 | 11% |
| CSIMon-001131 | 2011 | D | 5926.75 | 0.75 | 13% |
| CSIMon-001131 | 2011 | E1 | 5931.66 | 0.34 | 6.5% |
| CSIMon-001131 | 2011 | E2 | 5932.04 | 0.14 | 10% |
| CSIMon-001131 | 2011 | E3 | 5932.31 | 0.15 | 12% |
| CSIMon-001580 | 2008 | A1 | 4541.73 | 0.18 | 13% |
| CSIMon-001580 | 2008 | A2 | 4542.15 | 0.24 | 9% |
| CSIMon-001580 | 2008 | B1 | 4548.53 | 0.15 | 6% |
| CSIMon-001580 | 2008 | B2 | 4548.7 | 0.06 | 5% |
| CSIMon-001580 | 2008 | B3 | 4548.98 | 0.17 | 8% |
| CSIMon-001580 | 2008 | C | 4554.83 | 0.20 | 25% |
| CSIMon-000378 | 2011 | A | 5918.64 | 0.55 | 14% |
| CSIMon-001076 | 2008 | A | 4538.65 | 0.17 | 15.7% |
| CSIMon-001076 | 2008 | B | 4550.54 | 0.16 | 13% |
| CSIMon-001076 | 2008 | C | 4556.20 | 0.15 | 12.5% |
| CSIMon-000566 | 2011 | A | 5909.33 | 0.32 | 5% |
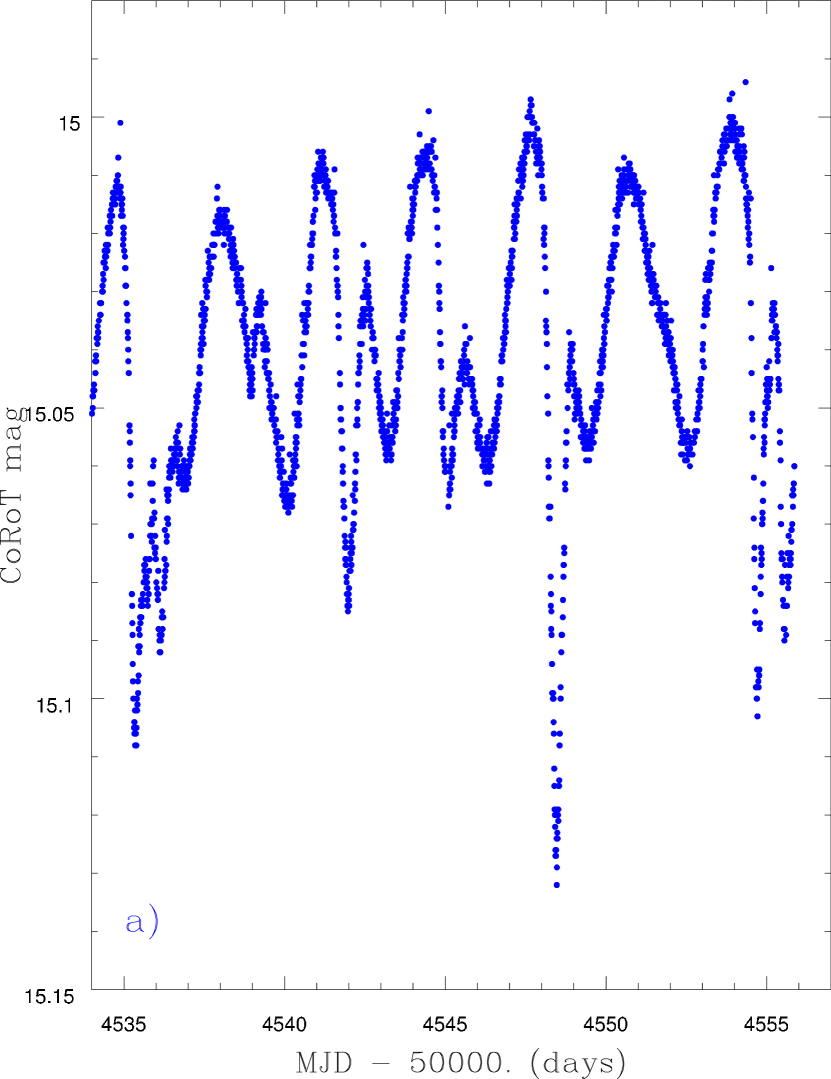
4.1.1 Mon-21 (2008 CoRoT campaign)
The as-observed CoRoT light curve for Mon-21 in 2008 (Figure 4a) appears relatively complex because, we believe, it is a superposition of two distinctly different waveforms arising from two different physical mechanisms. Specifically, we ascribe the broad, semi-sinusoidal variation to rotational modulation due to the presence of a large, high latitude spot group on the star’s photosphere. The narrow flux dips that are also present are the component we wish to isolate and quantify. The two waveforms appear to have nearly identical periods, and to produce features of very similar amplitude.
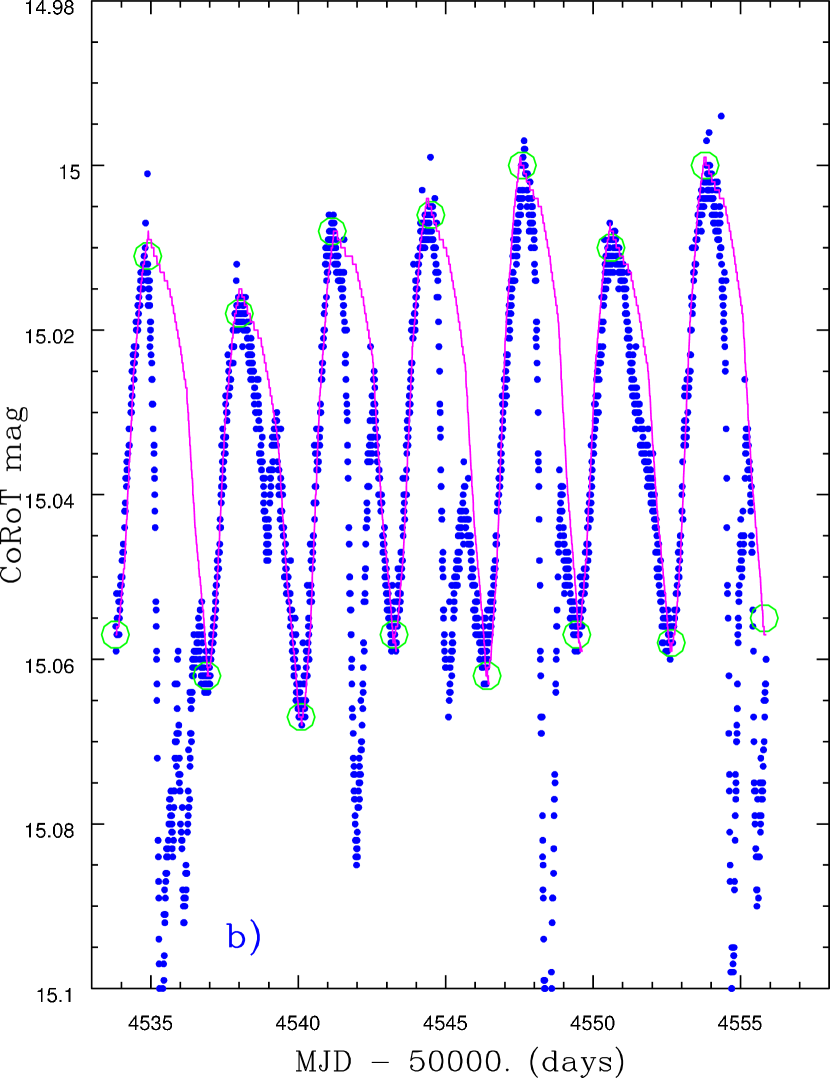
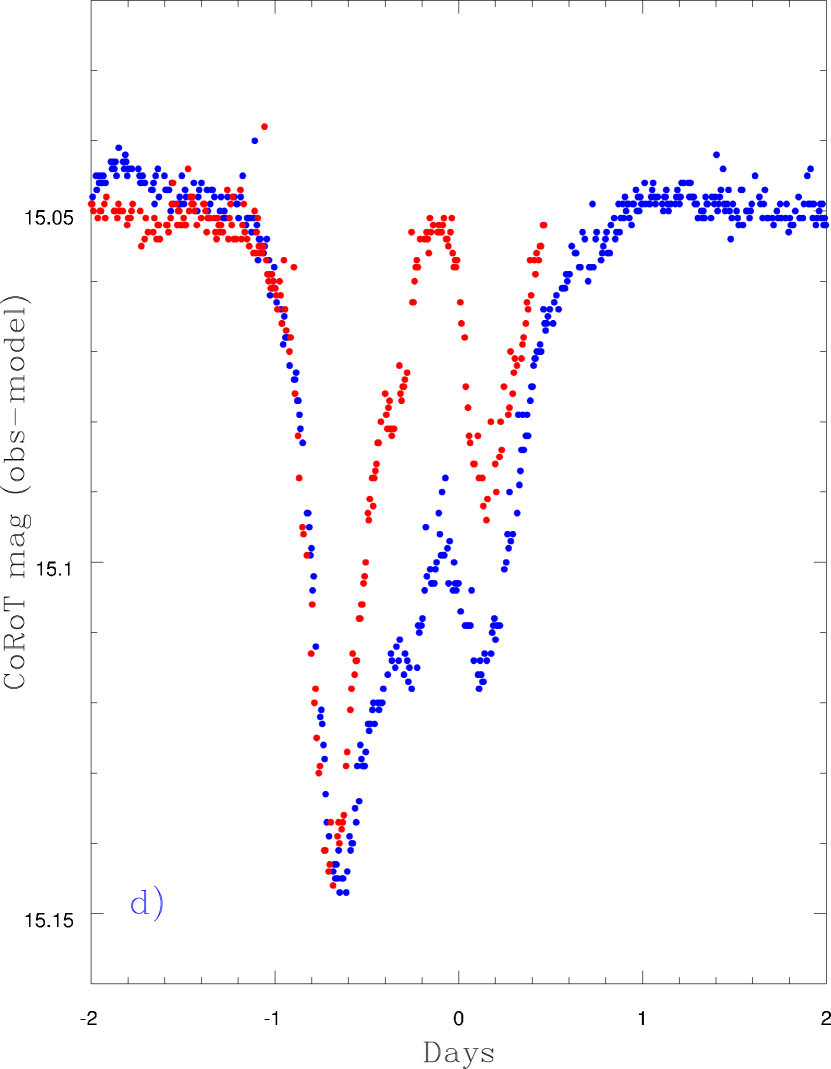
In order to measure accurately the properties of the flux dips, it is necessary to remove the comparatively smoothly varying, semi-sinusoidal pattern. We construct a model light curve to emulate the sinusoidal variation by taking the CoRoT data from day MJD 4537.4 to 4540.6, the portion of the light curve least affected by narrow flux dips, and use those data to produce a sine-wave-like template covering one full period (3.22 days). (The light curve interval from 4550 to 4553 is also relatively clean, but we felt that the inflection in the curve presumably due to a narrow dip was harder to eliminate unambiguously compared to the earlier time interval.) From examination of the light curve, we mark beginning points (flux and time) for each cycle, which are indicated as the lower green circles in Figure 4b. A linear correction term is added to the flux for each replicated template so that its ending flux matches the next cycle’s beginning flux. Finally, we slightly adjust the amplitude of each waveform (by multiplying all the measurements in that replicated waveform by a constant) so that the maximum brightness matches the observed maximum at that epoch (upper green circles in Figure 4b). The model light curve is shown in red in Figure 4b; the result of subtracting this model from the observed light curve – and hence our representation of the light curve solely due to variable extinction events – is shown in Figure 4c. We made no further adjustments to the model to better fit the observed data other than the deterministic steps described above. We note that the first and last of the narrow dips are in fact double-dips, with the second dip being shallower and offset by of order 0.8 days in both cases (see Figure 4d).
We have ascribed the sinusoidal variations to non-axisymmetrically distributed star spots on the stellar photosphere – probably cold spots. Could it instead be ascribed to variable extinction due to a warped disk intersecting our line of sight? We offer two arguments in favor of our hypothesis and counter to the alternative. First, we know what the light curves of YSOs with typical warped disks look like because there are many of them in NGC 2264 (see the companion paper to this, McGinnis et al. 2015). Those light curves look nothing like the semi-sinusoidal pattern shown in red in Figure 4b; the warped disk light curves are much more irregularly shaped and much more time variable. Second, we also know that light curves dominated by non-axisymmetrically distributed, high-latitude spots are common amongst YSOs (Herbst 1986; Bouvier & Bertout 1989) and their light curves closely resemble the red curve in Figure 4b. In fact, we have identified one CTTS in NGC 2264 – Mon-103 – whose CoRoT light curve is nearly identical, except for minor scale factors, to the red curve in Figure 4b. We provide a quantitative comparison of the 2008 Mon-21 light curve and that for Mon-103 in the Appendix.
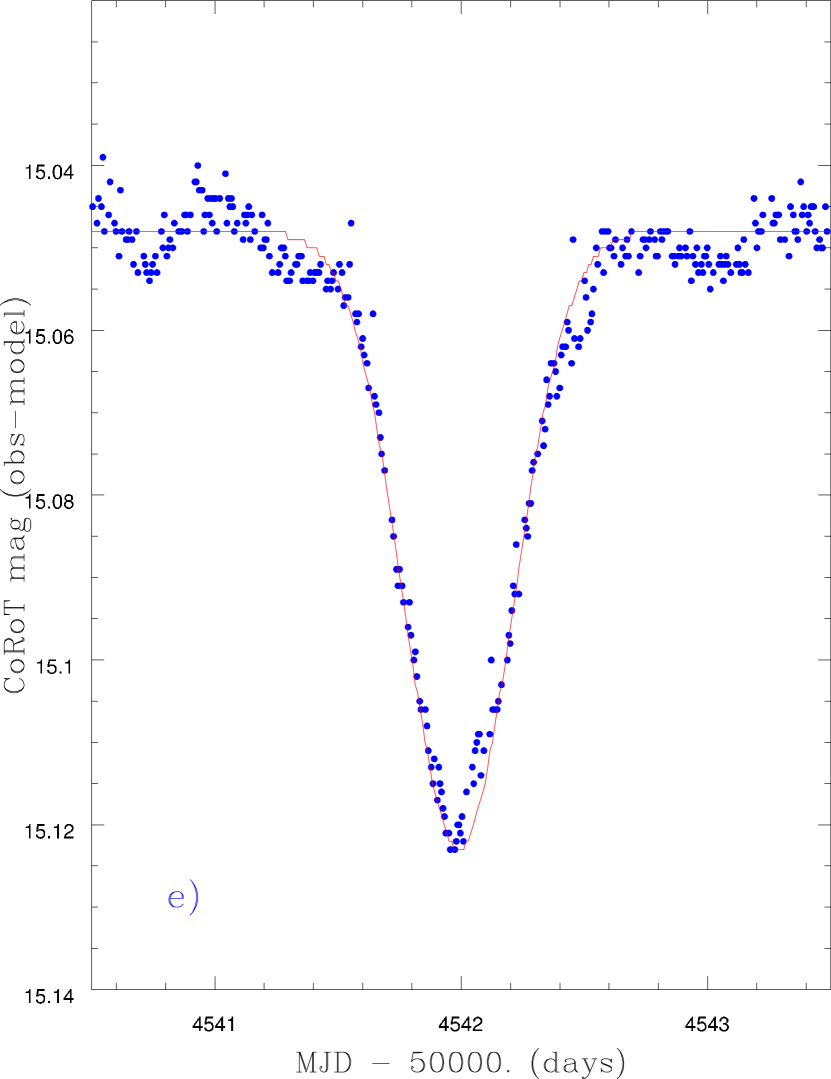
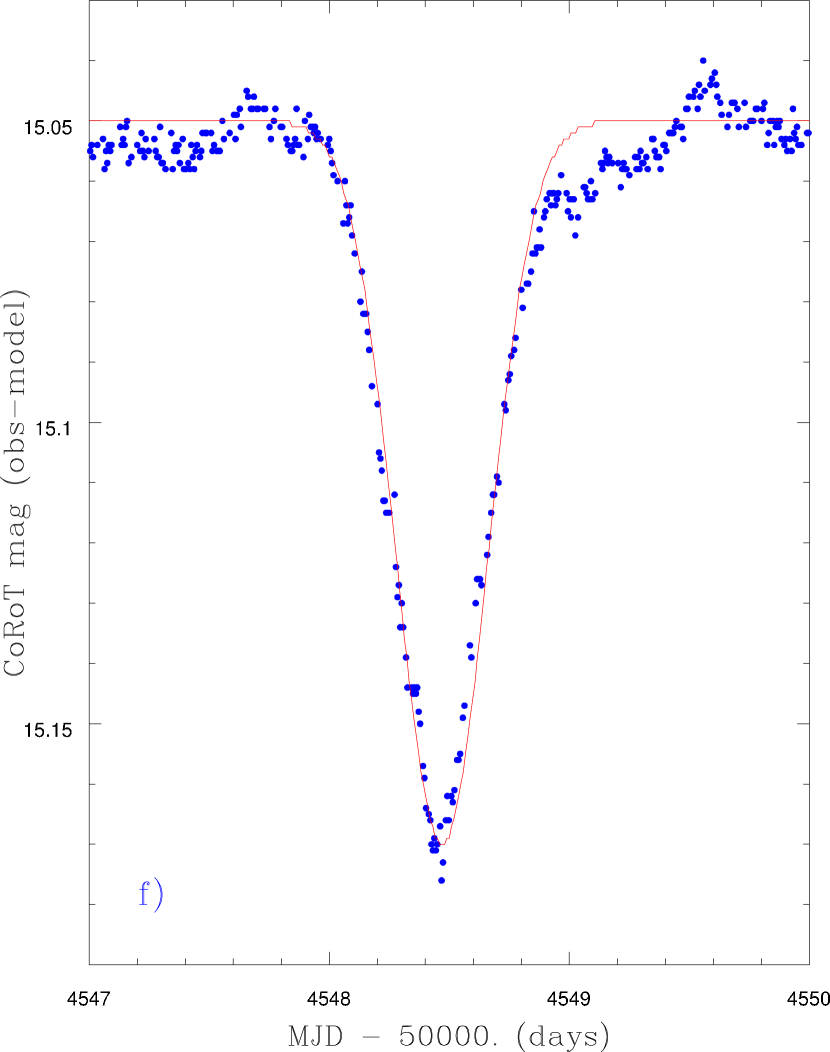
Figures 4e and f compare a Gaussian fit to the observations for the dips that are narrowest and best fit by such a model (dips B and D - see Table 3). The derived times, Gaussian widths and dip depths (as a percentage of the “continuum” flux) are provided in Table 3. Most of the dips are well fit, and most have widths in the narrow range from 0.15 to 0.18 days.
The semi-sinusoidal pattern and the narrow flux dips both have apparent periodicities of about 3.2 days. However, are the dips exactly periodic? And, are the periods for the semi-sinusoidal waveform and the dips precisely the same? The answer to the first question is no, as can be seen from examination of the data in Table 3. The centroids of each dip can be measured to an accuracy of a few hundredths of a day, yet dip B and C are separated by 3.08 days, while dips C and D are separated by 3.40 days. Applying the period-finding algorithm of Plavchan et al. (2008b) to the light curve for just the flux dips (Figure 4c) yields a period of 3.224 days; a similar estimate of 3.223 days is obtained by subtracting the measured times for dip E1 and A1 and assuming they are separated by six periods. The Lomb-Scargle algorithm yields a period of 3.15 days for the semi-sinusoidal pattern (represented either just by the red curve in Figure 4b or by the residual remaining after subtracting the Gaussian fits from the original light curve). Given the real variations in the timing of the flux dips and the comparative shortness of our CoRoT campaign, we cannot conclude the two periods are significantly different.
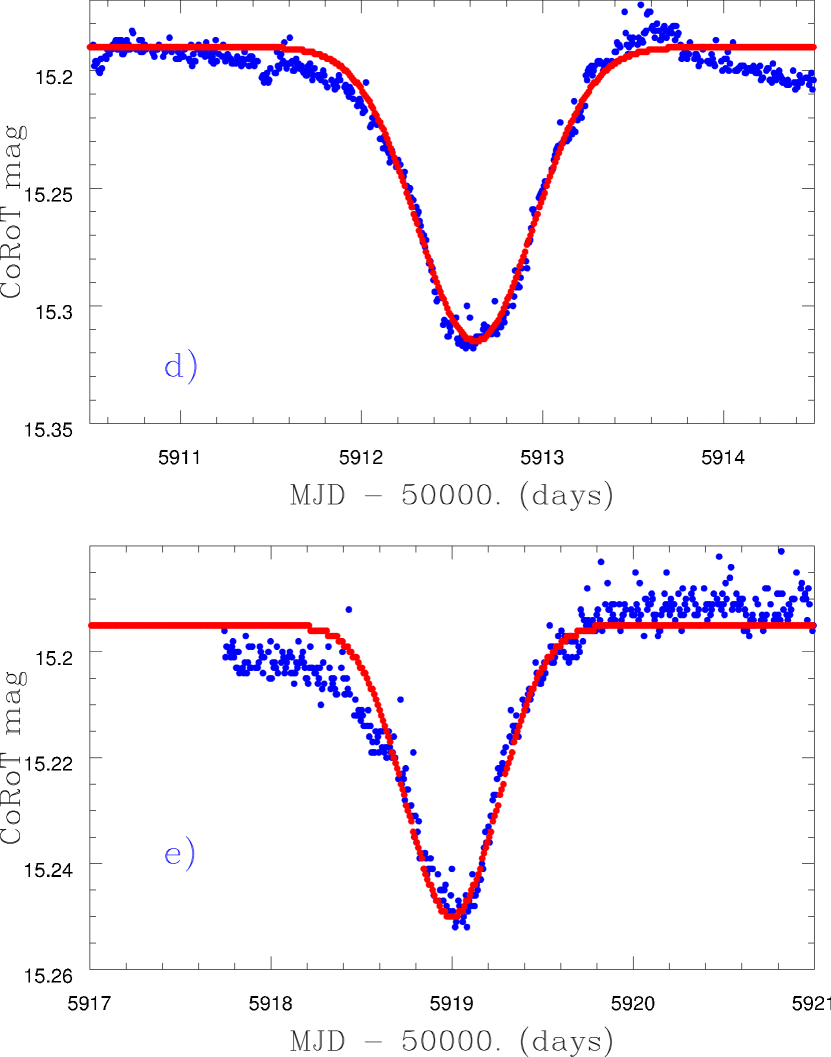
4.1.2 Mon-21 (2011 CoRoT campaign)
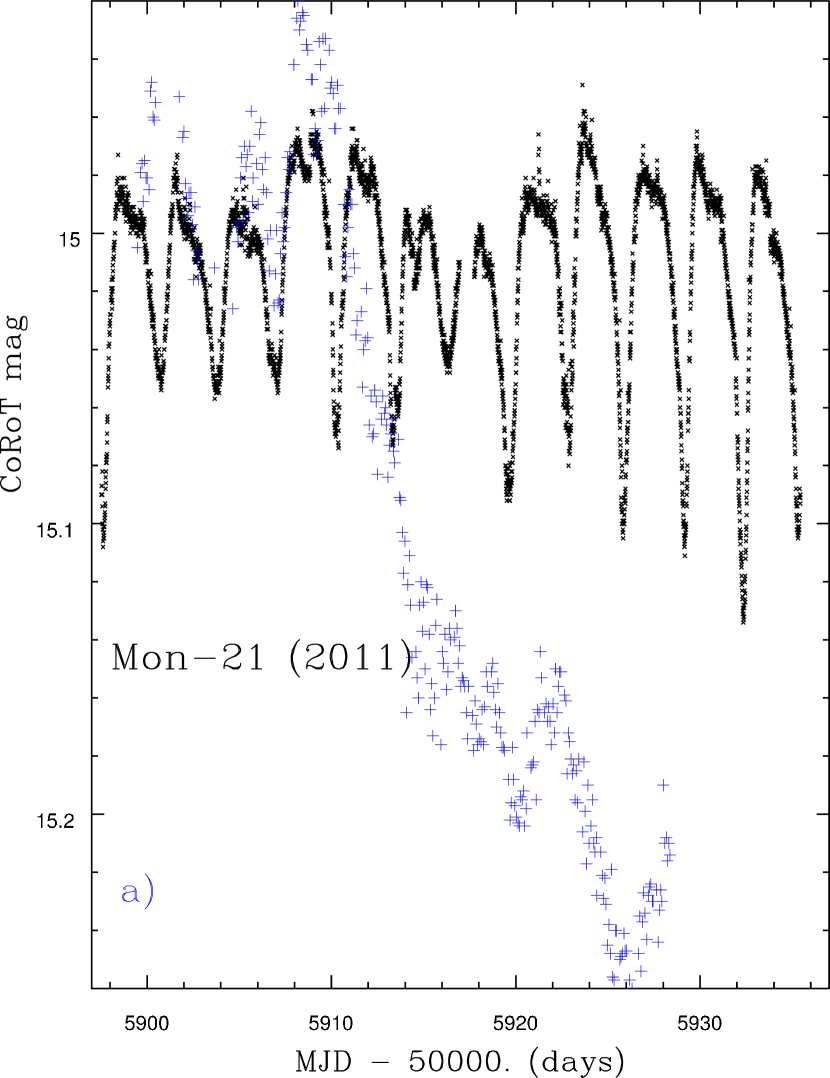
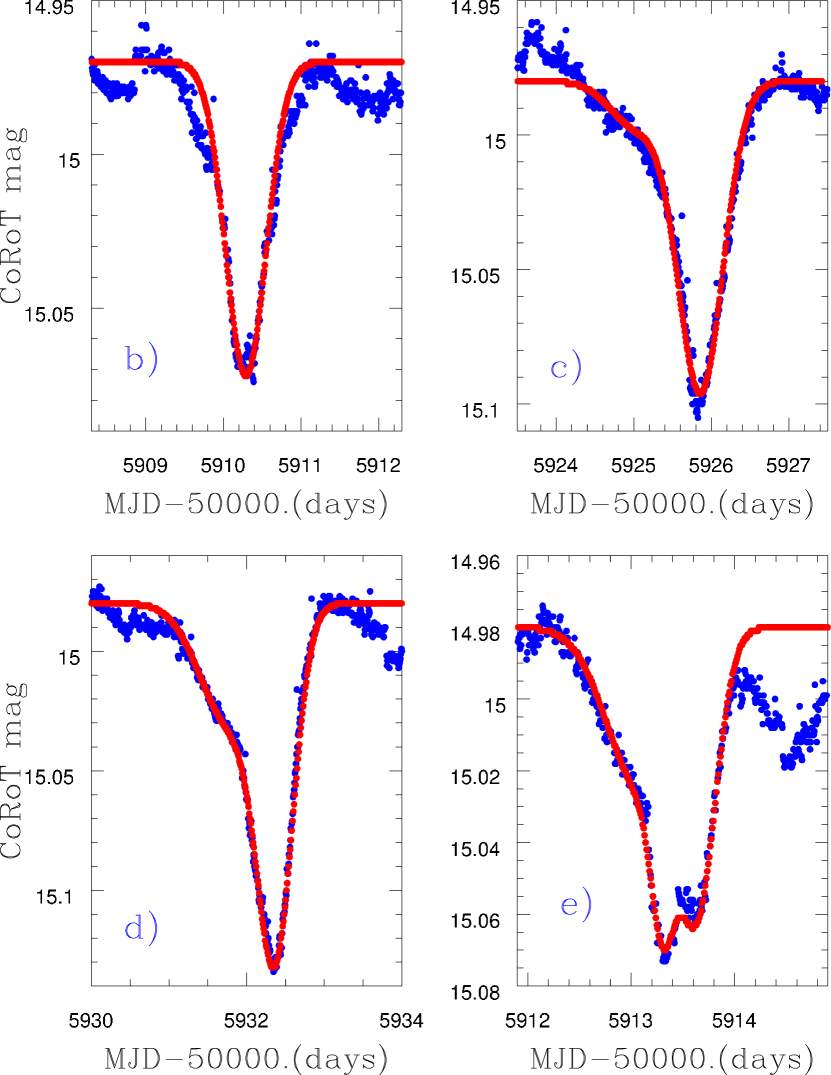
By 2011, the CoRoT light curve for Mon-21 changed morphology, as illustrated in Figure 5a. The semi-sinusoidal pattern is either essentially absent or much reduced in amplitude. The flux dips appear somewhat broader and in many cases asymmetric. One possibility is that we are still seeing a blend of a spotted waveform and narrow flux dips from variable extinction, with the spot being responsible for the weaker feature causing the apparent asymmetry in each observed waveform; another possibility is that spots no longer contribute in any significant way and the observed waveforms are due to the blend of two narrow dips. In order to document the full light curve shape, we have chosen to simply model the observed features with Gaussian fits, usually with two components; the fits to a number of the dips are shown in Figure 5. On average, the primary dip at each epoch has a Gaussian sigma width of 0.260.02 days, about 50% broader than the dips in 2008. The weaker secondary dips always precede the deeper dip. See Table 3 for the fit parameters. The average period inferred from the dip centroids is 3.160.02 days, somewhat different from the dip period in 2008, but essentially equal to the period for the sinusoidal waveform we attribute to spots on the stellar surface.
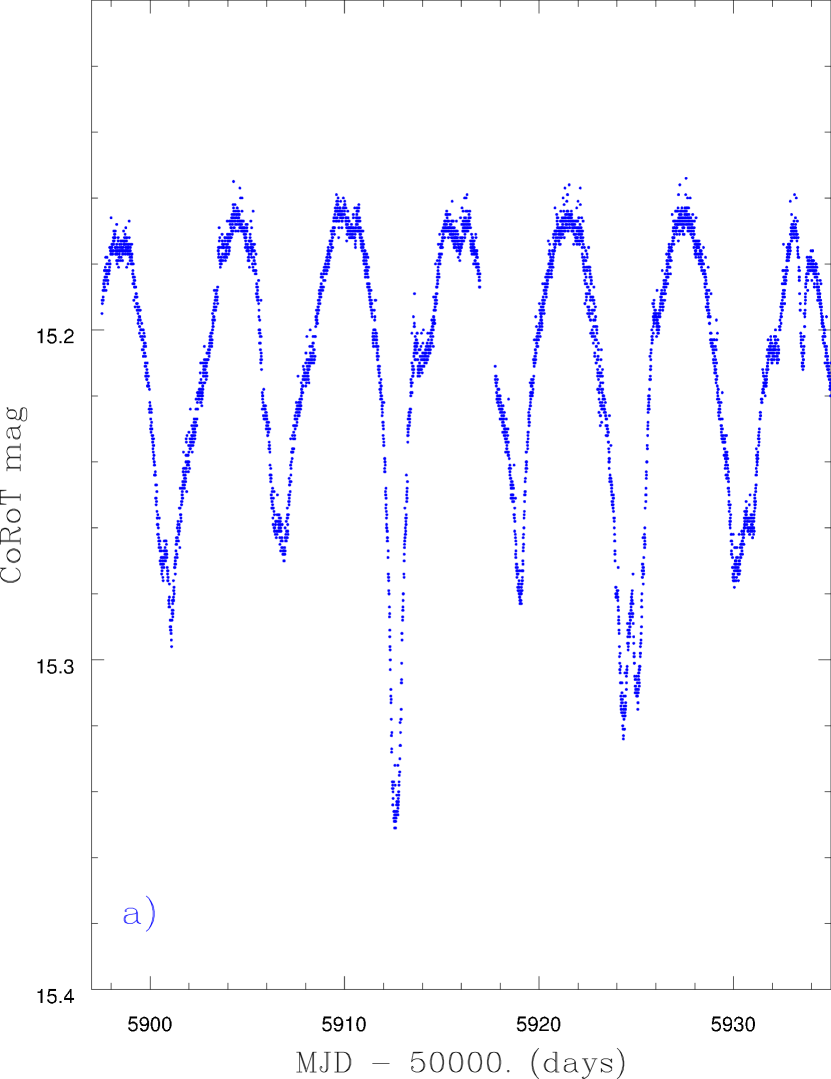
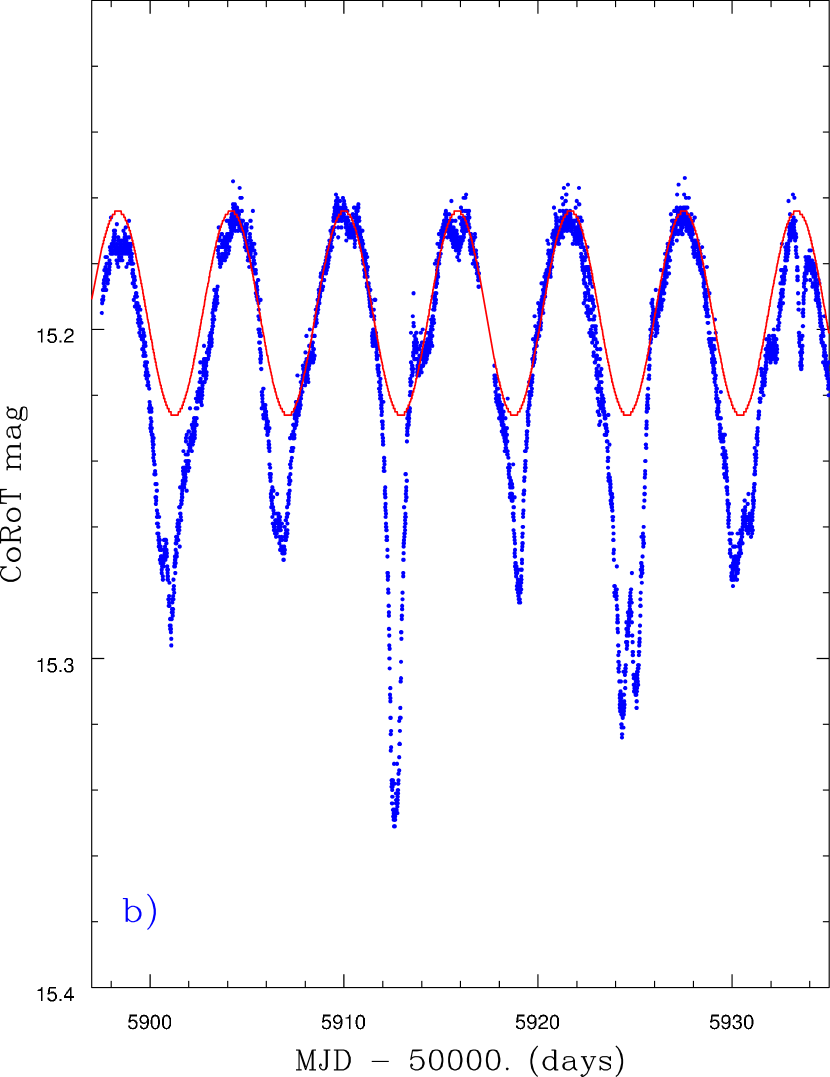
A ground-based USNO -band light curve for Mon-21 is available that overlaps in time with the CoRoT light curve. For a star of Mon-21’s I magnitude, the expected RMS uncertainty in the relative USNO photometry is about 0.02 mag. Because the CoRoT data have significantly lower noise and higher cadence, they provide the best measure of the shape of the flux dips. However, the USNO data extend beyond the CoRoT campaign by nearly two months, and therefore provide valuable information as to the persistence and amplitude variability of the flux dips. Figure 6a shows an expanded view of the region of best overlap between the CoRoT and USNO data; Figure 6b shows the entire USNO light curve. These data illustrate that the same flux dip structure is detected in the ground-based data, and that it persists for at least twenty days after the end of the CoRoT campaign. Because the ground-observing only provided data for about 5-6 hours per night, the window function for detecting the flux dips in the USNO data is not very good and it is not possible to deduce whether similar depth flux dips persisted beyond MJD 55960.


We also obtained a Spitzer/IRAC [3.6] light curve for Mon-21 in 2011. As shown in Cody et al. (2014), for a star of Mon-21’s brighness, the expected RMS uncertainty in the relative IRAC photometry should be of order 1%. The most obvious feature of the IRAC light curve is a gradual flux decrease of 0.25 mag beginning around MJD 55910. On small timescales, there are possible correspondences between the CoRoT flux dips and features in the IRAC data, but there are also places where there is no correspondence. Given the shallowness of the dips in the CoRoT data, and that the disk contributes equal or more light at [3.6], the lack of distinct dips in the IR is not unexpected.
4.2. Mon-56
In many respects, Mon-56 is a near twin to Mon-21. It also has a published spectral type of K5 (Dahm & Simon 2005), H emission with an inverse P-Cygni profile but quite small equivalent width (Furesz et al. 2006), essentially no UV excess and IR colors placing it near the center of the Class II population in the IRAC color-color diagram (Allen et al. 2004). Similar to Mon-21, we interpret its CoRoT light curve in 2011 as also being the superposition of two components with essentially identical periods - a smoothly varying, semi-sinusoidal component, possibly due to star-spots and a system of periodic, shallow, short duration flux dips which are sometimes single and sometimes double. Figure 7a shows the as-observed CoRoT light curve.
Compared to Mon-21, however, the Mon-56 light curve is more difficult to deconvolve because the flux dips are generally stronger and broader and in phase with the flux minima of the sinusoidal waveform, thereby making it harder to construct a high quality model for the spotted light curve (or to be certain that this component is indeed due to spots as opposed to a warped-disk model). We have therefore resorted to a lower fidelity but simpler model for the smoothly varying component of the light curve – specifically, we adopt a simple sine-wave, whose phase, amplitude and period we set to yield the best fit (i.e. to yield a residual light curve with a nearly flat continuum level interspersed with narrow dips). Figure 7b shows our final model for the smoothly varying component of the light curve superposed on the observed Mon-56 light curve, and Figure 7c shows the result of subtracting this model from the observations, yielding our best visualization of the short-duration flux dips in this star. The full amplitude of the adopted sinusoid is 0.06 mag (about 6%), and the period is 5.83 days (the same as determined from ground-based monitoring by Lamm et al. 2004). Because of the approximate nature of the deconvolution, we attempt to derive flux dip fits only for the three strongest features in Figure 7c. Those parameters are provided in Table 3 and the fits are illustrated for the apparently single flux dips in Figure 7d and e.
We note that the Mon-56 CoRoT data are interpreted differently in McGinnis et al. (2015). McGinnis et al. attribute all of the variability seen in the system to variable extinction, as opposed to a superposition of spot and extinction variability. Regardless of these differences, both models agree that the narrow, periodic flux dips are best attributed to extinction and we therefore believe Mon-56 fits within the class of variability discussed in this paper.
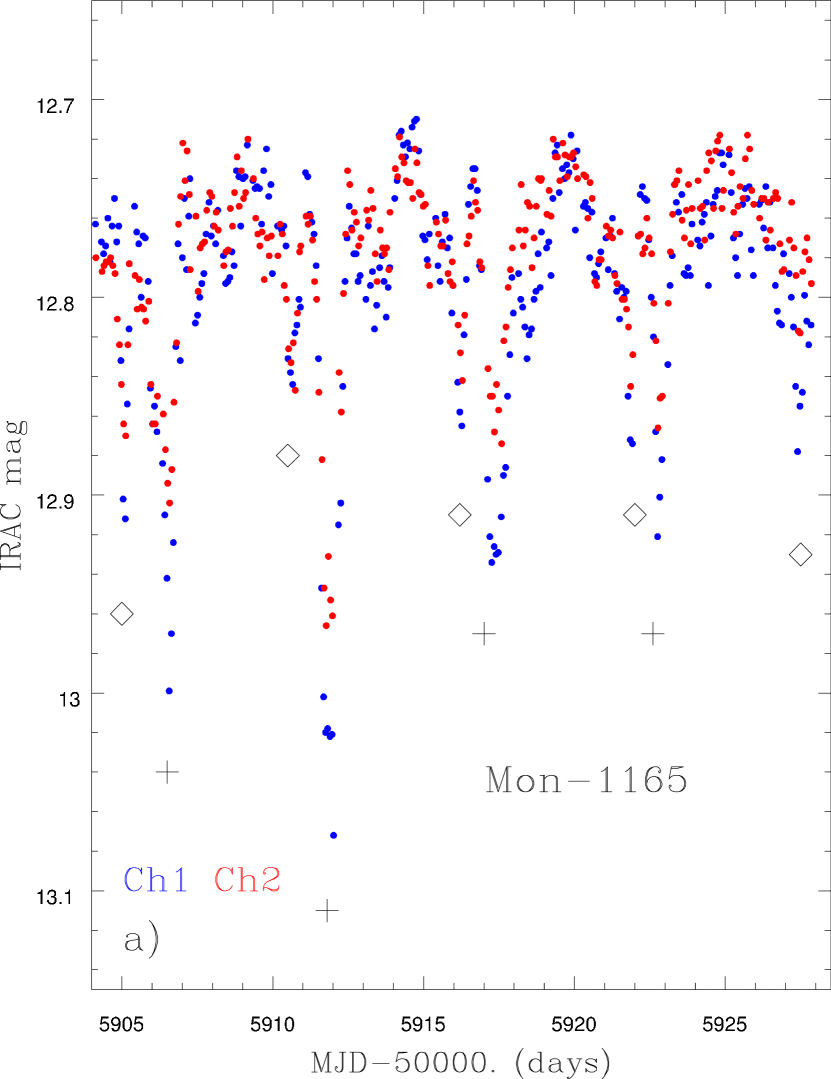
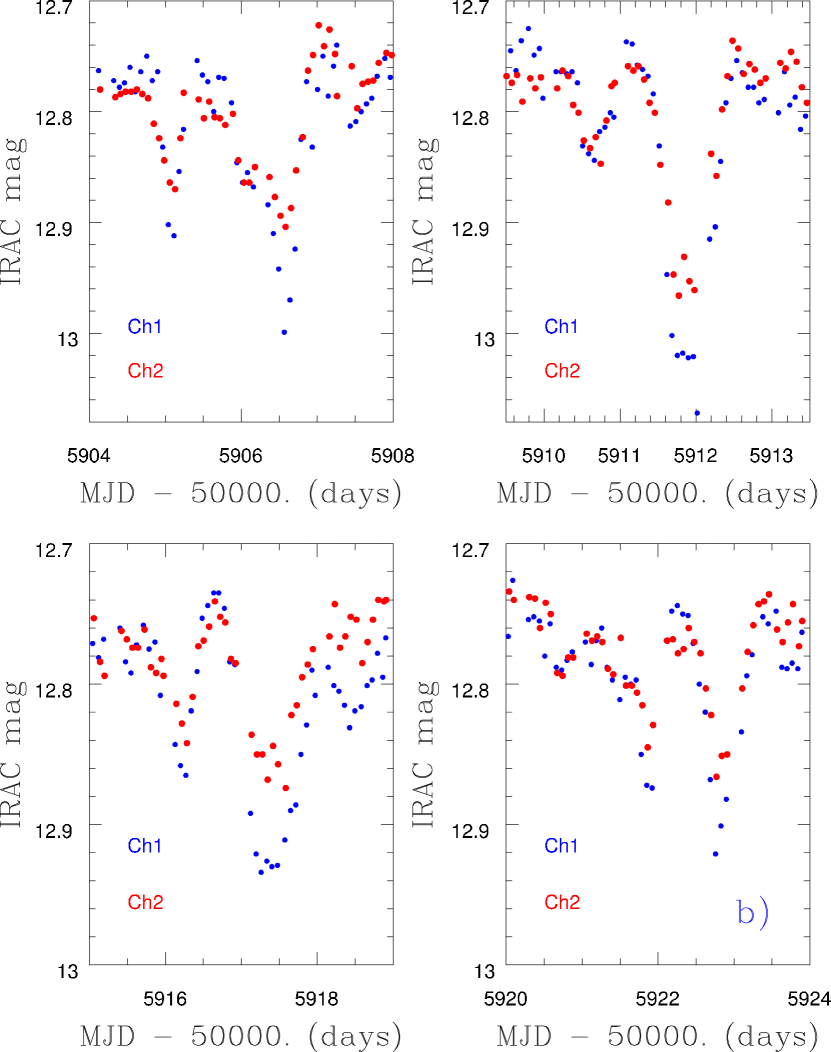
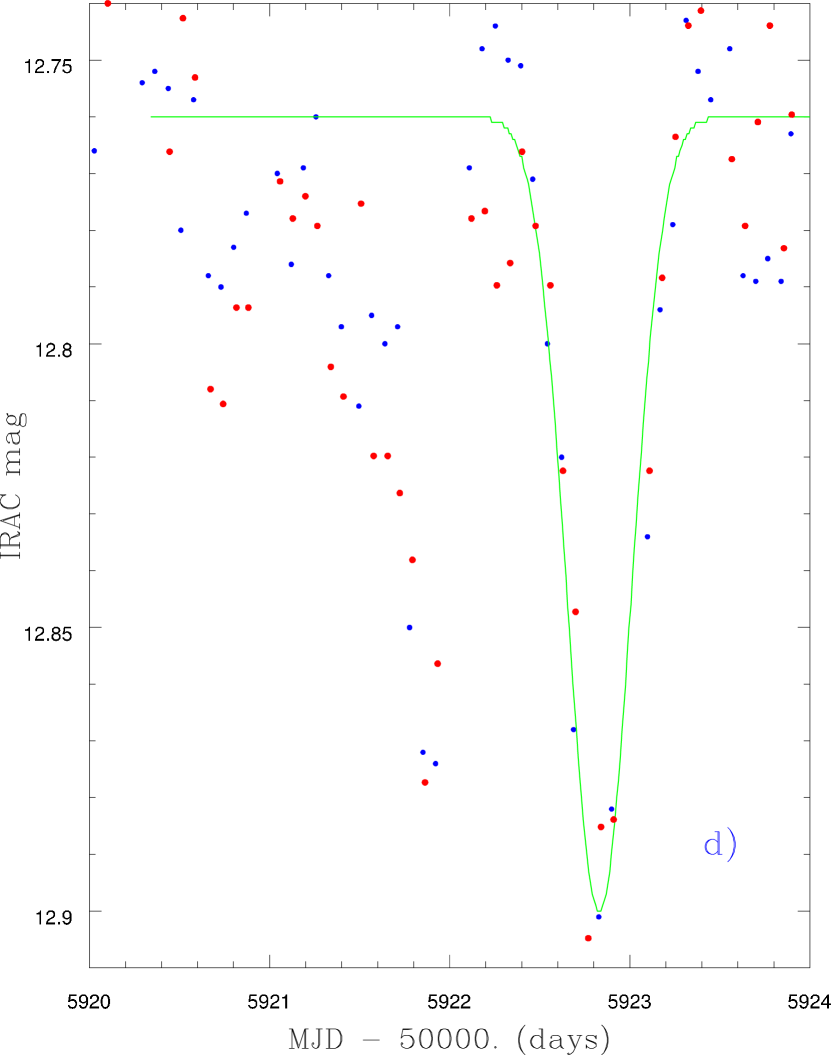
4.3. Mon-1165
Mon-1165 has spectral type M3 (see appendix). In an IRAC color-color diagram, it falls within the box defining the locus for Class II YSOs (Allen et al. 2004). However, as for the previous two YSOs, it has essentially no UV excess, and only a weak H emission line.
We do not have a CoRoT light curve for Mon-1165, but the IRAC light curve shows distinct, narrow, periodic, short-duration, paired flux dips (see Figure 8a). An auto-correlation analysis of the light curve yields a period for the flux dips of 5.5 days. The lower amplitude dip always precedes the main dip by about 1.2 days (see Figure 8b). The flux dips are generally deeper at 3.6 m than at 4.5 m by, on average, about 50% but this is poorly determined due to the shallowness and narrowness of the dips and the relatively low cadence of the observations. Only two of the dips are well-enough defined to accurately measure their shape and width – those fits are shown in Figure 8c and d; the Gaussian values for the two fits are 0.15 and 0.20 days.
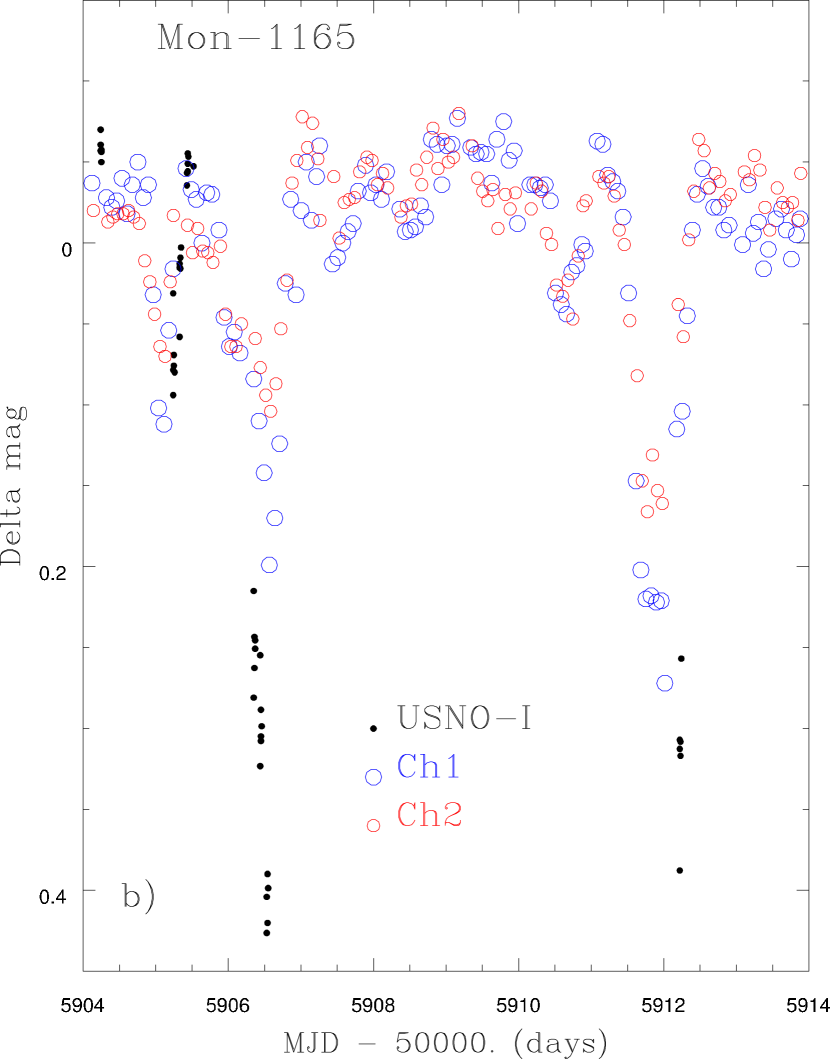
We have ground-based, optical, synoptic photometry which only overlap with a small portion of the Spitzer data due to bad weather in Arizona in December 2011. Figure 9a shows the entire USNO light curve, illustrating that at least a few flux dips are present beyond the end of the CoRoT campaign. Figure 9b overplots the IRAC and USNO data for the time window where we have some optical data that falls at or near the center of one of the strong IR flux dips. The ratio of the dip depth at 4.5 m to the depth in the I band – – is about 0.3. In order to use this ratio to help constrain the occultation geometry, we must make a correction for the fraction of the IR light that comes from the disk (assuming the disk flux is not significantly occulted). Based on a fit to the star’s SED, our estimate of f4.5(disk)/f4.5(star) is 1.3; hence the corrected dip depth ratio becomes 0.7. Given the uncertainties, this is consistent with equal dip depths at both wavelengths, as one would expect from dust structures that are optically thick but cover only a small part of the star. If instead the dust structures are optically thin, this ratio would indicate an extreme deficit of small particles compared to the standard ISM mixture where the ratio should be 0.10 (Indebetouw et al. 2005).

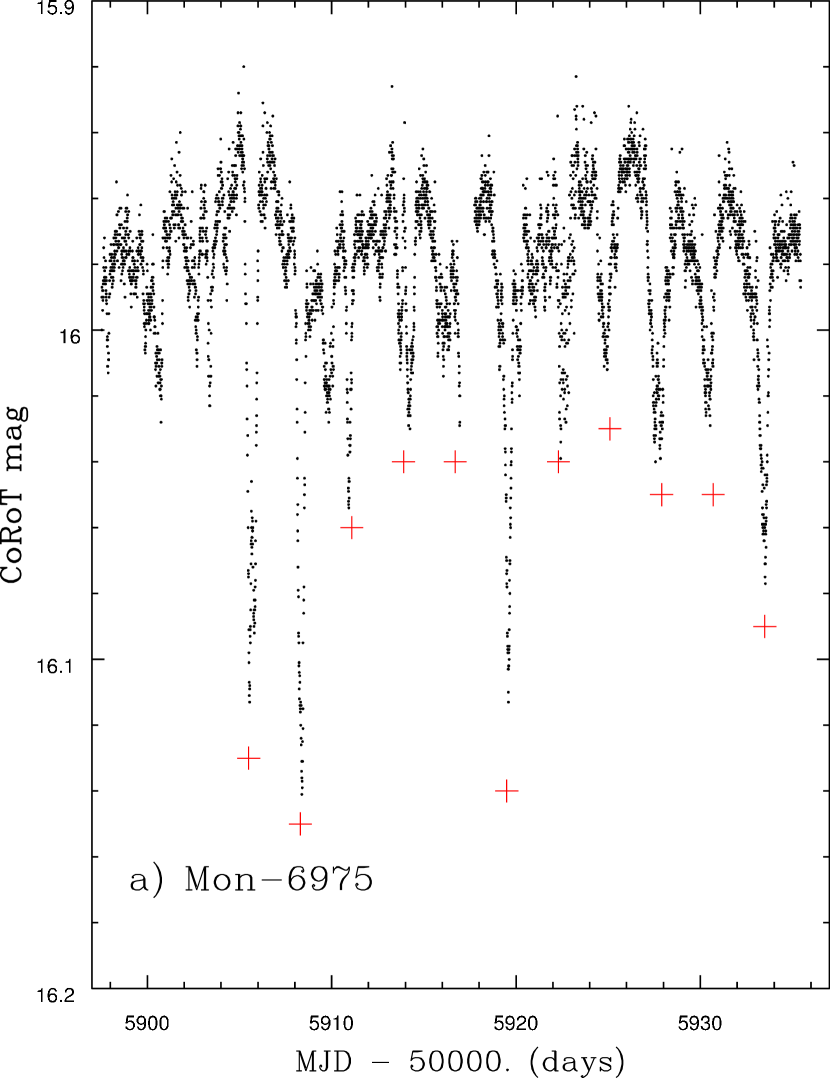
4.4. Mon-6975
Mon-6975 is another essentially anonymous star that had not even been considered an NGC 2264 member until now. Our attention was drawn to this star by its 2011 CoRoT light curve (it was not observed by CoRoT in 2008). We have subsequently obtained optical and IR spectra of it from SOAR (see Appendix) which indicate a spectral type of M2.5 and moderately strong H emission (H equivalent width = 15 Å). Good seeing images show it to be a nearly equal brightness optical binary with a separation of order 2.4 oriented NE-SW on the sky; the NE component has a nearly featureless spectrum that is much redder than that of the M2.5 star. Despite the very red color, the NE component has H weakly in absorption, and no other spectral features that are detected with certainty. We therefore assume it is not a YSO and is only a line-of-sight companion to the SW component. Both objects contribute to the CoRoT light curve, though we assume that the flux dips arise only from the young star. We do not have a measure of its UV excess, nor a complete set of IRAC photometry in order to classify its disk.
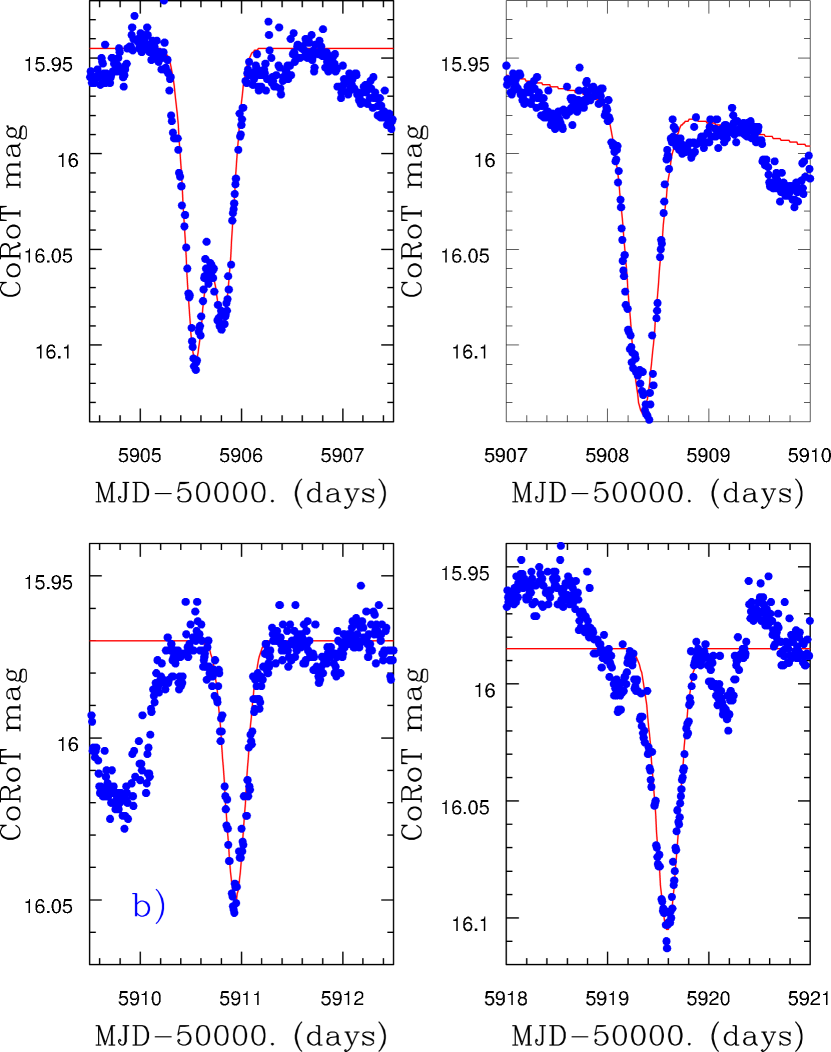
The CoRoT light curve for Mon-6975 shows a nearly constant “continuum” level and a large number of narrow flux dips with a relatively wide range in both depth and width (Figure 10a). The periodicity of the flux dips for this star is not as obvious as for Mon-21 and Mon-1165, but an auto-correlation function yields a period of 2.8 days. To guide the eye, we have placed a cross below the first strong dip in the light curve, and then successive crosses spaced 2.8 days apart for the remainder of the light curve. Some of the flux dips for Mon-6975 are very narrow, with Gaussian values ranging from 0.095 to 0.13 days. Figure 10b shows several of these dips, and the Gaussian fits we have derived.
We have an IRAC 3.6 m light curve for Mon-6975 – it is overlaid on the CoRoT light curve in Figure 11. The IRAC light curve is similar in character to the CoRoT light curve in the sense that it shows a relatively flat continuum level and two probable flux dips at the location of two of the strongest flux dips in the CoRoT light curve. The IRAC light curve is, however, much noisier, making an accurate assessment of the depth of the two flux dips at IRAC wavelengths difficult. However, it is clear that the derived ratio, after correction for the contribution to the IRAC flux from the disk, would be greater than 0.5 and possibly consistent with 1.0. Therefore, as for Mon 1165, the dip depth ratio is either consistent with optically thick occulting structures or with optically thin “clouds” whose dust mixture is extremely depleted in small grains.
4.5. Mon-1131
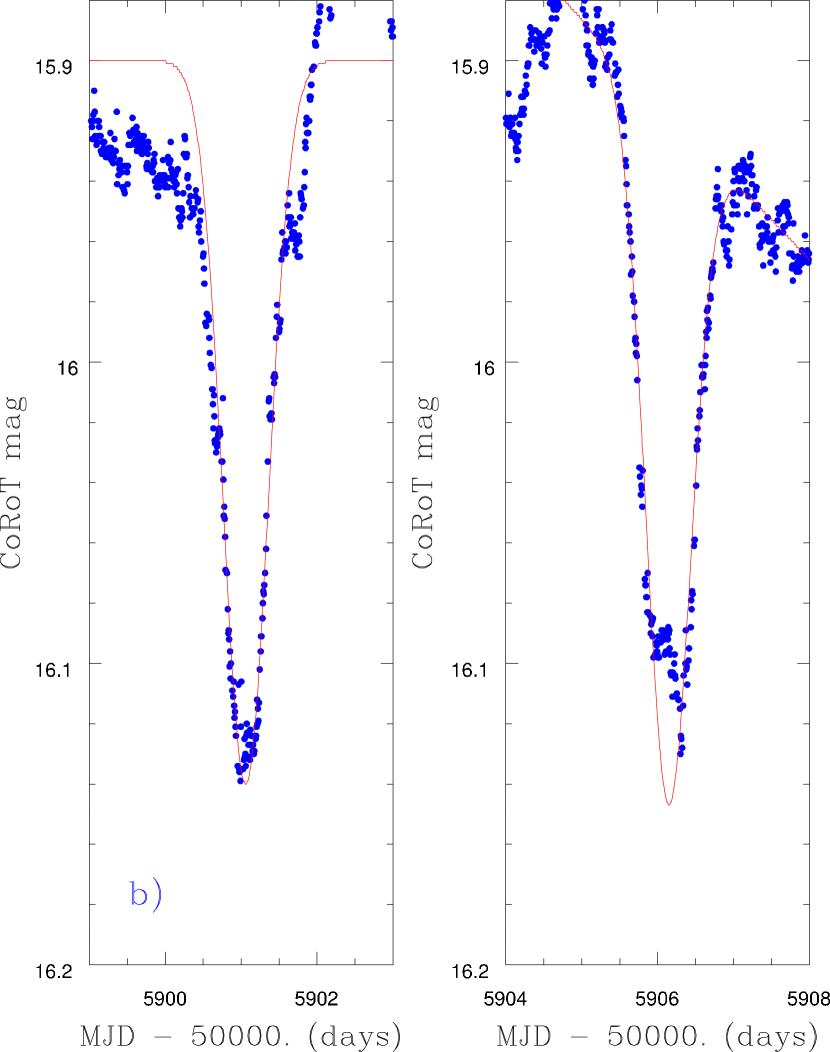
Mon-1131, also known as QT Mon, has CoRoT data from both 2008 and 2011. The 2008 light curve for this star is very different from the 2011 light curve, and is probably dominated by variable accretion – this light curve is shown and discussed in the Appendix. The 2011 light curve (Figure 12a) fits within the short-duration flux dip class, although compared to the other prominent members of the class, its flux dips are relatively broad. The dip period is 5.08 days. The two narrowest dips have Gaussian values of 0.27 and 0.30 days – their profiles are shown in Figure 12b. The IRAC light curve for Mon-1131 is essentially uncorrelated with the CoRoT light curve. We also obtained a SOAR optical spectrum of Mon-1131. Based on measures of the depths of the TiO bands in that spectrum, we estimate its spectral type at M1.5. The Furusz et al. (2006) Multiple-Mirror Telescope (MMT) high resolution spectrum for Mon-1131 shows it to have a broad and structured H profile. Both its H equivalent width (30Å) and its UV-excess (Figure 23) identify it as the most strongly accreting star amongst the short-duration flux dip group.

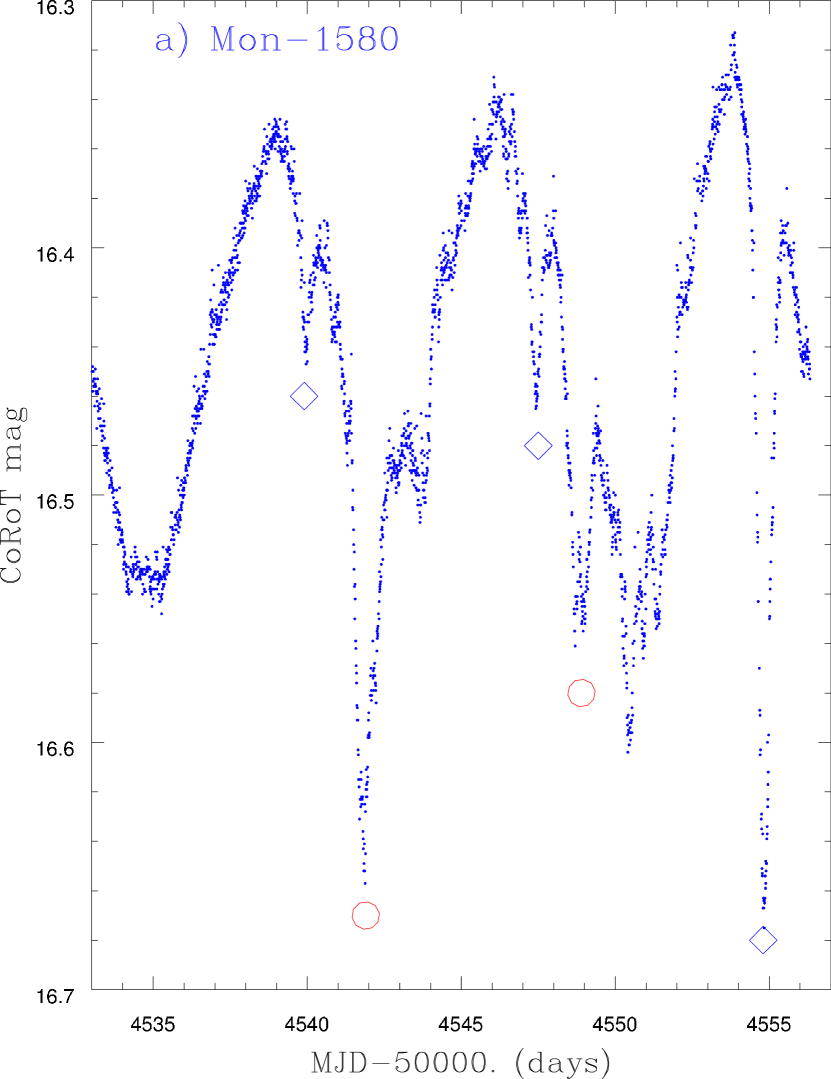
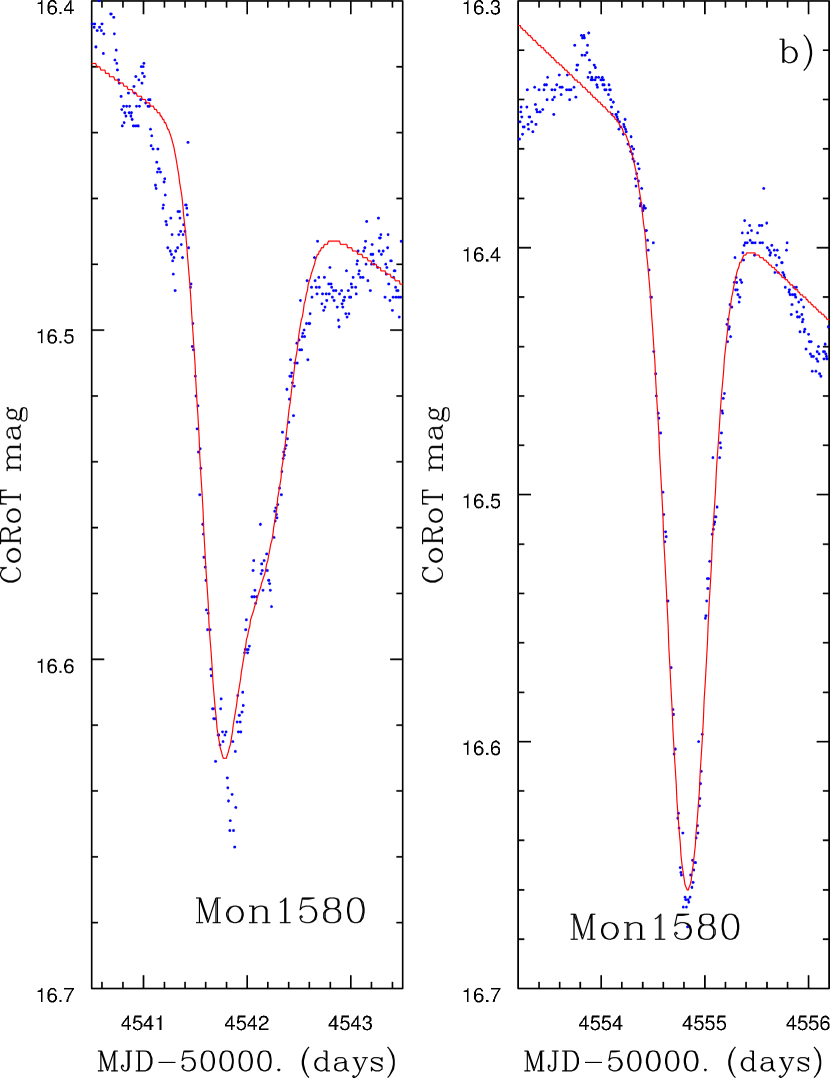
4.6. Mon-1580
Mon-1580 is another relatively little-studied member of NGC 2264. There is no published spectral type, however it is a known H emission line YSO (Reipurth et al. 1996; Furesz et al. 2006). Based on the Furesz et al. spectrum, we estimate the spectral type as M1. We have a 2008 CoRoT light curve, but no corresponding light curve from the 2011 campaign. The 2008 light curve (Figure 13a) is reminiscent of the 2008 Mon-21 light curve, in the sense that it appears to be the superposition of a spotted star light curve and a number of short duration flux dips. The spot light curve period and the flux dip period are the same (7.1 days) to within our ability to measure the periods. Figure 13b shows the Gaussian fits to the two strongest flux dips.
4.7. Mon-378
Mon-378 is another system where the light curve is a superposition of a spotted star light curve and narrow flux dips (Figure 14a). Mon-378 is a CTTS with an inverse P Cygni H profile (Furesz et al. 2006), spectral type K5.5 (Dahm & Simon 2005), and location corresponding to a Class II YSO in the IRAC color-color diagram. The CoRoT light curve is from 2011 – it was not observed in the 2008 CoRoT campaign. The IRAC light curve shows no flux dips and little correlation with the CoRoT light curve. The CoRoT light curve shows a large amplitude spotted star waveform with a period of about 11 days and with a single prominent, narrow flux dip at MJD 55919. However, after creating a model of the spotted star light curve as done for Mon-21, and subtracting it from the original light curve, a second prominent, narrow flux dip becomes evident (Figure 14b). This by itself would be a weak case that the dips are periodic. However, we also have a 2010 ground-based optical light curve, which shows (albeit poorly sampled) three apparently narrow flux dips with the same 11 day period (Figure 14c).


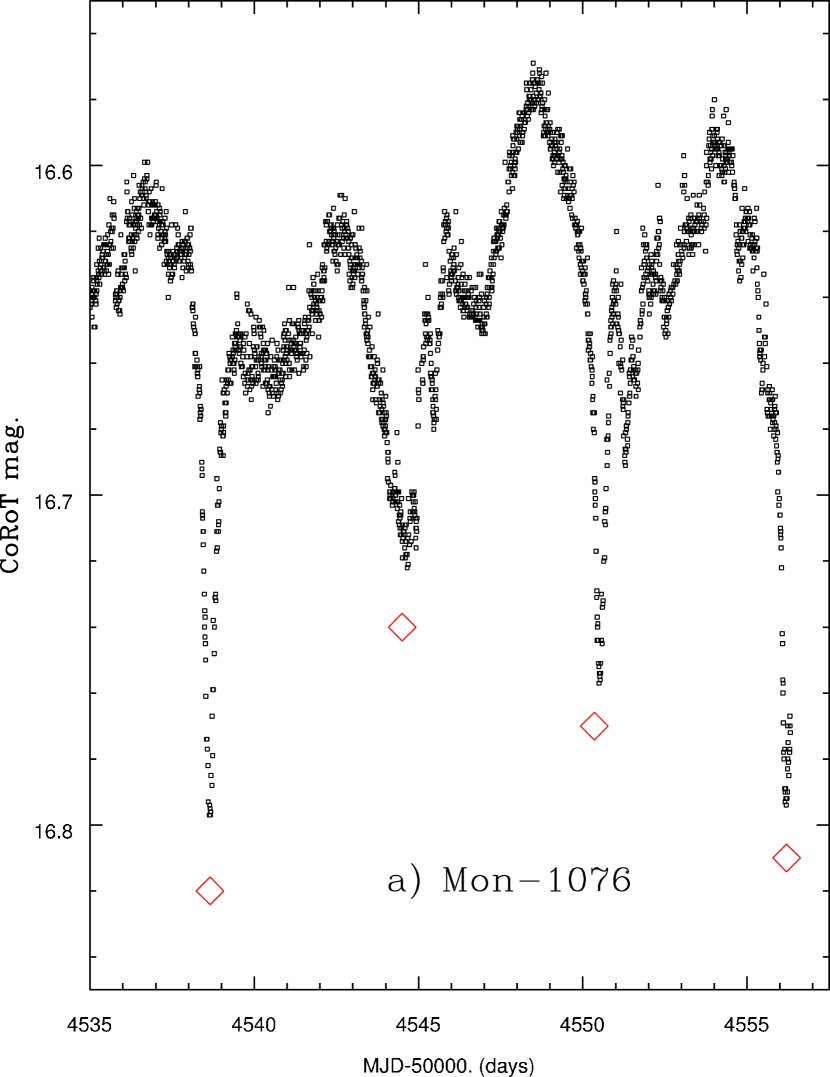
4.8. Mon-1076
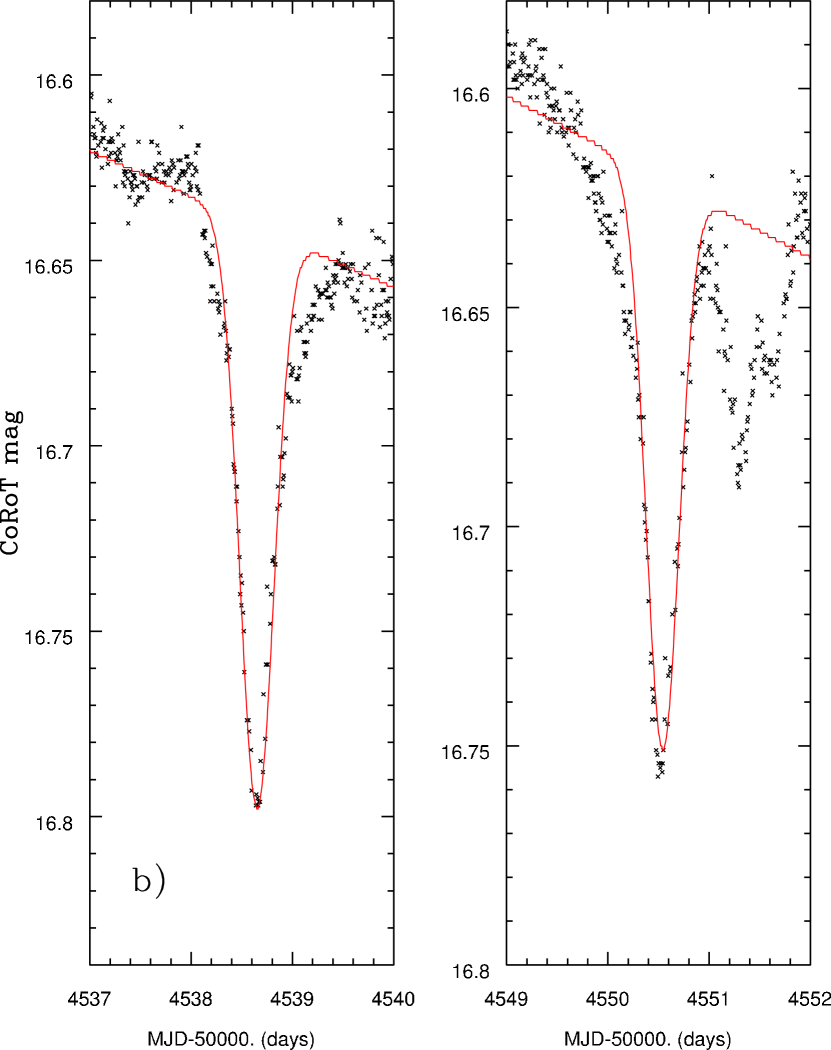
Mon-1076 (aka V338 Mon) is somewhat similar to Mon-378 and Mon-1580. It has a 2008 CoRoT light curve with low amplitude variations which may be due to star-spots but which are not stable enough to yield an obviously periodic (sinusoidal) signature. The CoRoT light curve shows three prominent narrow flux dips at MJD 54539, 54551 and 54556.5, consistent with a period of 5.8 days (Figure 15a). Fits to the two best observed flux dips are shown in Figure 15b. The published spectral type for Mon-1076 is M1 (Dahm & Simon 2005). Mon-1076 was observed by CoRoT in 2011, but bad systematics in the light curve preclude using it for any analysis.
4.9. Mon-566
Mon-566 is a relatively late-type CTTS member of NGC 2264, with a published spectral type of M3.5 (Dahm & Simon 2005) and an H equivalent width of 19.4 Å(Dahm & Simon 2005). Its location in the IRAC color-color diagram places it in the Class II YSO category. It was observed by CoRoT in both 2008 and 2011. Mon-566 is quite faint in the optical, and therefore the CoRoT light curves are very noisy which makes interpretation of the light curves difficult. Nevertheless, both the 2008 and 2011 light curves appear to show periodic, narrow, shallow flux dips. The flux dip period is 4.5 days.
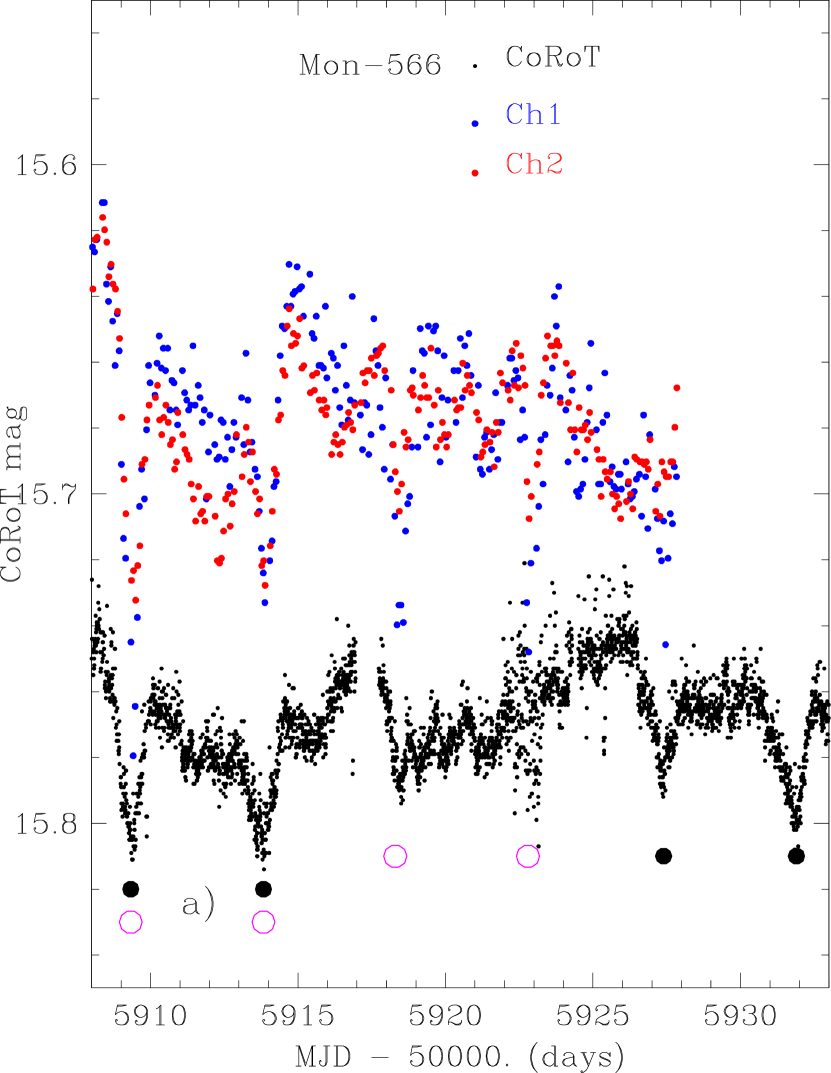
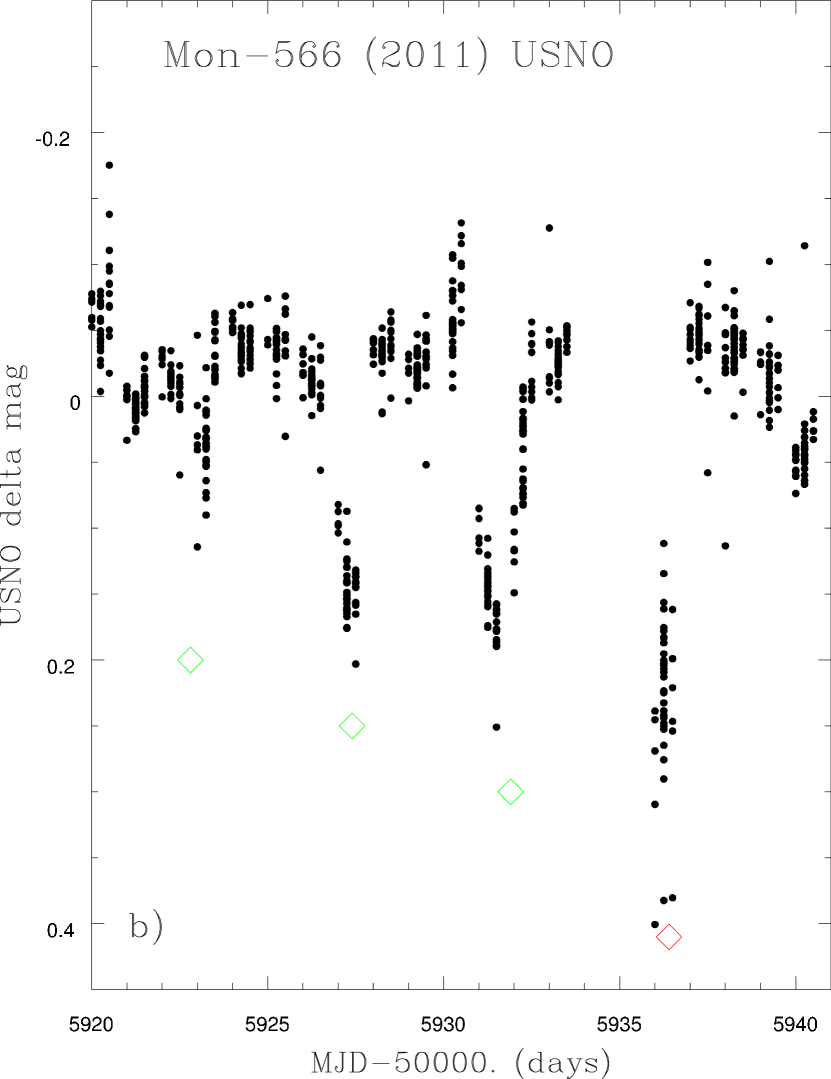
Two other sets of data give us confidence that the CoRoT flux dips are real. First, a Spitzer 2011 light curve also shows low S/N flux dips of similar width and depth at the location of some of the CoRoT flux dips. Second, we have a USNO light curve for Mon-566 in 2011, and that light curve also shows flux dips coincident with those present in the CoRoT and Spitzer light curves. All three light curves are shown in Figure 16.
The flux dips in the USNO light curve seem to be significantly deeper than those in the CoRoT light curves. We suspect this is because Mon-566 is very faint for CoRoT ( = 17.7), and in some cases the background subtraction routine that is used in the CoRoT pipeline results in too small (or large) a correction. For Mon-566, the correction is probably too small and the apparent flux dip depths are therefore also too small. Most of the stars in our sample are considerably brighter in the optical, so we do not believe their flux dips are significantly affected by imprecision in the background correction for their CoRoT light curves.
5. YSOs Sharing Some Traits with the Short-Duration Flux Dip Stars
Are there stars with light curves exhibiting superposed narrow and broad, periodic flux dips? Are there stars which have just one or a couple narrow-flux dips over the timescale of the CoRoT short runs? Do Weak-lined T Tauri stars (WTTS) ever show narrow flux dips in their CoRoT light curves? These questions could shed light on both the physical mechanism for the phenomena and the requirements on our line-of-sight to the circumstellar disks in these system.
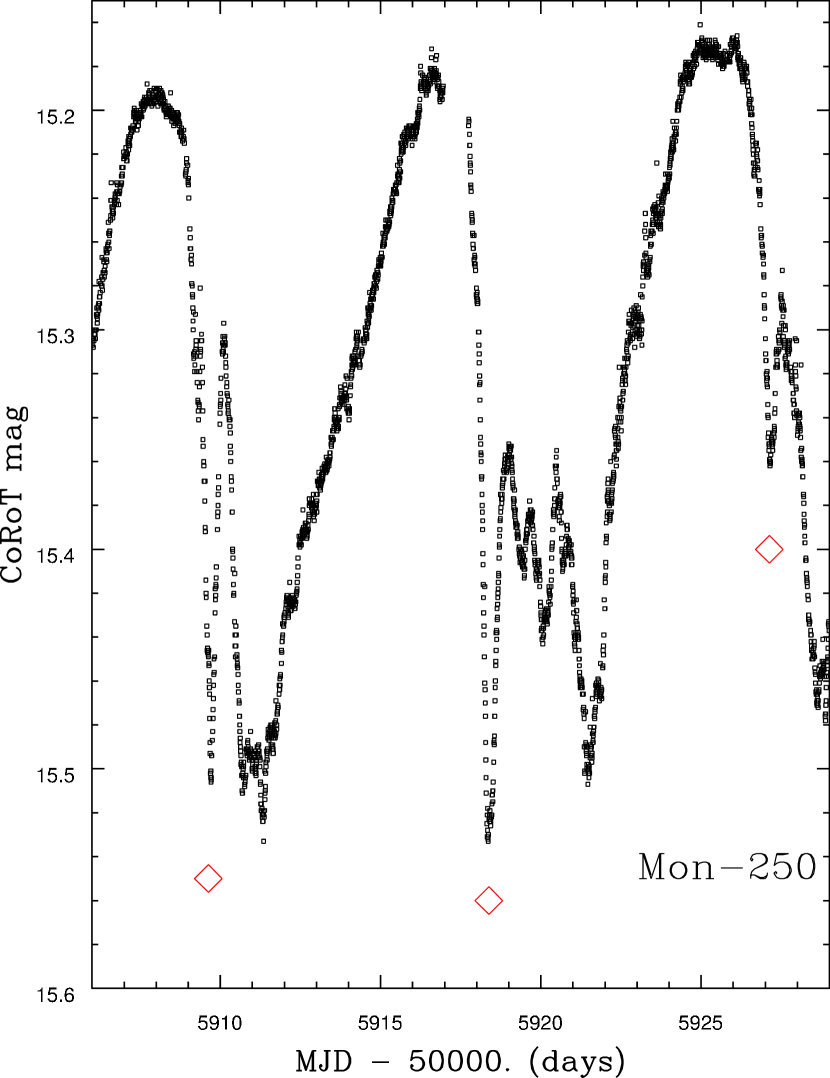
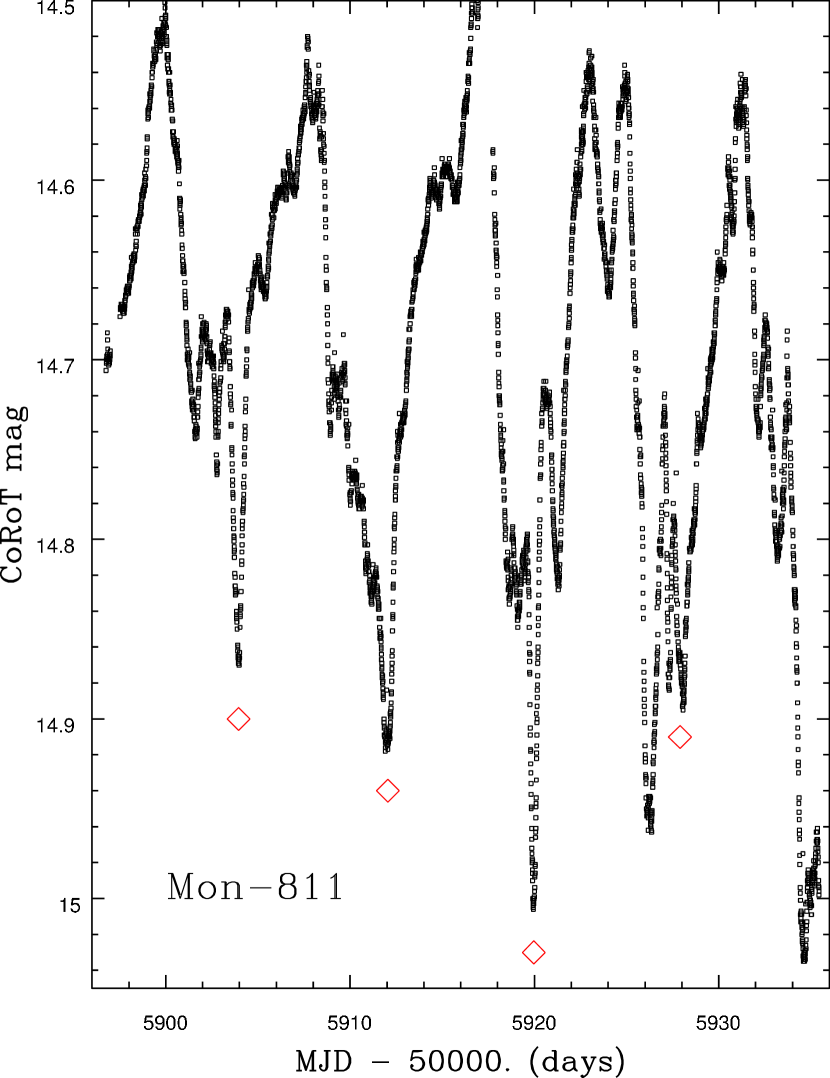
To answer the above questions, we critically examined the CoRoT light curves for all 600 NGC 2264 members (CTTS, WTTS and unknown classification) in our catalog for which we have CoRoT light curves as well as for 600 field stars with CoRoT light curves obtained simultaneously with the NGC 2264 members. The member stars included all of the YSOs identified in McGinnis et al. (2015) as AA Tau analogs. We find that two of the stars with AA Tau-type light curves do exhibit periodic, narrow flux dips in addition to the broad flux dips required to be members of the AA Tau class. Figure 17 shows these light curves, with the red diamonds marking the location of the periodic, narrow flux dips.
In each case, the period inferred from the narrow flux dips is equal (within the uncertainties) with that derived from the broad flux dips. Gaussian fits to the narrow flux dips yield widths that are in the same range as those measured for the narrow flux dip stars of Table 1. For these composite light curves, the narrow flux dips always occur during the portion of the light curve near the minimum in light for the broad-flux dips. The amplitudes for the narrow flux dips vary considerably from epoch to epoch, but do not seem to correlate with the amplitudes of the broad flux dips.
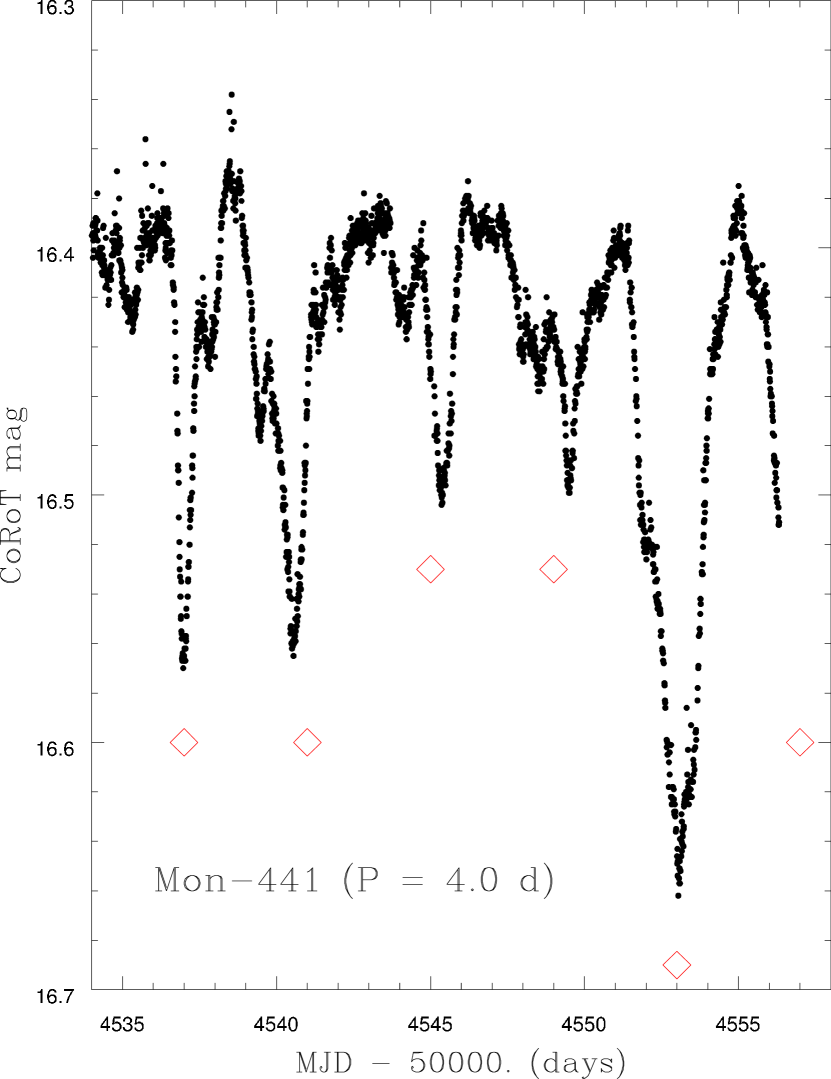
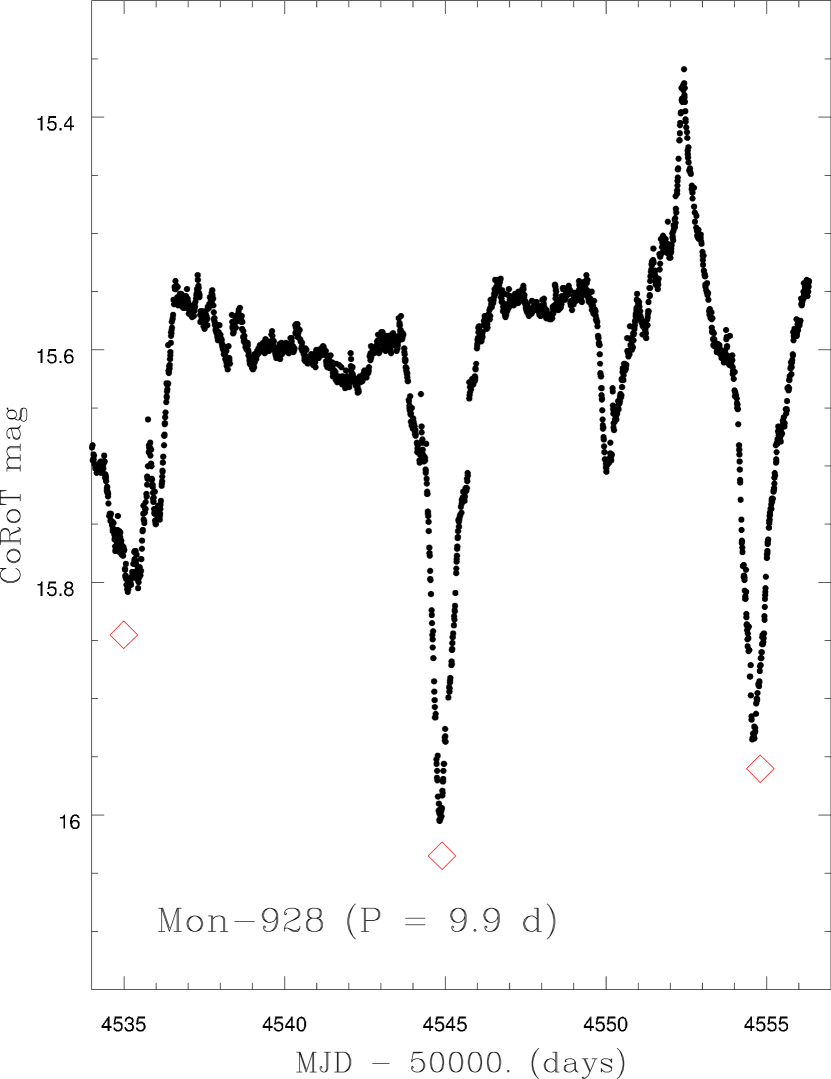
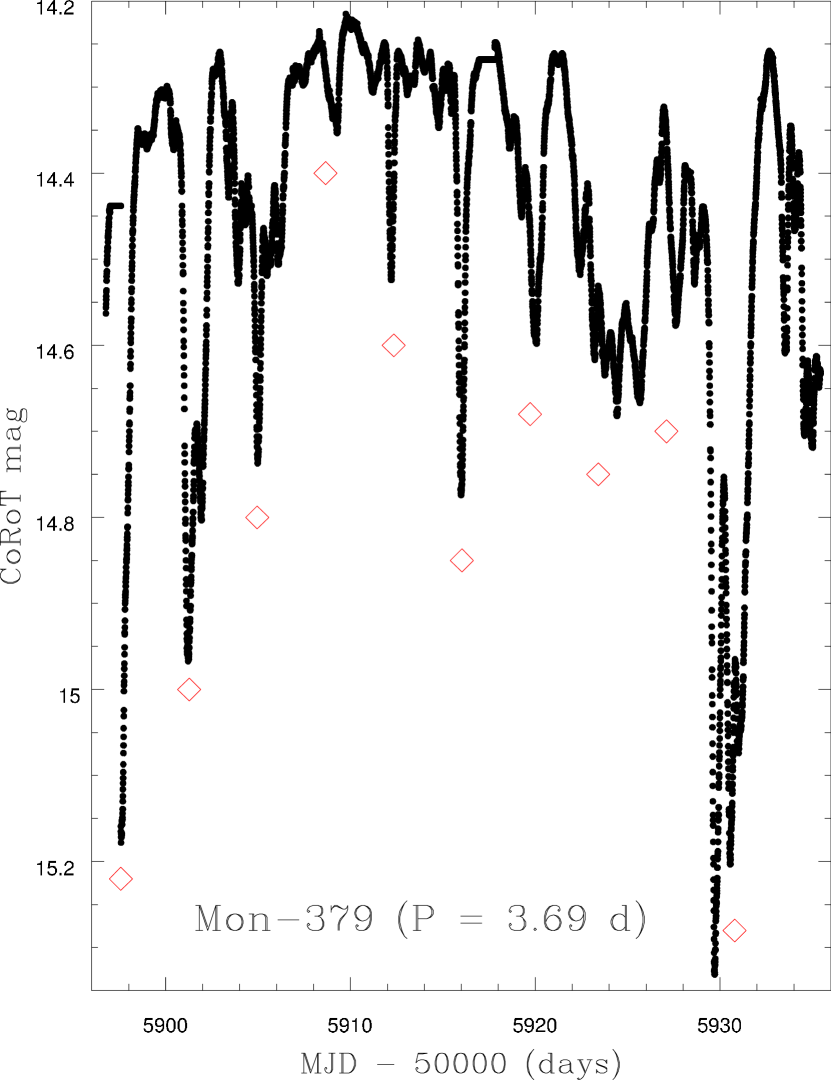
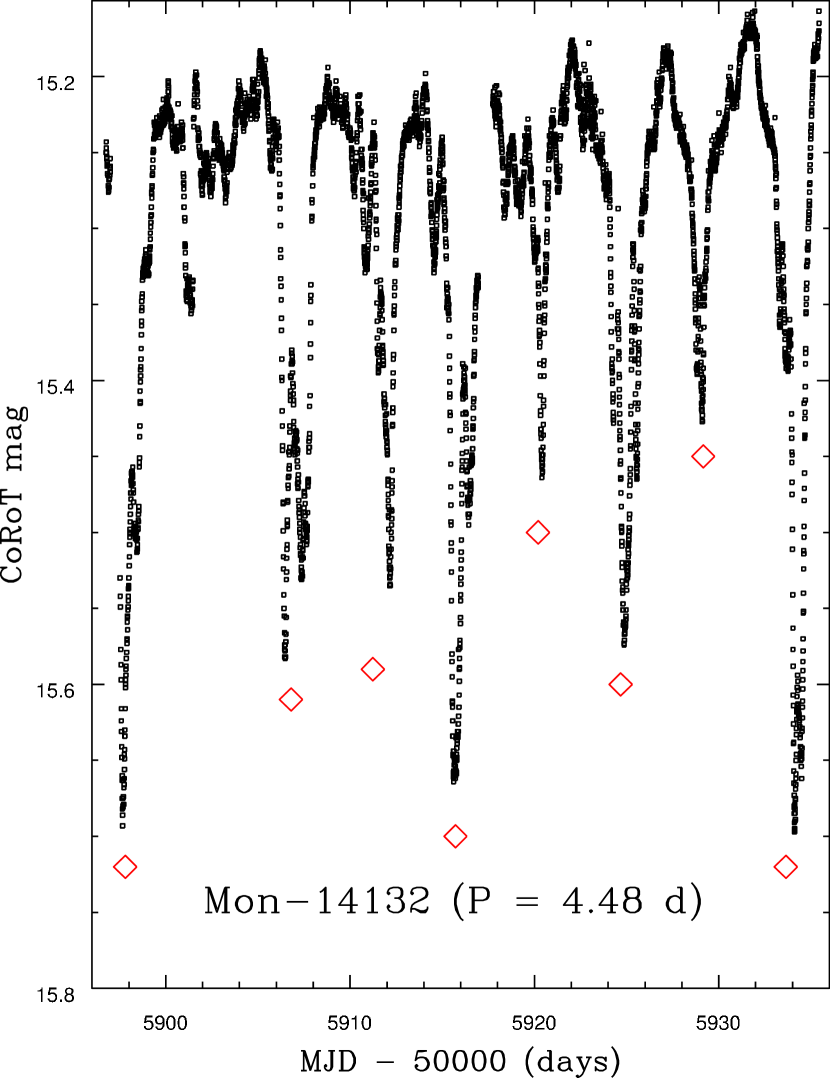
We have also identified another type of composite light curve – light curves with periodic features that are sometimes narrow and sometimes broad (defined arbitrarily as FWHM/Period 0.3). There are at least four such objects in our NGC 2264 dataset - Mon-441, Mon-928, Mon-379, and Mon-14132; all are included in McGinnis et al. (2015) as AA Tau analogs. Their light curves are shown in Figure 18. It could be argued that these four stars should be added to our group of short-duration, periodic flux dip stars. We prefer not to do that because we prefer to restrict the group to stars where all the dips in a CoRoT campaign are short duration. However, including these stars in the group would not change any of our conclusions.
Based on the fact that the periodic narrow and broad flux dips can be present in the same star and during the same campaign, the most significant deduction one can make is that the requirements for producing these two types of dips overlap. Because the AA Tau, warped disk model requires a specific viewing angle to the disk, that same viewing angle must also be compatible with production of the short-duration, periodic flux dips.
Our visual re-examination of the other CoRoT light curves yielded two additional results. First, none of the stars identified as WTTS (nor any of the non-member stars) showed any narrow or broad flux dips whose morphology mimicked those of the AA Tau light curves or those of the periodic, short-duration flux dip stars. This is, of course, as one would expect if such dips are due to close-in circumstellar dust, which WTTS and non-members should lack. Second, we identified a set of nine stars – all CTTS – whose light curves showed only a single, or in some cases a few, short-duration flux dips (but with no hint of periodicity). Light-curve snippets for a sample of these flux dips are shown in Figure 19. The widths and depths of these dips fall within the range found for the stars of Table 1. The physical properties (UV excesses; IR excesses; spectral types) of the stars with these single dips are not obviously different from the other types of variable extinction stars. We assume that the same physical mechanism(s) for producing the flux dips applies to this set of stars, but in their case other dust raising events either do not lift the dust high enough to occult our line of sight or yield dust opacities insufficient to yield a dip detectable in our data. However, when considering the statistics of what fraction of CTTS show any evidence of line-of-sight extinction events, these objects should also be included in the calculation. A table of basic information for these stars (Table 5) is provided in the Appendix.
6. Physical Properties of the Short Duration Flux Dip Class
Why do the CTTS in Table 1 show periodic, short-duration, often Gaussian shaped flux dips? If there are common physical characteristics that are shared by this set of nine YSOs, perhaps that would help allow us to assign a physical mechanism to the flux dips. We begin by examining the inferences we can make regarding the orientation of the circumstellar disks to our line of sight. We then discuss a variety of color-color and color-magnitude diagrams (CMDs) which sort the NGC 2264 YSOs by mass or accretion rate or IR excess. For the inferred properties in Table 1 and for the calculations in this section, we adopt a distance of 760 pc for NGC 2264 (Sung et al. 1997). The Sung et al. distance is in good agreement with a recent VLBI distance for a maser source in the cluster ( = 738 pc; Kamezaki et al. 2014) and with a recent analysis of data for a newly-identified NGC 2264 pre-main sequence (PMS) eclipsing binary ( = 75696 pc; Gillen et al. 2014).
6.1. Our View Angle to The Disks of the Narrow Flux-Dip Stars
Practically the simplest, most straight-forward, test we can make to constrain the origin of the material causing the flux dips is to determine the inclination of our line of sight to the circumstellar disk for these stars. In order for a YSO to show flux dips from disk material passing through our line of sight, most models predict that the inclination of the disk to our line of sight must be . To increase the sample size for this test, we include not only the stars in Table 1 but also the other stars discussed in §5 that have both narrow and broad flux dips. In total, we have eleven stars for which we have all of the relevant information (luminosity, stellar , , and rotation period). The input data, and our estimates of the line of sight angles are provided in Table 4.
The periods listed in Table 4 are those derived from the flux dips. In several cases (Mon-21, Mon-56, Mon-378, Mon-1580), the light curves also show semi-sinusoidal variations plausibly due to photospheric spots, and in those cases the spot periods are indeed essentially the same as the periods derived from the dips (and thus consistent with “disk locking”). We assume for the other stars that their flux dip periods are also equal to their photospheric rotation periods. The values are either from VLT-FLAMES or Keck-HIRES spectra we have obtained for this program, or from reanalysis of MMT-Hectochelle spectra obtained by Furesz et al. (2006). A description of the spectral analysis is provided in McGinnis et al. (2015). The stellar luminosities are derived from the measured J-band magnitudes, extinctions based on fits to multicolor photometry, the adopted distance of 760 pc, and bolometric corrections from Pecaut & Mamajek (2013); the derivation of these luminosities is described in Venuti et al. (2014). Effective temperatures are derived from spectral types – either from the literature or from our own spectra as described in the text and the appendix – and a conversion from spectral type to appropriate for YSOs. In order to illustrate the impact of the temperature scale, we show results for two representative temperature scales in Table 4, one from Table 6 of Pecaut & Mamajek (2013; PM13) and one from Cohen & Kuhi (1979; CK79).
For many of the stars, the calculation returns a value of 1.0, and in these cases we tabulate an inclination of 90. A visual summary of the results is provided in Figure 20. The mean values and uncertainties are: = 1.16 0.55 (CK79) and = 1.08 0.53 (PM13) when including all eleven stars; and = 1.03 0.35 (CK79) and = 0.96 0.35 (PM13) if one excludes the highly discrepant values for Mon-928. These estimates support the hypothesis that we are viewing these systems nearly edge on to their disks, and that the material passing through our line of sight to produce the flux dips plausibly lies within the disk or near the disk surface. It is clear, however, that individual estimates have large uncertainties, making this result less robust than we had hoped. Assuming that and uncertainties dominate, and that they contribute approximately equally, the estimates suggest the true uncertainties in are of order 10% and in are of order 20%.
| Mon ID | Period | Luminosity | Spectral | Ref aaSpectral type references: R02 - Rebull et al. (2002); DS05 = Dahm & Simon (2005); S14 - this paper | Rstar(CK79) | (CK79) | i-PM13 | i-CK79 | |||
|---|---|---|---|---|---|---|---|---|---|---|---|
| (days) | (km/s) | (L⊙) | Type | (PM13) | (CK79) | (R⊙) | (R⊙) | (degrees) | (degrees) | ||
| CSIMon-000021 | 3.20 | 19.2 1.5 | 0.957 | K5 | R02 | 4140.0 | 4395.0 | 1.68 | 0.719 | 39.53 | 45.97 |
| CSIMon-000056 | 5.83 | 11.1 2.2 | 0.774 | K5 | DS05 | 4140.0 | 4395.0 | 1.52 | 0.842 | 48.20 | 57.35 |
| CSIMon-000378 | 11.1 | 10.4 0.4 | 0.896 | K5.5 | DS05 | 4080.0 | 4295.0 | 1.71 | 1.333 | 90.00 | 90.00 |
| CSIMon-001076 | 5.85 | 9.8 2.4 | 0.256 | M1 | DS05 | 3630.0 | 3681.0 | 1.23 | 0.908 | 61.98 | 65.20 |
| CSIMon-001131 | 5.18 | 8.8 1.7 | 0.545 | M1.5: | S14 | 3560.0 | 3590.0 | 1.91 | 0.470 | 27.60 | 28.00 |
| CSIMon-001165 | 5.50 | 16.8 2.3 | 0.130 | M3: | S14 | 3360.0 | 3360.0 | 1.06 | 1.711 | 90.00 | 90.00 |
| CSIMon-001580 | 7.10 | 11.4 2.0 | 0.265 | M1: | S14 | 3630.0 | 3681.0 | 1.26 | 1.260 | 90.00 | 90.00 |
| CSIMon-000250 | 8.70 | 9.8 2.2 | 1.229 | K3 | DS05 | 4550.0 | 4775.0 | 1.62 | 1.037 | 70.29 | 90.00 |
| CSIMon-000379 | 3.69 | 25.0 1.2 | 2.121 | K2 | DS05 | 4760.0 | 4955.0 | 1.97 | 0.920 | 58.06 | 66.86 |
| CSIMon-000811 | 7.88 | 13.5 1.7 | 1.076 | K6 | DS05 | 4020.0 | 4200.0 | 1.96 | 1.070 | 78.50 | 90.00 |
| CSIMon-000928 | 9.92 | 20.1 2.8 | 0.576 | M0 | DS05 | 3770.0 | 3915.0 | 1.65 | 2.490 | 90.00 | 90.00 |
6.2. Stellar and Disk Properties of the Narrow Flux-Dip Stars
Color-magnitude or color-color diagrams could provide clues to the physical mechanisms driving the photometric variability in our three light curve classes (AA Tau analogs, stars with aperiodic flux dips, and the new short-duration flux dip class). If a mechanism depended on the stellar mass or luminosity, this should be reflected by the location of the class members in a CMD. If the mechanisms depended sensitively on our view angle to the circumstellar disk, then the mean to the system as estimated from a vs. diagram could differ amongst the three classes. If the mechanism(s) depend sensitively on the radius of the inner disk wall or the degree of disk flaring, that could be reflected in the IRAC [3.6][4.5] vs. [5.8][8.0] diagram.
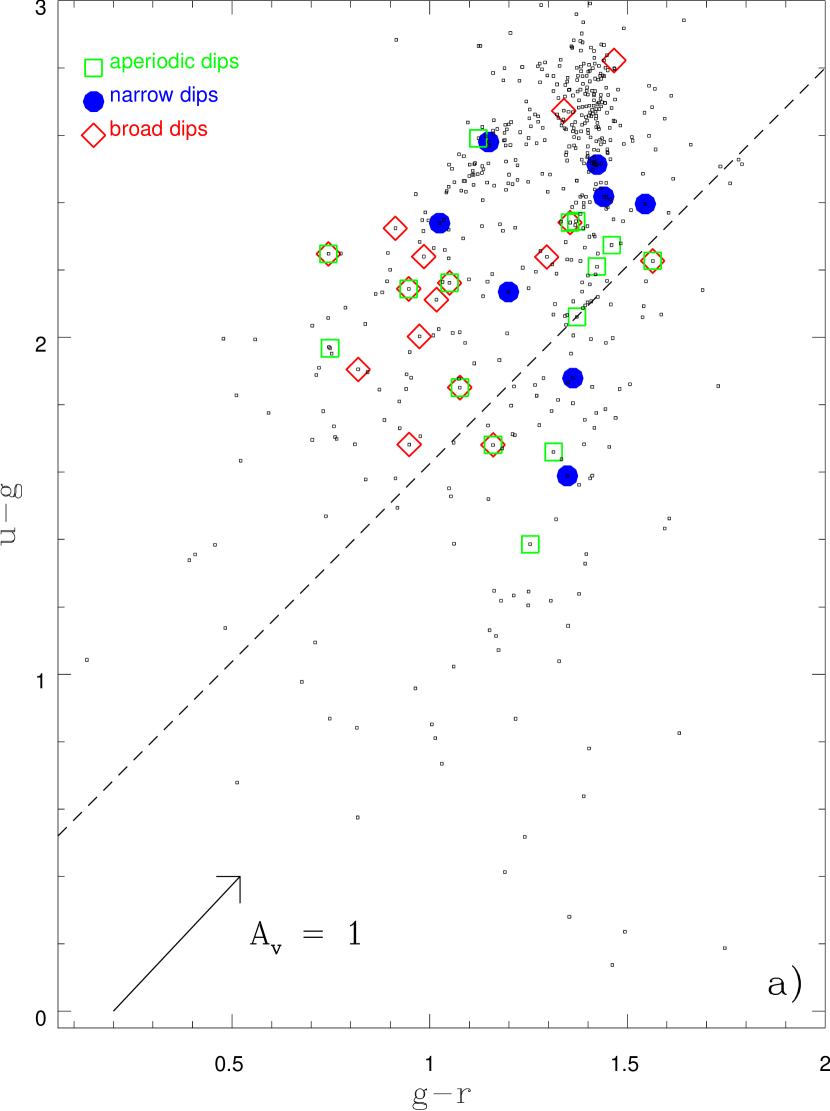
Figure 21a compares the location in an optical CMD of the short duration flux dip stars to the set of classical AA Tau analogs (except as noted in footnote 22) and the aperiodic extinctor candidates in NGC 2264 as identified in McGinnis et al. (2015). No reddening correction has been attempted. The primary conclusion we draw from this diagram is that the AA Tau analogs and stars with aperiodic flux dips appear to be bluer and brighter (higher mass), on average, than the narrow dip stars, with only a couple having colors corresponding to M dwarfs. Secondarily, we see no obvious age difference between the three groups of stars or of these stars relative to the entire set of NGC 2264 members. As illustrated in Figure 22, the spectral types for the short-duration flux dip stars are also significantly later, on average, than those for the NGC 2264 stars we classify as “classic” AA Tau analogs, lending support to the belief that they are generally lower in mass. Based on a Monte Carlo simulation, there is less than a 2% chance the two groups are drawn from the same parent spectral type distribution.
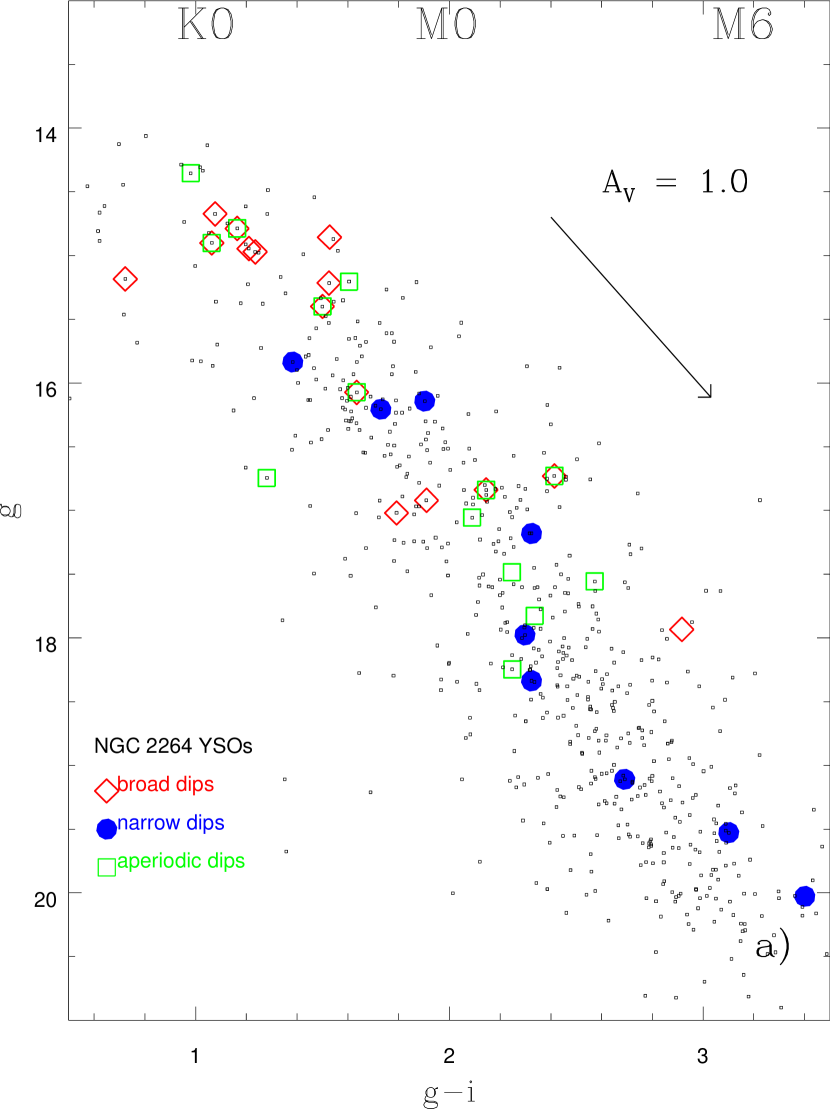
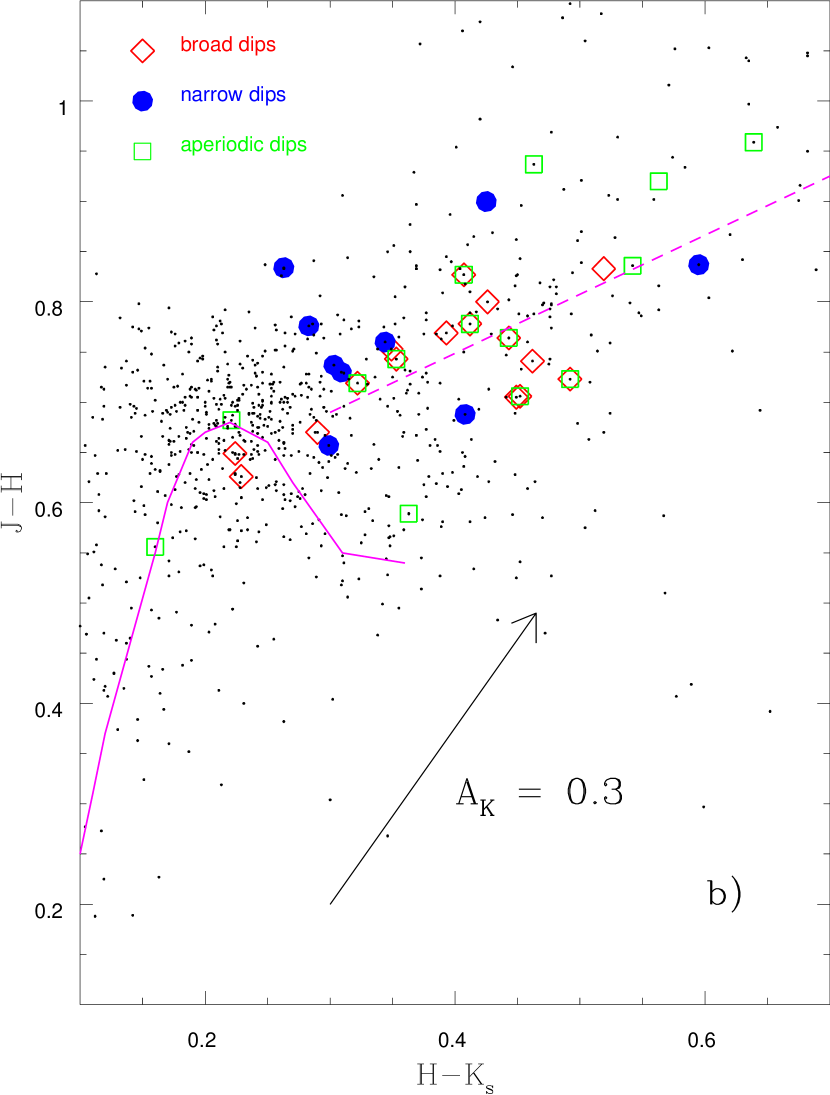
Figure 21b provides the vs. diagram for the same set of stars, as a means to assess their reddening. Since all of the variable extinction stars are CTTS, we assume that the Meyer et al. (1997) CTTS locus represents their intrinsic (unreddened) colors, at least for low mass CTTS. The aperiodic dip star located near = 0.4, = 0.6 (Mon-325) is a high mass star (spectral type G6), and presumably dereddens back to the ascending portion of the main-sequence locus. Most of the variable extinction stars lie near the Meyer et al. CTTS locus, and therefore have little additional reddening as inferred from their mean 2MASS photometry. One exception is Mon-6975, whose IR colors of = 0.42, = 0.90 indicates relatively large inferred reddening. Mon-6975 is also the reddest variable extinction star in the optical CMD (Figure 21a). We conclude that outside of the flux dips, the other YSOs with narrow and broad flux dips have at most modest reddening, and therefore that reddening corrections would not significantly alter their locations in optical CMDs such as Figure 21a.
Figure 23a shows the vs. color-color diagram (Venuti et al. 2014; Stauffer et al. 2014), discussed extensively in Venuti et al. (2014) as an accretion diagnostic. YSOs lacking active accretion (WTTS) form a roughly inverted V-shaped locus in this plane, with late F stars located near = 0.6, = 1.6 and later spectral types becoming redder until about M0 at = 1.4, = 2.8. Later type M dwarfs maintain 1.4 but have bluer colors for later M subtypes, presumably due to active chromospheres. Accretion hot spots primarily affect the colors, displacing the star towards the bottom of the plot (bluer colors). The diagram shows that most of the variable extinction stars have weak UV excesses. The short duration flux dip stars have locations in this diagram indistinguishable from the members of the two other variable extinction light curve classes.
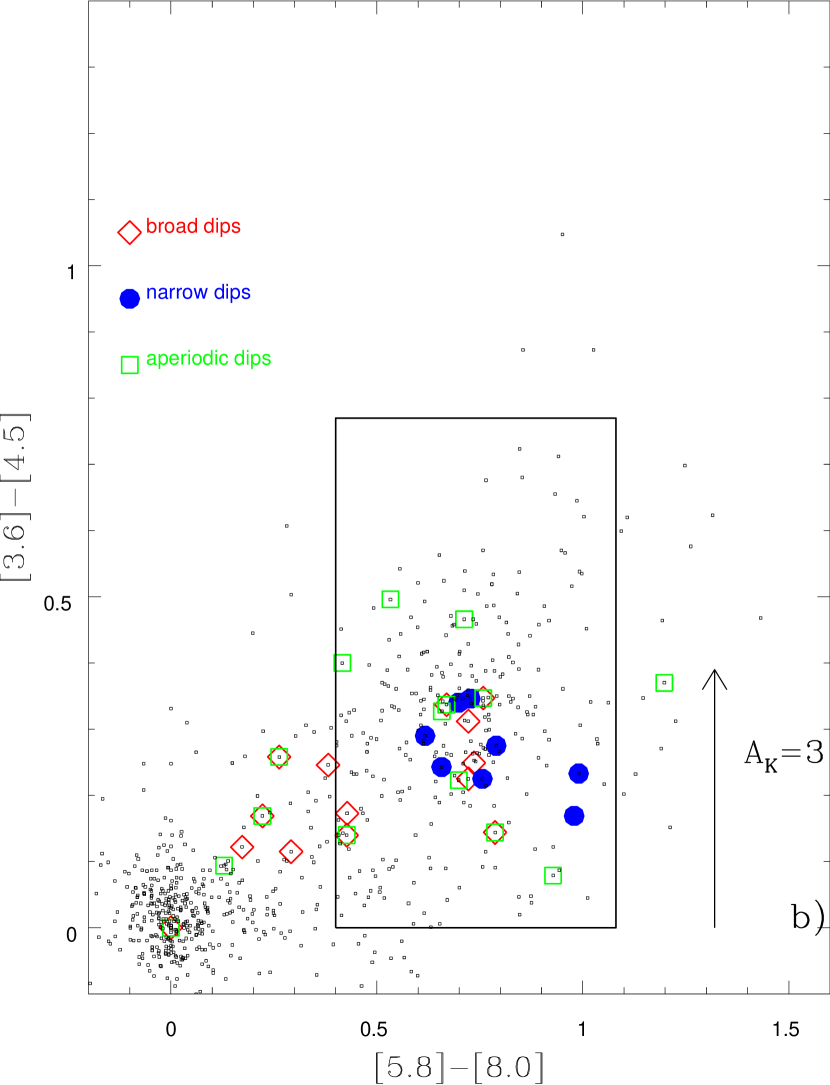
Figure 23b provides the IRAC color-color diagram, which allows one to separate stars with IR SEDs characteristic of Class I, II and III YSOs (Allen et al. 2004). The diagram shows that a significant fraction of the AA Tau analogs and aperiodic flux-dip stars have IR colors intermediate between Class II and III, whereas the short duration flux dip sample all have relatively red colors consistent with the Class II locus. The red IR colors imply that warm dust near the inner disk wall often provides the majority of the flux in the IRAC bands (see column 7 of Table 1). That, plus the expected lower selective extinction at 4 m compared to the optical, may help explain why, when we do have simultaneous optical and IR light curves, we usually see only hints of the flux dips in the IRAC data.
7. Towards A Physical Explanation for the Short-Duration Flux Dips
In the previous sections, we have attempted to establish quantitative data characterizing the short duration flux dips and the stars whose light curves exhibit these features. We summarize these properties:
-
•
About 5% (8 of 159) of the CTTS in NGC 2264 show this type of light curve (periodic, short-duration flux dips) at least some of the time. After removing two objects we classify here as short-duration flux dip stars, McGinnis et al. (2015) consider 31 of 159 of the CTTS with CoRoT light curves as either AA Tau analogs or aperiodic extinctors, corresponding to a 19% occurrence rate.
-
•
Another nine CTTS show one or a few short-duration flux dips in their CoRoT light curves. Therefore, the total fraction of CTTS with some evidence for flux dips due to dust structures intersecting our line of sight is 48/159 or 30%.
-
•
For the stars of Table 1, the flux dip durations are typically 0.25 days, with a range from about 0.10 to 0.4 days, based on Gaussian fits.
-
•
Many of the flux dips are well-fit by single Gaussian profiles, or in some cases, blends of 2 or 3 Gaussians.
-
•
The depths are never large – the largest we have measured is of order 25%; most are only of order 10%.
-
•
The periods exhibited range from about 3 to about 10 days. In some cases, we also can derive stellar rotation periods from superposed semi-sinusoidal flux variations in the light curves, and when we do so, the periods are equal or nearly equal to the dip periods.
-
•
There are significant changes in both depth and shape of the dips from epoch to epoch; in most cases the widths are more constant than the depths.
-
•
The flux dips persist for typically many orbital periods. In at least two cases, periodic narrow dips are present in both 2008 and 2011.
-
•
In three cases (Mon-21 in 2008, first and last dips; Mon-56, several dips; and Mon-1165, all dips), there are paired flux dips with the dips separated well enough so as not to be “blended”. When this occurs, the separation in time between the two dip centroids stays approximately constant.
-
•
Where we have estimates of the inclination of the disk to our line of sight, that inclination indicates that we usually view the disk close to edge on.
-
•
Compared to the other CTTS in NGC 2264 with variable extinction light curves, those with short duration flux dips are, on average, later in spectral type, with the majority being early to mid M dwarfs.
-
•
In the IRAC color-color diagram, the short-duration flux dip stars have colors which place them in the middle of the Class II distribution, whereas the classic AA Tau and aperiodic flux dip stars often have mid-IR colors in the transition region between Class II and Class III.
-
•
A small number of stars show both broad (AA Tau-like) and narrow periodic flux dips; another small set show one or two narrow flux dips, with no evidence of periodicity.
-
•
For the very small number of events where we have sufficient coverage at both optical and IR wavelengths, the ratio of the flux dip depth in the optical to that at 4 m indicates that either the occulting structures are optically thick, or if the “cloud” is optically thin, then the dust grain mixture must be very depleted of small grains compared to the standard ISM composition.
7.1. Inferred Characteristics Which Any Model Must Incorporate
We assume that any physical model to explain the short duration flux dips will have as its starting point that the dips are due to our line of sight being intercepted by structures in or near the inner circumstellar disk that rotate through and occult our line of sight. A fundamental parameter of such structures is their physical size. We can estimate the average size scale involved from the parameters in Table 1 and Figure 3. From Figure 3, the average value of the ratio of the dip FWHM and the period for the short-duration flux dips is about 0.15. Assuming the dips are due to material orbiting the star, that ratio should correspond approximately to the angular size of the structure as seen from the star, in this case indicating an angular size of about 0.95 radians. The average co-rotation radius for the stars in Table 1 is 11.3 R⊙. Assuming that the dust structures are located at or near the co-rotation radius, the average physical size of the structures would then be about 11 R⊙. For our stars in Table 1, the stellar radius Rstar 1.5 R⊙, and hence the physical size of the structure corresponds to about 7 Rstar, or to about 0.05 AU.
Further, the shallowness of the dips – usually just 5-10% – implies either that only a small part of the star is being occulted, or that the average optical depth through the dust structure is small. The lack of a flat bottom to the flux dips requires that the dust structure not be very small relative to the star, nor much bigger than the star (completely occulting it) and homogenous.
Finally, we emphasize again the frequent occurrence of flux dips whose shapes are approximately Gaussian. In combination with the preceding two points, this characteristic places significant constraints on the geometric structure of the occulting object.
With these considerations in mind, we offer four possible physical models which could produce short duration, periodic flux dips in the light curves of CTTS.
7.2. Model 1: The Short-Duration Periodic Flux Dips Fall within the Standard Warped Disk Model for AA Tau Light Curves
Classical AA Tau light curves usually show considerable structure within their broad flux dips, which is often highly variable from epoch to epoch. These characteristics presumably attest to physical structures in or near the inner disk wall whose size, shape, and/or optical depth also change considerably on the timescales of the Keplerian orbital period at that radius. The duration of the AA Tau flux dips is set by the fraction of the orbital longitude range where the upper edge of the inner wall intersects our line of sight. Even if the height of the upper lip of the disk wall varies smoothly with longitude, there will be certain lines of sight where the longitudinal range which intersects our line of sight is small, resulting in a short-duration, periodic flux dip. More probably, the height of the inner disk wall will vary irregularly both in time and in longitude, with the highest points being potential sources for short-duration flux dips given an appropriate view angle to the disk.
Arguments in favor of this interpretation of the data are that it is the simplest explanation, and it can fairly naturally explain stars with periodic flux dips having a range of (dip FWHM)/period. The simple mathematical formula proposed by Bouvier et al. (1999) results naturally in there being a width-depth correlation for flux dips produced by disk warps of varying inclination to our line of sight – as illustrated in Figure 24. Given the Bouvier et al. formula to describe the disk warp for AA Tau, flux dips with maximum depths 0.3 magnitudes and FWHM/Period 0.25 (classic AA Taus) would be predicted to be somewhat more common than those with shallow but detectable depths, again as observed. The simple model also yields dip shapes that are reasonably close to Gaussian.
In detail, however, some aspects of the data do not seem to fit with this simple model. The distribution of variable extinction stars in Figure 3 is somewhat bimodal, with a deficit of objects with FWHM/Period 0.3 and Depth 0.3, perhaps more suggestive of two populations rather than a single population. The tendency for the classic AA Taus to have earlier spectral types and to be bluer and brighter in the optical CMD argue against there being just a geometrical (view-angle) difference between the classic AA Taus and the short-duration flux dip sample. Instead, there could be a mass or temperature effect. For example, this could be explained by differing magnetic field geometries as a function of mass, over the K1 to M4 range in spectral types for our stars. Also, while the simple geometrical model can produce Gaussian flux dip shapes, the actual flux dip shapes for the classic AA Taus are highly structured, requiring the material in the disk warp to also have a highly non-uniform and variable distribution. If the disk warp model were adjusted to yield structured dips to match the classic AA Taus, it is not obvious it would yield predicted narrow flux dips that would often still be well-approximated as Gaussian in shape.
7.3. Model 2: Flux Dips Produced by the Footpoint of A Funnel-Flow Accretion Column or by Inhomogeneities in a Dusty Disk Wind
Romanova et al. (2004; 2008) predict that for YSOs with relatively low accretion rates, the accretion may occur in stable, relatively long-lived “funnel flows”. Typically, two tongues of gas arise from the inner disk, separated by about 180. The gas originates from a relatively broad range in longitude and then gathers together into a narrower stream (it “funnels”). Some empirical evidence for these types of accretion curtains has been provided through analysis of CTTS emission line profiles and their variability (Symington et al. 2005; Bouvier et al. 2006). If the gas flow originates from the region near the dust sublimation radius, and that radius is beyond the co-rotation radius, then it will start with a lower angular rotation rate than the star and a trailing spiral pattern will result, as illustrated in Figure 1 of Romanova & Kurosawa (2014). Dust could be entrained in this flow and survive briefly as the gas/dust mixture rises above the disk plane (though the dust will soon sublimate as it flows towards the star). Alternatively, Bans & Königl (2012) have advocated that disk winds originating from beyond the dust sublimation radius may levitate sufficient dust to contribute a large fraction of the 3 to 4 micron flux in YSOs, and if that wind were significantly non-axisymmetric it could be the source of potentially short-duration flux dips.
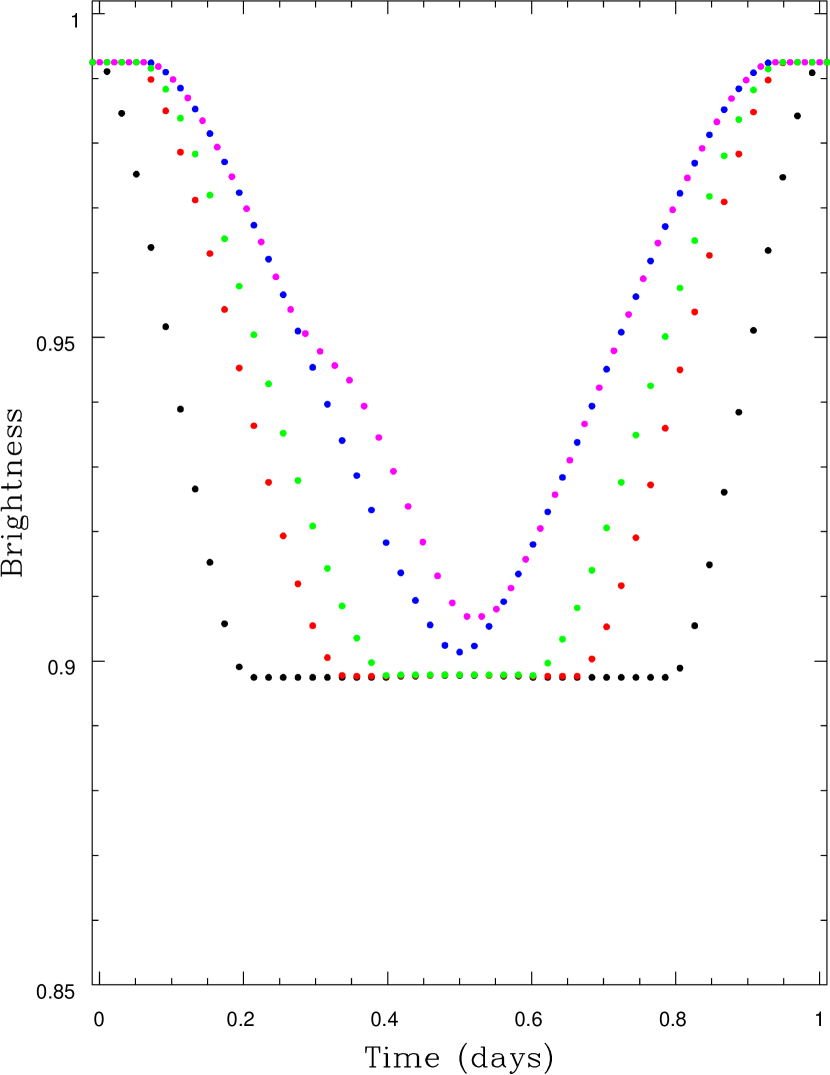
We have constructed a toy model of an accretion curtain in order to illustrate constraints that the narrow dip profiles place on such a curtain. We tune the model to the flux dips in Mon-21. Specifically, the model must produce approximately Gaussian shaped flux dips with 0.2 days (FWHM 0.45 days) for a system with = 1.7 , = 3.2 days, and = 9.7 . We place the curtain at the co-rotation radius. Based on the geometrical arguments from §7.1, we adopt a curtain width of 8 . We divide the curtain into 8 vertical panels, each of base width 1 (the left panel of Figure 25 illustrates the geometry of the toy model). The panels are actually triangles, all meeting at a common apex at height above the midpoint of the curtain. For very large , the panel is essentially a vertical wall of width 8 . For = 8 , the curtain becomes an equilateral triangle. We adopt a uniform optical depth of 0.1 for dust within the curtain. Finally, we place the bottom of the curtain so that it is aligned with the bottom of the star as viewed from our vantage point. We place the edge of the curtain near the leading limb of the star, and let orbital motion (with the Mon-21 period) carry the curtain in front of the star.
With the above idealized geometry, we wish to determine if flux dips like that observed can be reproduced - and if so, what range of convergent point heights is allowed? The right panel of Figure 25 shows the flux dips produced for values of the convergent height from 20 (bottom) to 1 (upper blue curve). The model with a convergent height of 1 produces an approximately Gaussian shaped profile whose FWHM 0.4 days, within the range of dip widths observed for Mon-21. These results emphasize two things: (a) in order to produce a flux dip as broad as observed, an accretion curtain must be quite wide (several times the stellar diameter) at its base; and (b) in order to produce the Gaussian shape, assuming a uniform dust opacity, the curtain must “funnel” down to a much smaller region over a very small scale height. The alternative to this would be to assume instead that the curtain has an opacity distribution smoothly varying with longitude, peaking near its midpoint.
What types of limits on opacity variations within the curtain could we detect? We constructed one model, for convergent height of 1 , where we set the opacity of one of the panels to half the normal value. The top model flux dip in Figure 25b shows this result. For many of the flux dips illustrated in this paper, the observed dip shape is more symmetric than this model and we could exclude an opacity fluctuation of this order. However, some of the flux dips we have shown do have asymmetries which could perhaps be indicative of opacity fluctuations (rather than as a blend of two Gaussian waveforms).
One criticism of this model is that it could simply be regarded as a reformulation of the first model. That is, the tip of a warped disk is the place where one might expect an accretion curtain to form, and whether one labels the dust structure there as part of the disk or the base of the accretion flow is, perhaps, only semantics. One reason to keep the two ideas separate is that if the line of sight inclinations to Mon-21 and especially Mon-1131 (Table 4) are confirmed at a value near our current estimates ( 40 and 27 degrees, respectively), this could not be accomodated within a warped disk model but could be compatible with the accretion curtain model if dust could survive in the accretion flow to heights of several stellar radii above the disk plane. In this case, the duration of the flux dip would be set by the inclination of the accretion flow relative to the orbital axis.
The, on average, later spectral types and dustier disks for the short-duration flux dip stars are not an obvious feature of the model but could possibly be made to fit. The lower luminosity of the star and the dustier disk could correspond to allowing the base of the accretion column to be located beyond the dust sublimation radius, whereas the higher luminosity, less dusty disks of the classical AA Taus might have their accretion columns be dust free. Alternatively, the less dusty nature of the AA Tau group’s disks may simply reflect their higher stellar mass and the expected dependence of disk evolution timescales on stellar mass (longer timescales for lower mass stars).
7.4. Model 3: The Short-Duration Periodic Flux Dips Originate from Dust Associated with Vortex Instabilities Located Near the Inner Disk Rim
The short durations and small amplitudes of the flux dips could arise from mountains on the surface of the disk – that is, features standing up above their surroundings. Such features would either be low-relief, sweeping across only the bottom of the star’s face but optically thick, or taller, but diffuse and of moderate optical depth. Mountains arising from the disk would naturally cross the star once per local orbit, while varying from one crossing to the next due to the internal turbulence. The issue is how to lift the mountains above the plains.
One way to produce vertical relief on the disk surface is through vortices driven by Rossby wave or baroclinic instabilities. Sub-millimeter and millimeter interferometric imaging of nearby transition-disk YSOs has revealed several stars with large azimuthal asymmetries in surface brightness at separations from the star of tens of AU (van der Marel et al. 2013; Isella et al. 2013; Perez et al. 2014). The asymmetries are interpreted as millimeter-sized particles concentrated in long-lived hydrodynamical vortices rotating in the disk plane (Lyra & Mac Low 2012; Lyra & Lin 2013). Similar vortices occurring within a fraction of an AU of the star might account for the periodic flux dips we observe. The vortices have higher surface densities than their surroundings and thus could increase the column along lines of sight to the star in some range of viewing angles. However to account for all the narrow dips, the vortices would need to obscure the star in 5-10% of all systems, and thus to increase the height of the starlight unit-optical-depth surface near the dust sublimation front by 5-10% of the radius – or more if not every disk has a vortex near the relevant radius.
In the existing hydrodynamical models, the surface density enhancements at the vortices are about a factor of two (Lyra et al. 2009; Meheut et al. 2010; Lyra & Mac Low 2012; Meheut et al. 2012). We construct a model consisting of a star of 0.5 and 2 , with effective temperature 4000 K. Orbiting the star is a disk accreting at yr-1. The disk’s surface density is 1000 g cm-2 at 0.1 AU and falls off inversely with the radius. An inner edge is created by rolling off the surface density inside 0.1 AU as a Gaussian with half-width 0.015 AU. The disk’s outer edge is defined by an exponential cutoff with radial scale 40 AU. To prevent the outer disk from obscuring the star before the inner edge as the system is tilted over to higher inclinations, we give the outer disk a lower dust abundance. The dust-to-gas mass ratio is 1% inside 0.2 AU and falls off as a Gaussian with half-width 0.2 AU toward dust-to-gas mass ratio . The disk material’s opacity comes from well-mixed compact spherical grains chosen to match the observed spectra of protostellar sources (Preibisch et al. 1993). We place a vortex at 0.1 AU, giving it a surface density contrast of two and profiles in the radial and azimuthal directions that are Gaussians with full-widths at half maximum of one-quarter the radius and , respectively.
We translate the disk’s surface densities into volume densities using a temperature profile taken from the midplane of a Monte Carlo radiative transfer calculation in a similar but axially-symmetric density distribution, lacking the vortex. This places the model disk in approximate hydrostatic equilibrium. We then carry out a 3-D transfer calculation to obtain the distributions of temperature and radiation intensity in the disk with vortex, using the Bjorkman & Wood (2001) algorithm and Lucy’s (1999) method as implemented by Turner et al. (2012). Isotropic scattering is included. We solve the transfer equation on a grid of rays (Yorke 1986) including the scattering and thermal emission source terms, to construct synthetic images of the system as viewed at different points around the vortex’s orbit. We conduct photometry on the images and assemble them into a lightcurve. The resulting V-band photometric amplitude is 1% or less at all viewing angles. The model vortex thus has too little vertical relief to explain the dips’ amplitudes.
To account for the possibility that vortices can eventually reach contrasts up to an order of magnitude relative to their surroundings, as suggested by long-duration 2-D hydrodynamical calculations (Regaly et al. 2012), we carry out a further run in which the surface density contrast is increased to ten. The V-band amplitude exceeds 3% when the system is inclined between 81 and 84, peaking at 7% for inclination 83. Therefore, even this seemingly extreme vortex cannot easily explain either the full range of the narrow dip amplitudes or the number of objects in which they occur. However, vortices concentrate pebble- to boulder-sized rubble (Barge & Sommeria 1995), and collisions between the rubble particles could yield fragments that raise the abundance of sub-micron dust even more than by a factor of 10. Determining whether the increase makes vortices a viable explanation for the narrow flux dips will require better models of the dust sources, sinks and transport.
7.5. Model 4: Flux Dips Produced by A Spiral Arm in the Inner Disk
A planet embedded in a disk exerts a gravitational force that raises a spiral arm in the surrounding material. The pattern co-rotates with the planet and is strongest near the planet’s location (Rafikov 2002). In particular, a planet orbiting interior to the disk’s inner rim could raise a bump on the rim that rotates with the planet’s orbital period, which is shorter than the period at the rim. Hot Jupiters orbiting mature stars cluster near periods 3-5 days and eccentricity zero, while less massive planets show no such clustering. Hot gas giants cannot easily grow in situ, as reviewed by Helled et al. (2013). Instead they probably formed outside the snow line and reached their present orbits either by migrating through the disks that gave them birth, or by later dynamical interactions with third bodies (Baruteau et al. 2013). Detecting planets interacting with the disks would help separate these possibilities.
To test whether planet-disk interactions could cause the narrow dips, we construct a model using the same 0.5 star and disk as in the vortex picture above. The vortex is replaced by a 5 planet orbiting at 0.07 AU, which raises a spiral overdensity in the disk following the shape of Muto et al. (2012) eq. 1, which is derived from a linear analysis by Rafikov (2002) and therefore is strictly valid only for planets with masses less than about 1 . We build the density and temperature distribution using the same procedure as for the vortex model, and again conduct synthetic observations using the radiative transfer code. The results are shown in Figure 26, where the head of the spiral arm passing in front of the star produces a narrow dip with optical amplitude 2.3%, in the range observed among the stars in NGC 2264. A more massive disk or higher dust abundance would likely yield larger amplitudes. Also, the spiral arm’s star-facing side is hotter than the axisymmetric model used to set up the approximate hydrostatic equilibrium, so that restoring the balance would make the atmosphere expand, increasing the dip amplitude. However whether there is time to reach hydrostatic equilibrium is unclear, since the spiral arm propagates around the disk at the planet’s orbital frequency. A more serious difficulty with this picture is that it yields dips in less than 5% of all randomly-oriented systems, even if every star has a similar hot planet. The planet-driven bump simply does not extend high enough above the surrounding disk to obscure the star over a wide range of viewing angles. A more massive planet could yield a taller bump, but accurate modeling would require non-linear numerical hydrodynamical calculations. If the amplitude can be made large enough, then among the four pictures we have considered, the planet-raised spiral arms could best explain any individual system in which the dips are regularly-spaced and repeat more often than the orbital period at the dust sublimation radius. However, unless hot Jupiters are much more frequent in NGC 2264 than amongst field stars, this mechanism could not be invoked for the majority of the periodic, narrow, flux dip stars.
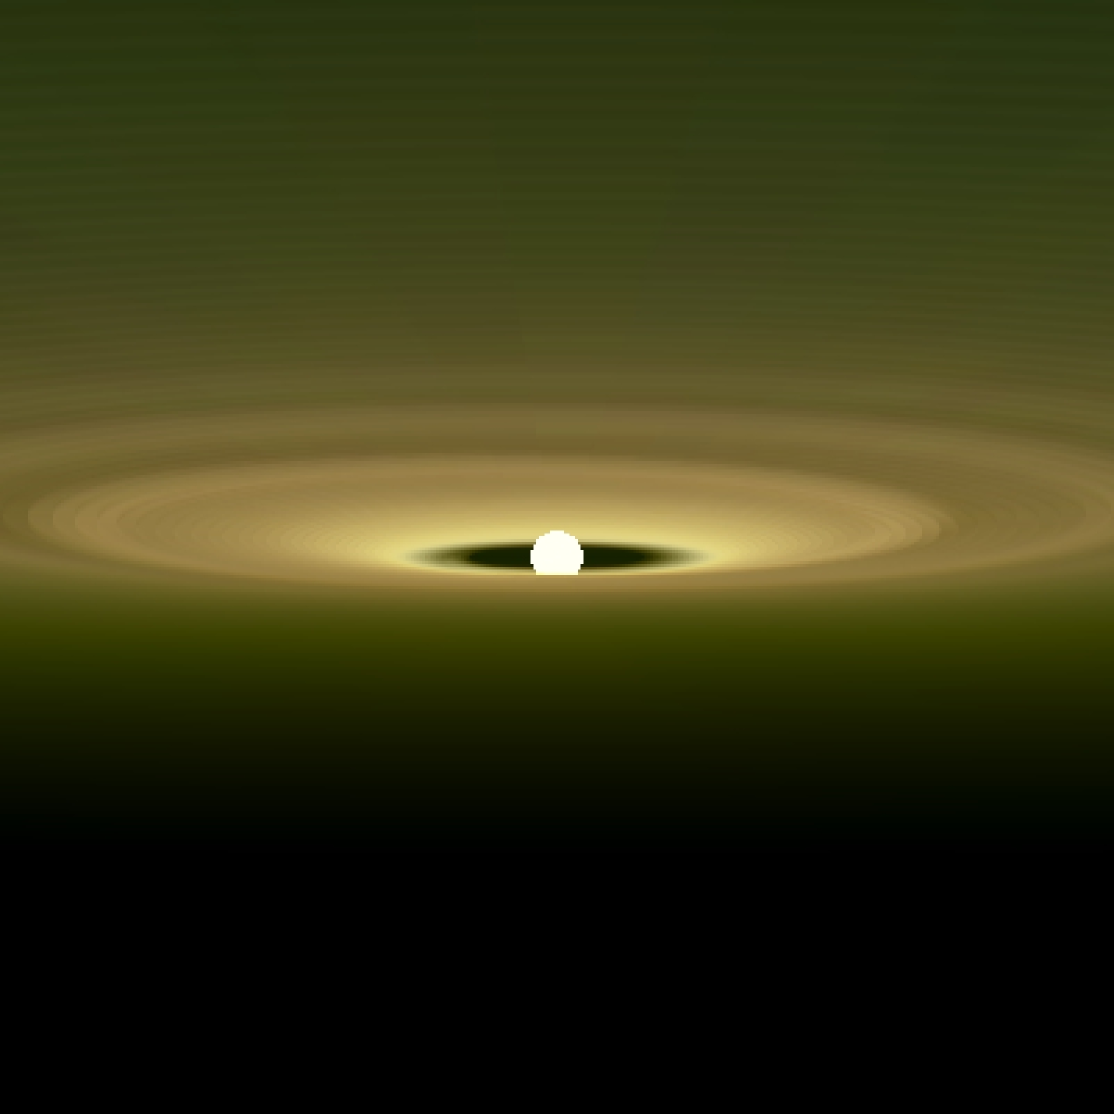

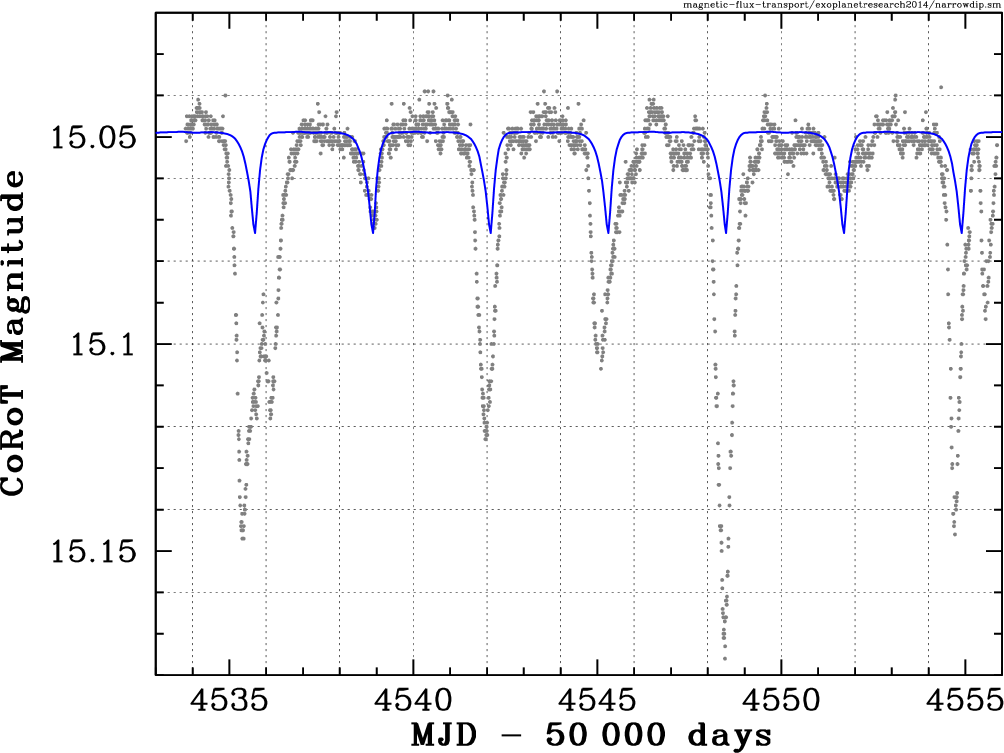
8. Conclusions
This paper, and the others in this series (Alencar et al. 2010; Cody et al. 2014; Stauffer et al2̇014; McGinnis et al. 2015) demonstrate how high cadence, long duration, sensitive, photometrically stable light curves can be used to infer physical properties of YSOs that are otherwise impossible to investigate. In this paper, we have identified a new YSO light curve class characterized by short-duration, shallow, periodic flux dips. Depending on which physical mechanism is responsible for producing these short-duration flux dips, detailed study of this set of stars has the potential to significantly improve our understanding of the structure of the inner disks and accretion flows in YSOs and the role of instabilities and migrating planets in shaping the inner disks and their dust content.
Regardless of the precise physical mechanism for producing the short-duration flux dips, if we are correct in assigning the semi-sinusoidal variations to photospheric spots and the short-duration flux dips to dust in or near the co-rotation radius, then our observations for at least Mon-21 (2008), Mon-378, and Mon-1580 confirm that their stellar rotation rate is locked to the Keplerian rotation period at the inner disk. This has been a long-standing prediction of some models for the angular momentum evolution of YSOs (e.g., Königl 1991; Collier-Cameron and Campbell 1993) but with generally only indirect evidence to support it.
We offer here one possible interpretation of our data, which attempts to incorporate as many as possible of the constraints on the physical mechanisms we have described in Sec. 7. Assume that extinction events can be produced both by a warped inner disk and by dust entrained within an accretion flow of the sort envisioned in the Romanova et al. models. Assume further that for the youngest, least evolved disks, our line of sight to the inner disk may be obscured by optically thick dust in the outer, flared disk. Adopt the idea proposed in Keane et al. (2014) that transition disks, as well as having partially cleared inner disks, also have less flared (or less dusty) outer disks. Given those thoughts, the stars with isolated, narrow flux dips (Figure 19) could be systems where dust in an accretion flow has survived to an unusually high distance above the disk plane. We see only one or two of these dips per 40 day light curve because only rarely does the dust survive long enough to reach a height to intersect our line of sight. These systems are, therefore, viewed at somewhat smaller inclinations than the other variable extinction stars. The periodic, narrow flux dip stars are systems viewed at larger inclinations where it is more likely the dust will generally be present in the accretion flows. Finally, the classic AA Tau analogs are the systems with more evolved – less dusty – outer disks where we see into the inner disk and where a warped inner disk can then occult our line of sight. The systems with both broad and narrow flux dips have extinction events produced by dust in both the warped disk and in the accretion funnels. We offer this scenario primarily as a way to focus future studies. The main results of this paper are the empirical constraints on the narrow flux-dip light curves and their host stars provided in §6 and §7, which any model of these events must explain.
A general concern with any model for the variable extinction stars is simply that there seems to be too many of them in NGC 2264. There are roughly equal numbers of stars with each of the three light curve types (AA Tau, aperiodic dip, and short-duration dip), with about 39 such stars in all, corresponding to about 25% of the total number of CTTS for which we have CoRoT light curves. If one includes the single-dip stars from Figure 19, then about 30% of the CTTS have some evidence for dust clumps within 0.1 AU of the star intersecting our line of sight. That seems high, given an expectation that the inner disk wall height should be of order 15% of the disk radius at that location (Dullemond et al. 2001; Muzerolle et al. 2003), even allowing for some YSOs having warped disks. A provocative solution to this concern is suggested by the claim from Klagyivik et al. (2013) that there are many more eclipsing binary members of NGC 2264 than should occur by chance if their axes were randomly oriented, from which they conclude that the EB axes are preferentially aligned and that we are near the plane of their orbital motions. If this is also true for the angular momentum vectors of the single stars in NGC 2264, then we would also detect a higher fraction of variable extinction stars than would be true for a random orientation of axes. Other authors have concluded that the rotational velocities ( and periods) of stars in open clusters are compatible with a random orientation of axes and incompatible with any strong alignment of axes (e.g., Kraft 1970; Jackson & Jeffries 2013), so this either argues against such an effect in NGC 2264 or that NGC 2264 is unusual in this respect.
Appendix
Separating the Spotted-Star and Flux Dip Signatures in the 2008 Light Curve for Mon-21
In §4.1.1, we used the Mon-21 light curve itself to generate a model for the portion of the light curve we attribute to spots, and subtracted that model from the data in order to derive an estimate of the light curve structure due to variable extinction. In order to demonstrate that this procedure is adequate to the task, we offer here another means to estimate the flux dip light curve.
All modern studies agree that the dominant physical mechanism which drives the visual appearance of optical light curves for most WTTS is the rotational modulation of star-spots that are distributed asymmetrically over the stellar surface. When these spots are at moderately high-latitude, which is typical, the light curve shapes can be approximately sinusoidal. Dozens of the NGC 2264 CoRoT light curves fall into this category. Given that large a library, it seemed reasonable to us that one of those light curves might have a shape that closely resembled the smoothly varying portion of the Mon-21 light curve. We believe that is indeed the case. Figure 27 shows the 2011 CoRoT light curve of Mon-103, a YSO with spectral type very similar to that for Mon-21 (K6 vs. K5 for Mon-21). The period for Mon-103 is just very slightly greater than for Mon-21 – 3.3 days vs. 3.15 days. The red curve in Figure 27 is the template waveform for the Mon-21 model, simply shifted in zeropoint to match phase with Mon-103 and multiplied in amplitude to match also; the waveform shapes are indeed very similar.
We can use the Mon-103 light curve as a template to remove the spotted-star component from the Mon-21 light curve. In order to provide as good a fit as possible, we make the following slight modifications to the observed light curve: (a) we do a zero point shift in time to align the two beginning points in phase; (b) we shift the Mon-103 light curve counts by a multiplicative factor and a zero point offset so that the mean magnitude and average amplitude match that of Mon-21; and (c) we multiply the x-axis timescale by 0.935 in order to correct for the slight period difference between the two stars. Figure 28a overlays the two light curves, and Figure 28b shows the Mon-21 flux dip light curves that results from subtracting the modified Mon-103 light curve from the observed data. The main dips appear essentially the same as in our original procedure (Figure 4c); the dip widths and depths (Table 3) differ by less than 10% between the two renditions.
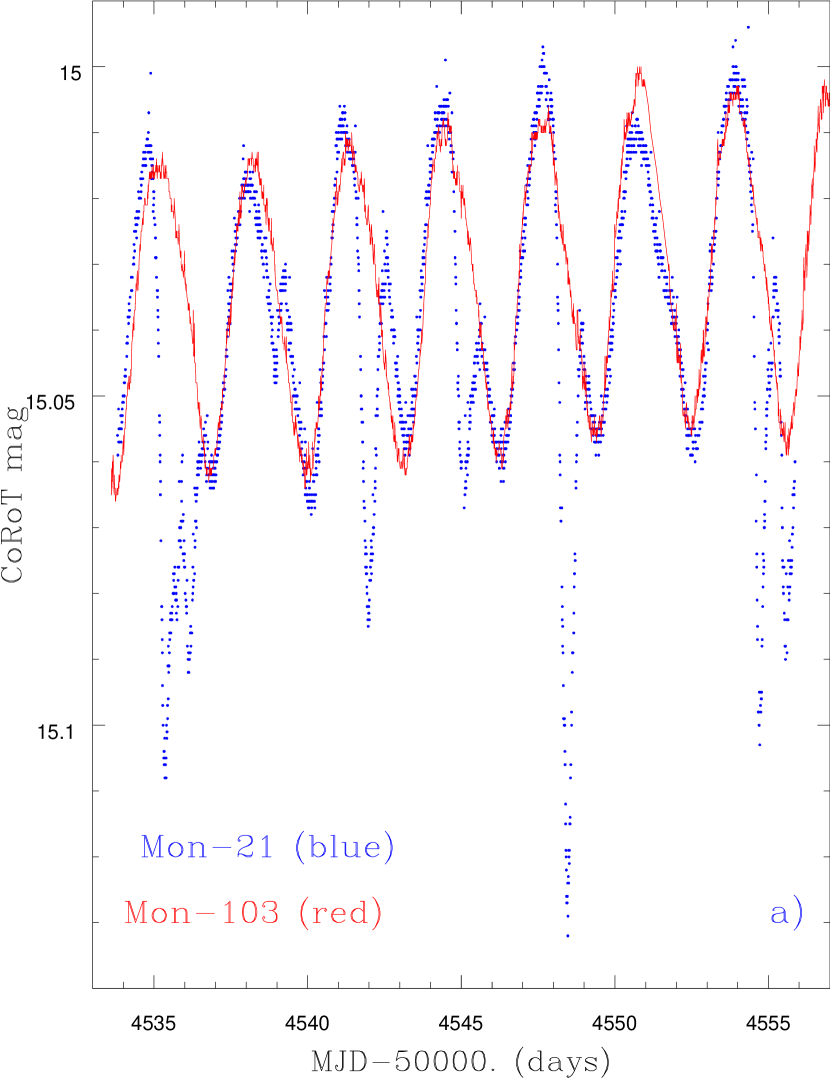
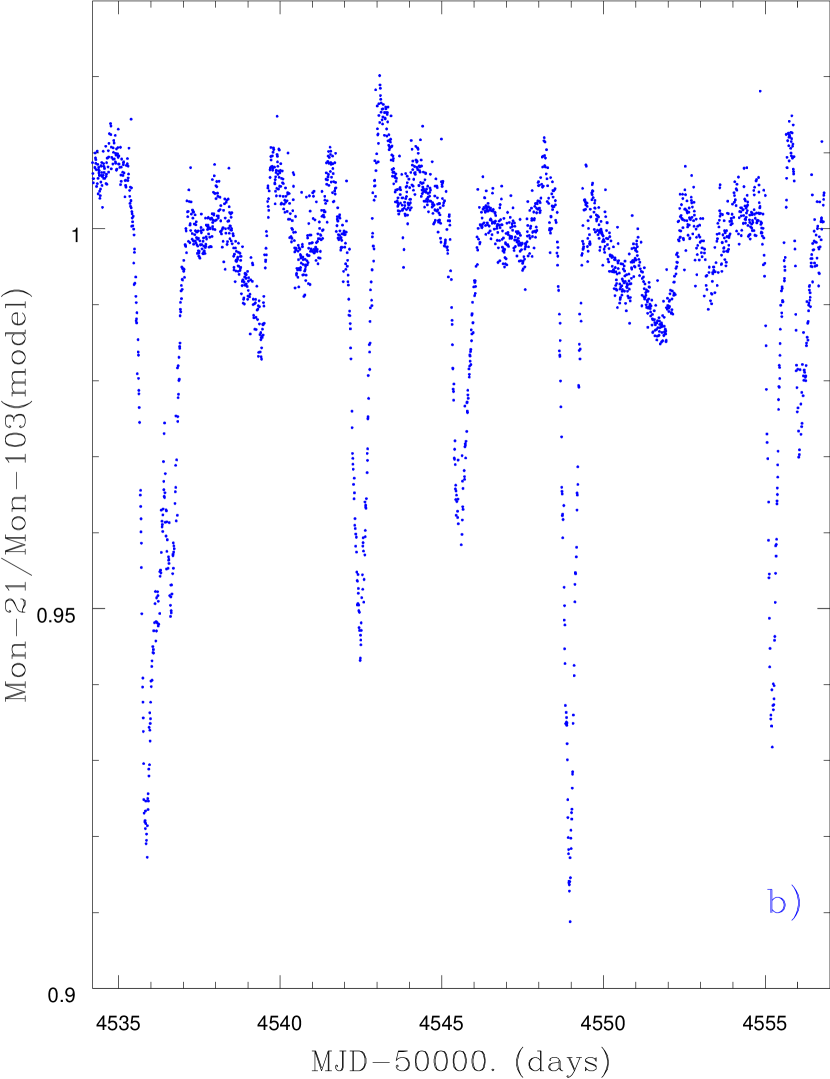
Mon-1131 in 2008
In 2011, the CoRoT light curve for Mon-1131 shows flux dips that recur periodically at P 5.1 day intervals. The light curve shows little other structure except the flux dips. The 2008 light curve shape is much more complex (see Figure 29) and probably owes its shape to several physical mechanisms whose effects are superposed. Yet, the mean magnitude is nearly the same during the two epochs, and the full range of the variations is also nearly the same (about 0.3 mag). The 2008 light curve simply has very different character. In terms of the quantitative classification scheme of Cody et al. (2014), the 2008 light curve would be classified as stochastic (with = 0.12 and = 0.71), meaning the variations are fairly symmetric about the mean and essentially aperiodic. There is still some power in the auto-correlation function at = 5.1 days, but other variability dominates.
New Spectra and Spectral Types
We obtained new spectra for several of the stars discussed in this paper, primarily in order to provide spectral types or for stars for which those data were lacking in the published literature. In particular, we obtained three Keck HIRES spectra (all on the same night) for Mon-21, a single Keck HIRES spectrum for Mon-1165, SOAR Goodman spectrograph medium resolution spectra for Mon-1131 and Mon-6975, and an INT low-resolution spectrum of Mon-1165..
Snippets from these spectra are shown in Figure 30. For Mon-21 and Mon-1165, we used the Spectroscopy Made Easy (SME; Valenti & Piskunov 1996) and BINMAG3 (Oleg Kochukhov; http://www.astro.uu.se/oleg) packages to derive estimates, as described more completely in the companion paper by McGinnis et al. (2015).
For the lower resolution, INT and SOAR spectra of Mon-1131, Mon-1165 and Mon-6975, visual inspection showed that all three stars were early to mid M dwarfs. We therefore used spectral indices based on the depths of the observed TiO bands to infer spectral types; more specifically, we used the relations in Stauffer (1982) and Stauffer & Hartmann (1986) for field M dwarfs and relations in Herczeg & Hillenbrand (2014) calibrated for YSOs. The derived spectral types are M1.5 for Mon-1131, M3 for Mon-1165, and M2.5 for Mon-6975. For Mon-1131, the field star relation yields M2 and the YSO relation yields M1 – we take the average; for Mon-6975, both relations yield M2.5. We consider these spectral types preliminary because the relations are based on flux calibrated spectra, and we did not have the data needed to flux calibrate the SOAR or INT spectra.
Coordinates and CoRoT ID’s for Stars with Single or Just a Few Short-Duration Flux Dips
As discussed in §5, a small number of the YSOs in NGC 2264 for which we have CoRoT light curves have either just one or a couple short-duration, shallow flux dips in their light curves. They therefore do not fall into any of our previously defined variable extinction classes. These stars are listed here in Table 5. All of them are Class II systems based on their IRAC photometry, though in some cases their IR excesses are relatively small.
| Mon IDaaThe Mon IDs are our internal naming scheme for stars in the field of NGC 2264 – see Cody et al. (2014). | 2MASS ID | CoRoTbbCoRoT identification number in 2008 SRa01 campaign. | CoRoTccCoRoT identification number in 2011 SRa05 campaign. | SpTddSee Cody et al. (2014) for the sources of the spectral type and H equivalent width (EW) data. All of these are in emission. | H EW (Å) |
|---|---|---|---|---|---|
| CSIMon-000119 | 06412100+0933361 | 223985987 | 223985987 | K6 | 10.6 |
| CSIMon-000342 | 06405573+0946456 | 616872592 | M4 | 21.1 | |
| CSIMon-000577 | 06414382+0940500 | 616895846 | K1 | 5.9 | |
| CSIMon-000650 | 06410098+0932444 | 223980807 | 223980807 | K1 | 6.4 |
| CSIMon-001038 | 06402262+0949462 | 602095739 | M0 | 2.7 | |
| CSIMon-001114 | 06393339+0952017 | 223957142 | 223957142 | M1.5 | 19.7 |
| CSIMon-001559 | 06393276+0904137 | 223956963 | |||
| CSIMon-001568 | 06410684+0902161 | 223982299 | 223982299 | ||
| CSIMon-006991 | 06392200+1006233 | 223953770 | 223953770 |
References
- (1) Alencar, S. et al. 2010, AA 519, A88.
- (2) Allen, L. et al. 2004, ApJS 154, 363.
- (3) Baglin, A., Auvergne, M. et al. 2009, IAUS 253, 71.
- (4) Bans, A. & Königl, A. 2012, ApJ 758, 100.
- (5) Barge, P. & Sommeria, J. 1995, AA 295, L1.
- (6) Baruteau, J. et al. 2013, ApJ 778, 7.
- (7) Bjorkman, J. & Wood, K. 2001, ApJ 554, 615.
- (8) Bouvier, J. & Bertout, C. 1989, AA 211, 99.
- (9) Bouvier, J. et al. 1999, AA 349, 619.
- (10) Bouvier, J. et al. 2006, in Protostars and Planets V, ed. B. Reipurth, D.Jewitt & K. Keil (Tucson: University of Arizona Press), 479.
- (11) Bouvier, J. et al. 2013, AA 557, 77.
- (12) Carpenter, J. et al. 2001, AJ 121, 3160.
- (13) Cody, A. et al. 2014, AJ 147, 82.
- (14) Cohen, M. & Kuhi, L. 1979, ApJSupp 41, 743.
- (15) Collier Cameron, A. & Campbell, C. 1993, AA 274, 309.
- (16) Dahm, S. & Simon, T. 2005, AJ 129, 829.
- (17) Dullemond, C. et al. 2001, ApJ 760, 957.
- (18) Espaillat, C. et al. 2011, ApJ 728, 49.
- (19) Fazio, G., et al. , 2004, ApJS, 154, 10
- (20) Findeisen, K. et al. 2013, ApJ 768, 93.
- (21) Flaherty, K. & Muzerolle, J. 2010, ApJ 719, 1733.
- (22) Flaherty, K. et al. 2012, ApJ 748, 71.
- (23) Furesz, G. et al. 2006, ApJ 648, 1090.
- (24) Gillen, E. et al. 2014, AA, 562, A50.
- (25) Helled, R. et al. 2013, astroph 1311.1142.
- (26) Herbst, W. 1986, PASP 98, 1088.
- (27) Herbst, W. et al. 1994, AJ 108, 1906.
- (28) Herczeg, G. & Hillenbrand, L. 2014, ApJ 786, 97
- (29) Indebetouw, R. et al. 2005, ApJ 619, 931.
- (30) Isella, R. et al. 2013, ApJLett 783, L13.
- (31) Jackson, R. & Jeffries, R. 2013, MNRAS 402, 1380.
- (32) Joy, A. 1945, ApJ 102, 168.
- (33) Kamezaki, T. et al. 2014, ApJSupp 211, 18.
- (34) Keane, J. et al. 2014, ApJ 787, 153.
- (35) Klagyivik, C. et al. 2013, ApJ 773, 54.
- (36) Königl, A. 1991, ApJ 370, L39.
- (37) Kraft, R. 1970, in Spectroscopic Astrophysics: An Assessment of the Contributions of Otto Struve, ed. G.H. Herbig (Berkeley: University of California Press), 385.
- (38) Lamm, M. et al. 2004, A&A 417, 557.
- (39) Lucy, L. B. 1999, A&A 344, 282.
- (40) Lyra, W. et al. 2009, A&A 497, 869.
- (41) Lyra, W. & MacLow, M. 2012, ApJ 756, 62.
- (42) Lyra, W. & Lin, M. 2013, ApJ 775, 17.
- (43) van der Marel et al. 2013, Science 340, 1199.
- (44) McClure, M. et al. 2013, ApJ 775, 114.
- (45) McGinnis et al. 2015, submitted to A&A.
- (46) Meheut, H. et al. 2010, A&A 516, 31.
- (47) Meheut, H. et al. 2012, A&A 542, 9.
- (48) Meyer, M., Hillenbrand, L. & Calvet, N. 1997, AJ 114, 288.
- (49) Monnier, J. & Millan-Gabet, R. 2002, 579, 694.
- (50) Muto, T et al. 2012, ApJ 748, L22.
- (51) Muzerolle, J et al. 2003, ApJ 597, 149.
- (52) Pecaut, M. & Mamajek, E. 2013, ApJSupp 208, 9.
- (53) Perez, L. et al. 2014, ApJ 783, 13.
- (54) Plavchan, P. et al. 2008a, ApJ 684, L37.
- (55) Plavchan, P. et al. 2008b, ApJSupp 175, 191.
- (56) Preibisch, T. et al. 1993, A&A 279, 577.
- (57) Quillen, A. et al. 2004, ApJ 612, L137.
- (58) Rafikov, R. R. 2002, ApJ 569, 997.
- (59) Rebull, L., et al. 2002, AJ 123, 1528.
- (60) Regaly, Zs. et al. 2012, MNRAS 419, 1701.
- (61) Reipurth, B. et al. 1996, AASupp 120, 229.
- (62) Romanova, M. et al. 2004, ApJ 610, 920.
- (63) Romanova, M. et al. 2008, ApJ 673, L171
- (64) Romanova, M. & Kurosawa, R. 2014, astroph 1401.4761.
- (65) Stauffer, J. 1982, AJ 87, 899.
- (66) Stauffer, J. & Hartmann, L. 1986, ApJSupp 61, 531.
- (67) Stauffer, J. et al. 2014, AJ 147, 83.
- (68) Sung, H., et al. 1997, AJ 114, 2644.
- (69) Sung, H., Stauffer, J. and Bessell, M. 2009, AJ 138, 1116.
- (70) Symington, N. et al. 2005, MNRAS 356, 1489.
- (71) Teixeira, P. et al. 2012, AA 540, 83.
- (72) Turner, N. et al. 2010, ApJ 708, 188.
- (73) Turner, N. et al. 2012, ApJ 748, 92.
- (74) Valenti, J. & Piskunov, N. 1996, A&AS 118, 595.
- (75) Venuti, L. et al. 2014, astroph 1408.0432.
- (76) Werner, M. et al. 2004, ApJSupp 154, 1
- (77) Yorke, H. W. 1986, in Numerical Solutions of the Equation of Radiation Transfer, ed. K.-H. Winkler and M.L. Norman (Dordrecht: Reidel), 141.
- (78)