Transverse field muon-spin rotation signature of the skyrmion lattice phase in Cu2OSeO3
Abstract
We present the results of transverse field (TF) muon-spin rotation (SR) measurements on Cu2OSeO3, which has a skyrmion lattice (SL) phase. We measure the response of the TF SR signal in that phase along with the surrounding ones, and suggest how the phases might be distinguished using the results of these measurements. Dipole field simulations support the conclusion that the muon is sensitive to the SL via the TF lineshape and, based on this interpretation, our measurements suggest that the SL is quasistatic on a timescale ns.
pacs:
12.39.Dc, 76.75.+i, 74.25.UvI Introduction
The understanding of matter and its excitations in terms of topology has a long history which is now allowing us an insight into the properties of quantum materials and the opportunity for their manipulation. Topological physics includes the study of kinks, vortices and monopoles in quantum field theory, which forms the basis of a successful branch of condensed matter physics chaikin ; nagaosa . A skyrmion skyrm is a topological object which has been shown to exist in a range of magnetic materials at particularly well-defined conditions of temperature and magnetic field. The simplest example of a skyrmion may be derived from a sphere studded with arrows pointing radially. A skyrmion is formed if we stereographically project the arrows onto a plane while keeping their orientations fixed. This produces a twisting pattern which turns out to be a stable knot; it cannot be untied as long as the fields remain smooth and finite. While skyrmions exist in different forms in a variety of physical systems, the clearest evidence for the existence of the skyrmion is in the spin texture of magnetic systems and in recent years a number of spectacular advances have demonstrated not only the existence of magnetic skyrmions, but also their ordering into a skyrmion lattice (SL) Muhlbauer-2009 ; Munzer-2010 ; Yu-2010 ; Yi-2010a ; Seki-2012a ; Seki-2012b ; Adams-2012 ; Seki-2012c ; Langner-2014 ; omrani . There is considerable similarity between the SL, which has recently been shown to be present in a range of non-centrosymmetric, helimagnetic systems, and another topological phase: the vortex lattice (VL) found in type II superconductors in applied magnetic field. Like the SL, the superconducting VL leads to a textured, periodic distribution of magnetic field within the body of the material, which is large on the scale of the crystallographic unit cell. In practice, the same experimental techniques that have been successfully applied to probing VL physics, such as small angle neutron scattering forgan and, in particular, muon-spin rotation (SR) steve ; sonier , could potentially be applied to probe the physics of the SL and this hypothesis forms the basis of the work reported here. In this paper we investigate the extent to which transverse field (TF) SR measurements are sensitive to the skyrmion phase in the multiferroic skyrmion material Cu2OSeO3.
Our use of TF SR to probe the SL in Cu2OSeO3 is analogous to its use in probing the VL in a type II superconductor, where the technique provides a powerful means of measuring the internal magnetic field distribution caused by the presence of the magnetic field texture steve ; sonier . In a TF SR experiment, spin polarized muons are implanted in the bulk of a material, in the presence of a magnetic field , which is applied perpendicular to the initial muon spin direction. Muons stop at random positions on the length scale of the field texture where they precess about the total local magnetic field at the muon site (mainly due to the field texture), with frequency , where MHz T-1. The observed property of the experiment is the time evolution of the muon spin polarization , which allows the determination of the distribution of local magnetic fields across the sample volume via where the phase results from the detector geometry.
For our measurements powder and single crystal samples of Cu2OSeO3 were synthesized as described previously Bos-2008 , with the same batch of polycrystalline powder also used for the growth of single crystals using the chemical vapour transport technique. The samples were characterised with powder and single crystal x-ray diffraction which confirmed that the samples were of the requisite B20 phase. The magnetic response was checked with magnetic susceptibility measurements which confirmed the magnetic transition observed at K.
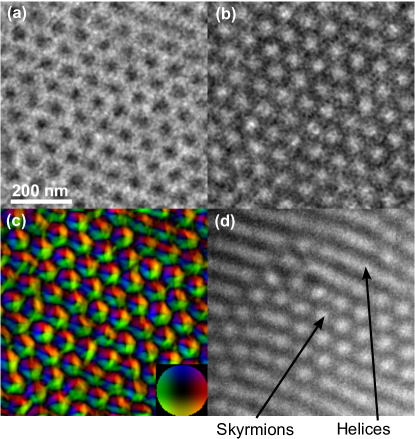
To establish the existence of skyrmions in our Cu2OSeO3 samples, a sample was prepared for electron microscopy. Single crystal samples showed clear facets and the sample was mechanically polished on a (110) face until it was 20 m thick. It was then further thinned by argon ion beam irradiation using a Gatan Precision Ion Polishing System (PIPS) initially operated at 4 kV with the ion guns set at to the sample plane. Once the sample thickness approached the wavelength of light, rainbow colours could be observed using an optical microscope and, at this point, the voltage was reduced to 2 kV and the gun angle to and thinning continued until a hole of size 15 m appeared. Images were taken from an area of sample approximately 50 nm thick surrounding this hole with an FEI Tecnai F20 transmission electron microscope (TEM) equipped with a field-emission gun using an acceleration voltage of 200 kV. In normal operation, the objective lens of the microscope applies a 2 T field to the specimen which would force it into its ferrimagnetic state so images were acquired in low-magnification mode in which the image is formed using the diffraction lens and the objective lens was weakly excited to apply a small magnetic field normal to the plane of the specimen. The sample was cooled using a Gatan liquid-helium cooled ‘IKHCHDT3010-special’ tilt-rotate holder which has a base temperature of 10 K. The images were recorded on a CCD using a Gatan Imaging Filter and they were energy-filtered so that only electrons which had lost between 0 and 1 eV on passing through the specimen contributed to the image. An aperture was also used to ensure that only the 000-beam and the low-angle scattering from the skyrmions contributed to the image. The defocus and magnification were calibrated by acquiring images with the same lens settings from Agar Scientific’s ‘S106’ calibration specimen, which consists of lines spaced by 463 nm ruled on an amorphous film. The defocus was found by taking digital Fourier transforms of the images acquired from the calibration specimen and measuring the radii of the dark rings that result from the contrast transfer function as previously describedwilliams . These TEM measurements on the thinned crystallites confirm the presence of skyrmion spin textures, as shown in Fig. 1. These occur over an extended region of the phase diagram, compared to results on bulk materials, as observed previously Seki-2012a . We also note the coexistence of skyrmions and helices, as seen in the previous microscopy studySeki-2012a .
TF SR measurements were made using the MuSR spectrometer at the ISIS facility and the GPS spectrometer at the Swiss Muon Source (SS). For measurements at ISIS the sample was mounted on a hematite backing plate in order that muons that are implanted in the hematite would be rapidly depolarized and therefore removed from the spectrum. For measurements at GPS the so-called flypast geometry was employed, where the powder sample was suspended on a fork, which prevents those muons that do not implant in the sample from contributing to the signal. For all measurements presented, the sample was cooled from in the applied field. All data analysis was carried out using the WiMDA program WiMDA .
II Results of TF SR measurements
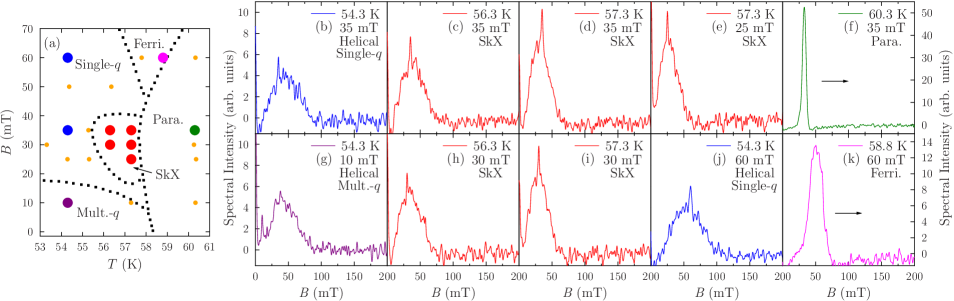
The region of the Cu2OSeO3 phase diagram of interest in this study is shown in Fig. 2(a) We note that this is the phase diagram from Ref Seki-2012a, , which differs slightly from that derived from other studies (e.g. Refs omrani, ; Adams-2012, ). In this material, spins are located on the Cu2+ ions, which are arranged in four tetrahedra within the unit cell. Ferrimagnetic (FiM) ordering of these spins is favoured, with one Cu ion (Cu1) oriented in the opposite direction to that of the others (Cu2) Bos-2008 ; Maisuradze-2011 . This ordered configuration persists when we build more complicated spin configurations described below Janson-2014 . In systems such as Cu2OSeO3 which lack inversion symmetry, chiral interactions are capable of stabilising helically ordered configurations of spins Rossler-2006 . An applied external magnetic field can further stabilise a superposition of three helical configurations in the plane perpendicular to the field (the configuration is translationally invariant in the remaining direction). The skyrmion spin textures can be formed from a triangular arrangement of the wave vectors of these helices Petrova-2010 . From the Cu2OSeO3 phase diagram, we see that below a lower critical field a phase described as the multi- helimagnetic (or simply the helimagnetic phase) exists. In bulk single-crystal samples, this consists of multiple domains of helimagnetic stripes whose vectors are aligned along the three directions Seki-2012b ; Adams-2012 . Above this lower critical field but below a second, larger critical field (above which there is a transition to a ferrimagnetic phase), the vector is aligned parallel to the direction of the field, forming a single- helimagnetic phase (also called the conical phase) where there are no multiple domains Seki-2012b ; Adams-2012 ; Seki-2012a . In Cu2OSeO3 the A-phase or skyrmion lattice phase (often denoted SkX) is centered around mT at K, close to the critical temperature where the system undergoes a transition to a paramagnetic state Seki-2012b ; Adams-2012 ; Seki-2012a . The SkX phase may be described by a phase-locked superposition of three helimagnetic textures with vectors perpendicular to the direction of the field, such that a regular lattice of skyrmions is formed. It has further been shown in a bulk single crystal system that this phase may be further subdivided into two subphases, with the lattice in the second being rotated by thirty degrees with respect to the lattice in the first Seki-2012b . The range of applied magnetic fields over which the SkX phase occurs in Cu2OSeO3 makes it well matched to the ISIS and the SS muon source time windows.
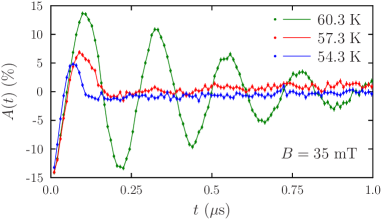
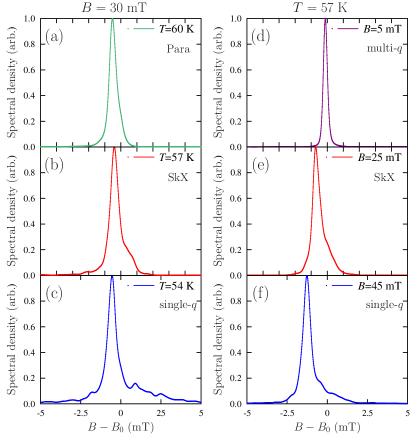
Example TF SR time-domain spectra measured at SS are shown in Fig. 3, where the increase in damping upon entering a magnetically ordered phases (in this case the skyrmion and single -phases) is evident. For our purposes, it is more instructive to consider the frequency domain spectra, as shown in Figs. 2 and 4. These were obtained via a fast Fourier transform of the time-domain spectra, using a Lorentzian filter with time constant 2.2 s. [In these spectra the spectral density is proportional to .]
We see that spectra in the skyrmion phase are characterized via a relatively narrow, asymmetric spectral density distribution, which rises steeply on the low field side leading to a sharp peak, when compared to spectra within the helical phases. This peak then decays, first very rapidly and then more gradually with increasing field. In contrast, the single- and multi- helical phases give rise to less asymmetric distributions with broader maxima and spectral weight distributed over a larger range of fields. In further contrast, the ferrimagnetic phase shows a narrowed, fairly symmetric line; while the paramagnetic regime is characterized by a very narrow linewidth (note the change of scale in Fig. 2 for spectra from these latter two phases).
Spectra in the single- phase do not show a significant change with temperature below 55 K. However, as we approach temperatures close to the transition to the paramagnetic region [Fig. 4], we see a temperature-driven effect in the single-, multi- and skymion regions, which causes the spectra to show more spectral weight at the applied field, taking on a more heavily peaked appearance. This effect is evident in several spectra [see e.g. Fig. 4(d)], but can be most clearly seen in the single- phase data measured at 50 mT and 56.3 K[Fig. 4(b)] when compared to spectra measured at lower temperature in that phase [Fig. 4(c)], which are quite unresponsive to changes in applied field. However, comparing this latter single- phase spectrum with those measured at the same temperature, but in fields thought to promote the SkX phase [Fig. 4(b)], we see that the spectra may still be distinguished: the SkX-phase spectra are more asymmetric, with spectral weight persisting on the high field side of the peak. We note that in the Lorentz TEM measurements there is evidence for the coexistence of skyrmions and helical spin textures [Fig. 1(d)]. It could be, therefore, the case that the data point in question ( mT and 56.3 K), measured on a polycrystalline sample, features a contribution from both single- and SkX phases. However, it is also worth recalling that the phase diagram of the thinned samples supports the existence of skyrmions over a wider range of the - phase diagram than for the bulk, so the cases are not straightforwardly comparable.
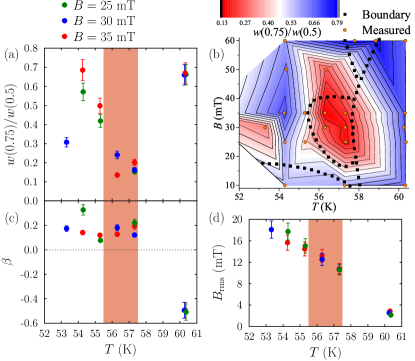
One crude way to identify the SkX region of the phase diagram from these data is via the relatively tapered lineshape observed in that phase. To this end, Fig. 5(a) shows one possible parametrization of our data that approximately captures the characteristic signal in the SkX region. In Fig. 5(a) we show the ratio of (the full peak width at 0.75 of the maximum spectral weight) to (the full width at half maximum). The contour plot in Fig. 5(b) shows that this quantity picks out the SkX phase as an island centered around 57 K and 30 mT where is suppressed. Moreover, despite the resolution of our contour plot being limited by the number of data points, we note the resemblance to the Skyrmion phase boundaries reported elsewhere. Most of the spectra obtained outside of the paramagnetic region display a small additional peak at the value of the applied field, which we ascribe to the diamagnetic response from a small portion of the muon ensemble. This might cause a further suppression of within the SkX phase, whose suppression is otherwise caused by the tapered nature of the lineshape, as the diamagnetic contribution coincides with the peak in spectral weight in the muon response caused by the internal field distribution. The limitation of this method is apparent, however, in that the data point at 50 mT and 56.3 K discussed above gives a rather similar ratio to the points in the SkX region, despite its lineshape being distinguishable via its asymmetry. As described above, one interpretation of this spectrum involves some portion of the signal arising from skyrmions, but it remains distinct from the other spectra from the SkX phase, suggesting that there is a significant single- phase contribution.
The normalized skewness of the distribution , defined via is shown in Fig. 5(c). We find that is slightly enhanced in the SkX phase compared to the single- phase, before dropping to a negative value in the paramagnetic (PM) phase. Finally, the standard deviation Fig. 5(d) of the distribution increases fairly smoothly with decreasing temperature, but is less sensitive to the SkX phase boundaries.
Our results suggest that TF SR is sensitive to the SkX phase through the muon line shape. Assuming that this is the case we may consider the mechanisms for muon relaxation and the timescales involved. We note that, in contrast to muon spectroscopy, neutron measurements of the SL are insensitive to fluctuations on timescales much slower than s (where meV is the energy scale of the resolution of the measurement) and so fluctuations on timescales longer than this appear static. Neutrons therefore take a “snap-shot” of the behaviour compared to SR measurements whose characteristic time scale is set by the gyromagnetic ratio of the muon ( MHz T-1). The sensitivity of the muon to the SL would imply that the signal from the long-range spin texture is not significantly motionally narrowed. This would imply that the SL itself is likely to be quasistatic on timescales ns. This is consistent with the long lengthscale dynamics observed via Lorentz microscopy mochizuki , which suggest rotations of the skyrmion texture take place on a 0.1 s timescale. Consistent with the observation that the muon signal below is dominated by the the distribution of static internal magnetic fields are the results of the previous zero-field SR study of this materialMaisuradze-2011 . Those measurements showed sizeable transverse relaxation of the muon precession signal, which decreased as the transition was approached from below, consistent with the decrease of the internal field with increasing temperature. This was accompanied by an increase in a small longitudinal relaxation rate, suggesting a slowing of residual dynamic fluctuations above 50 K (i.e. in the region of interest for our study). It might be expected that the nature of the dynamics changes in each of the magnetic phases. However, the contribution to the muon linewidth from the dynamic effects would seem to make only a small contribution to the overall shape.
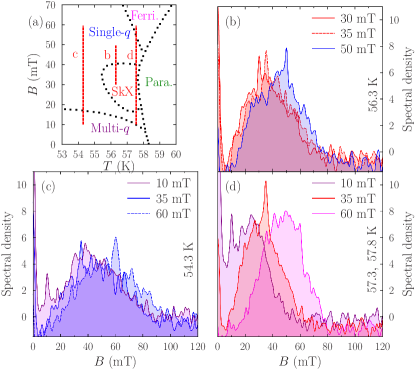
Further TF measurements were also made on a powder sample at ISIS using the MuSR instrument. In this case, we obtain similar responses as those reported above, although the analysis of these are complicated by a sizeable background contribution from muons stopping in the sample holder or cryostat tails. Example frequency spectra, obtained via maximum entropy analysis of the measured time-domain spectra, are shown in Fig. 6 for cuts through the SkX phase in field and temperature. In these we see that a knee in the spectrum develops in the SkX phase Fig. 6(b,e) on the high field side of the peak region [Fig. 6(a)]. This corresponds to the slow decay of the lineshape in high field seen in the SS data in Fig. 2. This feature is lost when we enter the single- phase Fig. 6(c,f), where the spectral weight in the knee is seen to decay into a broad distribution. In the multi- phase, the line is seen to be very narrow, suggesting that the background contribution is dominant in this case.
Measurements were repeated on other batches of powder sample, which showed some slight deviations in the position of the phase boundary to the paramagnetic phase, which we attribute to sample variability. We also made measurements at ISIS on mosaics of unoriented single crystal samples, which showed consistent results, although the lack of angular averaging and some sample variability makes a detailed comparison difficult.
III Discussion
In order to understand these results we have simulated the expected distribution for the spin configurations of this material. Owing to the complexity of the problem in a system with multiple muon sites and a complicated spin configuration, we have simulated the field distributions expected for a single crystal orientation, with the applied magnetic field along . For simplicity we generate our skyrmion spin textures here using the three- approach outlined below. We note that more sophisticated treatments of the SL are possible (e.g. Ref. bogdanov, ), whose predictions are generally in better agreement with observations. For our simulation, skyrmion-like spin configurations Muhlbauer-2009 ; Seki-2012c were generated using where
| (1) |
where are the skyrmion lattice modulation vectors, taken to be perpendicular to the applied field (), and are the unit vectors of the skyrmion lattice (also perpendicular to ). We generate a skyrmion lattice magnetization texture in the [110] plane by taking , , , , and , where and is the skyrmion wavelength. For our simulations we used a value of unit cells, similar to that suggested in Ref. Seki-2012b . This method results in a ferromagnetic (FM) ordering of the spins within a crystalline unit cell. By reversing the spin on the Cu1 sites, we generate ferrimagnetic (FiM) configurations, which results in textures that match the observed magnetic structures of the system Bos-2008 .
In addition to the SL, we have generated spin textures for the helical phases. Single- helical configurations were calculated for parallel to the [001] direction using Seki-2012c :
| (2) |
where . Reversing the Cu1 spin direction again generates the FiM configurations. The exact spin configuration of the more complicated multi- phase is not confirmed and so we have investigated a trial structure. We chose to model this phase by calculating the field distributions for FiM configurations reflecting six possible domains, each with equal population. Each domain has either parallel or antiparallel to the , or axes. Its texture is given by where and are unit vectors in the plane perpendicular to and for the parallel and anti-parallel cases respectively. Here is the unit vector in the direction of and . We average over the distributions for the six resulting textures in order to obtain our overall distribution.
We assume muons couple to the dipolar magnetic fields of the Cu2+ spins in the material. The dipole magnetic field component at a position are given by steve ; Maisuradze-2011 :
| (3) |
where and run over all three cartesian directions, labels a Cu ion at position , scales the magnetic moment to match the observed Cu ions in these systems (see below) and . A previous zero field SR study of this material Maisuradze-2011 found five muon stopping sites in each crystalline unit cell at positions and . We have simulated the field distribution expected in each of the phases at a variety of applied magnetic fields, assuming these previously proposed muon sites. For these simulations we take the magnetic moment to be , consistent with that found in a previous study Bos-2008 . For comparison with the measured spectra, the distributions were convolved with a simulated instrument function, generated with the WiMDA program.
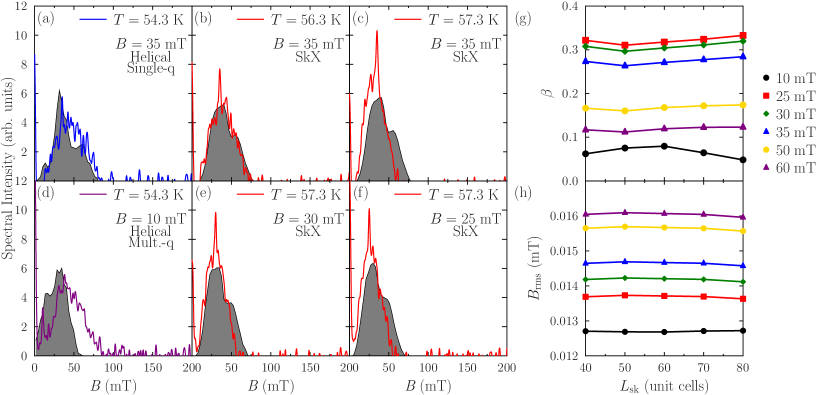
The results of these simulations are compared with the observed spectra in Fig. 7. We see that the simulations capture the line shape in the skyrmion regime quite well and are distinguishable from the predicted line shapes in the other magnetic phases. Although the agreement for the single- helical phase is reasonable, a discrepancy is evident in the multi- helical phase, as might be expected if the trial structure is not the correct one. (It is possible in this case that an alternative trial structure would produce results that match the measured spectra more closely.) We note that our results appear to be consistent with magnetic moments being localized on the Cu2+ ions, as was found from x-ray measurements Langner-2014 (although it is possible that a delocalized arrangement would match the data more closely in the multi- phase).
The simulations may also be used to test whether the muon line-shape has a sensitivity to the length scale that characterizes the SL. Plots of the width and skewness against are shown in Fig. 7, where we see that there is little variation with . It would therefore be difficult for this system to determine the in the absence of other detailed information about the phase, such as the magnetic structure, muon sites and moment sizes.
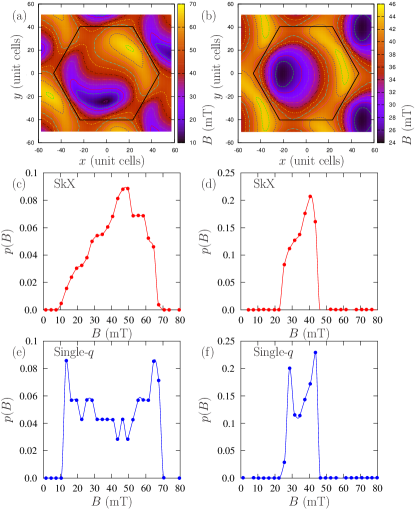
To gain some insight into how the field distributions shown in Fig. 7 arise from the SkX phase spin textures, we may consider the dipole fields produced by a skyrmion at individual muon sites. In Cu2OSeO3 this is complicated by the large number of inequivalent inequivalent muon sites Maisuradze-2011 and the ferrimagnetic arrangements of Cu2+ spins that forms the basis of the skyrmion spin texture. Fig. 8(a) and (b) show examples of the magnitude of the dipole field found at two of the five crystallographically distinct muon sites, evaluated across a single skyrmion. The corresponding field distribution derived from each is also shown [Fig. 8(c) and (d)]. The skyrmion texture is shown to give rise to an asymmetric field distribution at each site, with spectral weight skewed towards high fields. When summed over all muon sites these individual distributions produce the total distribution shown in Fig. 7. These distributions may be contrasted with those found in the single- helical phase [Fig. 8(e) and (f)], which are more symmetrical. It is difficult from these results to make general predictions regarding the dipole field distribution expected from other skyrmion materials, beyond the expectation of asymmetric field distributions at each muon site. We note that this complexity for the SL spectrum is in marked contrast to the relative simplicity of the VL spectrum, where characteristic spectral features map directly onto special positions within the VL.
In conclusion, we have presented results that suggest that TF SR is sensitive to the skyrmion lattice via measurements similar to those carried out on the vortex lattice in type II superconductors. This would imply that in Cu2OSeO3 the SL is static on a timescale ns. We are also aware of independent work currently being prepared for publication liu that demonstrates that longitudinal field SR measurements hayano are also sensitive to the skyrmion phase via changes in the spin dynamics. Taken together, these results suggest that in favourable cases SR could be utilized as a method for identifying skyrmionic materials, characterizing the behaviour of the skyrmion lattice and deriving their phase diagrams.
Acknowledgements.
This work was carried out at the STFC ISIS Facility, Rutherford Appleton Laboratory, UK and SS, Paul Scherrer Institut, Switzerland and we are grateful for the provision of beam time. We thank the EPSRC (UK) and the John Templeton Foundation for financial support. JCL acknowledges funding from the Royal Society (UK). This work made use of the Hamilton high performance computing (HPC) cluster based in Durham University and the facilities of the N8 HPC Centre provided and funded by the N8 consortium and EPSRC (Grant No.EP/K000225/1). The Centre is co-ordinated by the Universities of Leeds and Manchester. We are grateful to Y.J. Uemura and U.K. Rössler for useful discussions and Peter Baker (ISIS) and Alex Amato (SS) for experimental assistance. Data presented in this paper will be made available via http://dx.doi.rog/10.15128/kk91fm30h.References
- (1) P. M. Chaikin and T. C. Lubensky Principles of Condensed Matter Physics (CUP) (1990).
- (2) N. Nagaosa and Y. Tokura, Nature Nano. 8, 899 (2013).
- (3) T. H. R. Skyrme, Proc. Roy. Soc. Lond. A 260, 127 (1961); T. H. R. Skyrme, Nucl. Phys. 31, 556 (1962); G. E. Brown and M. Rho (Eds.) The multifaceted Skyrmion (World Scientific Singapore) (2010).
- (4) S. Mühlbauer, B. Binz, F. Jonietz, C. Pfleiderer, A. Rosch, A. Neubauer, R. Georgii, P. Böni, Science 323, 915 (2009).
- (5) W. Münzer, A. Neubauer, T. Adams, S. Mühlbauer, C. Franz, F. Jonietz, R. Georgii, P. Böni, B. Pedersen, M. Schmidt, A. Rosch and C. Pfleiderer, Phys. Rev. B 81, 041203(R) (2010).
- (6) X. Z. Yu, Y. Onose, N. Kanazawa, J. H. Park, J. H. Han, Y. Matsui, N. Nagaosa and Y. Tokura, Nature 465, 901 (2010).
- (7) X. Z. Yu, N. Kanazawa, Y. Onose, K. Kimoto, W. Z. Zhang, S. Ishiwata, Y. Matsui and Y. Tokura, Nature Mat. 10, 106 (2010).
- (8) S. Seki, X. Z. Yu, S. Ishiwata and Y. Tokura, Science 336, 198 (2012).
- (9) S. Seki, J.-H. Kim, D. S. Inosov, R. Georgii, B. Keimer, S. Ishiwata and Y. Tokura, Phys. Rev. B 85, 220406(R) (2012).
- (10) S. Seki, S. Ishiwata and Y. Tokura, Phys. Rev. B 86, 060403 (2012).
- (11) M. C. Langner, S. Roy, S. K. Mishra, J. C. T. Lee, X. W. Shi, M. A. Hossain, Y.-D. Chuang, S. Seki, Y. Tokura, S. D. Kevan and R. W. Schoenlein, Phys. Rev. Lett. 112, 167202 (2014).
- (12) T. Adams, A. Chacon, M. Wagner, A. Bauer, G. Brandl, B. Pedersen, H. Berger, P. Lemmens, and C. Pfleiderer, Phys. Rev. Lett. 108, 237204 (2012).
- (13) A. A. Omrani, J. S. White, K. Prša, I. Živković, H. Berger, A. Magrez, Y.-H. Liu, J. H. Han and H. M. Rønnow, Phys. Rev. B 89, 064406 (2014).
- (14) M. R. Eskildsen, E. M. Forgan and H. Kawano-Furukawa, Rep. Prog. Phys. 74, 124504 (2011).
- (15) S. J. Blundell, Contemp. Phys. 40, 175 (1999).
- (16) J. E. Sonier, J. H. Brewer, and R. F. Kiefl, Rev. Mod. Phys. 72, 769 (2000).
- (17) J.-W. G. Bos, C. V. Colin and T. T. M. Palstra, Phys. Rev. B 78, 094416 (2008).
- (18) D. B. Williams and C. B. Carter, Transmission Electron Microscopy (Springer, New York, 1996), Chap. 28.
- (19) F. L. Pratt, Physica B 289, 710 (2000).
- (20) A. Maisuradze, Z. Guguchia, B. Graneli, H. M. Rønnow, H. Berger and H. Keller, Phys. Rev B 84, 064433 (2011).
- (21) O. Janson, I. Rousochatzakis, A. A. Tsirlin, M. Belesi, A. A. Leonov, U. K. Rößler, J. van den Brink, H. Rosner, Nature Commun. 5, 5376 (2014).
- (22) U. K. Rößler, A. N. Bogdanov and C. Pfleiderer, Nature 442, 797 (2006).
- (23) O. Petrova and O. Tchernyshyov, Phys. Rev. B 84, 214433 (2011).
- (24) M. Mochizuki, X. Z. Yu, S. Seki, N. Kanazawa, W. Koshibae, J. Zang. M. Mostovoy. Y. Tokura and N. Nagaosa, Nature Materials 13, 241 (2014).
- (25) A. N. Bogdanov, U.K. Rössler, C. Pfleiderer, Physica B 359 1162, (2005).
- (26) L. Liu, Paper presented at MuSR2014, Grindelwald, Switzerland (abstract available from www.psi.ch/musr2014).
- (27) R. S. Hayano, Y. J. Uemura, J. Imazato, N. Nishida, T. Yamazaki and R. Kubo, Phys. Rev. B 20, 850 (1979).