15th. October 2014
Physica B, to be published
Energy versus wave vector for the conduction band of La-doped SrTiO3 interpreted by mixed-polaron theory
D.M. Eagles
19 Holt Road, Harold Hill, Romford, Essex RM3 8PN, England
E-mail address: d.eagles@ic.ac.uk
Short title: Dispersion of the conduction band of La-doped SrTiO3 PACS: 71.38.Fp; 71.38.Ht; 72.80.Ga; 79.60.-i
Keywords: Polarons, SrTiO3, ARPES
Abstract
An unusual published energy versus wave vector curve extending to the zone edge determined by ARPES in 5% La-doped SrTiO3 is interpreted using mixed-polaron theory. After modification of the theory to permit tight-binding bare energy bands and anisotropy, a fit is made to the 24 points nearest to the Fermi energy, adding the constraints (a) that the Fermi volume is approximately equal to that determined from the carrier concentration, and (b) that the transport mass from experiments is approximately twice the bare mass. In order to fit the remaining five of 29 observed points we empirically add the effect of a kink. The fit to all points is good. From the parameters of the fit to the 24 points it appears that: (a) The energy overlap integral for the narrow band in the heavy direction has the opposite sign to that for the wide band, implying that it is energetically favourable for the nearly-small polaron to be centred in between two sites; and (b) The narrower energy band in the theory may be nearly-small-polaron-like in the heavy direction but large-polaron-like in the other two directions. A simpler energy versus wave vector curve for a 1% La-doped crystal is discussed more briefly.
1. Introduction
Two recent papers have provided ARPES results on SrTiO3 [1, 2]. The first of these confirms elliptic Fermi surfaces in reduced SrTiO3 with a carrier concentration stated to be cm-3, although we think that Chang et al. meant that this was the carrier concentration per valley, and the total carrier concentration was three times larger. They found masses in the heavy and light directions of 7 and 1.2 at 150 K. These masses would be inconsistent with the observed Fermi energy of 0.046 eV if the total was as stated by them.111Dr. Chang has kindly confirmed that the carrier concentration they mentioned was per valley. The second paper [2] finds curves in a particular direction at 10 K for two La-doped crystals with La fractions of 0.01 and 0.05. The Fermi surface is reached for wave vectors well short of the zone edge in the crystal, but for the crystal the curve is shown right up to the zone edge in the -direction. The form of the dispersion is similar to that expected from what we call mixed-polaron theory, previously used to interpret many different experiments on SrTiO3 [3, 4, 5, 6].
In this type of theory the polarons are composed of mixtures of two types, large and what we call nearly small [7], and in the application of the theory to lightly-doped SrTiO3 the wave functions are composed of roughly equal proportions of the two types. Since the ratio of occupation probability of the two types is sensitive to small changes of parameters such as temperature or bare masses, properties of mixed polarons can change strongly with changes in parameters. Also, since some properties such as those depending on the density of states at the Fermi energy are more influenced by the nearly-small-polaron component of the wave function, while other properties such as transport mass are more influenced by the large-polaron component, in some experiments the polarons may seem small-polaron like and in others large-polaron like. If the bottom of the wide band has a lower energy than the bottom of the narrow band, then the effective mass increases as the energy increases, because the amount of nearly-small polaron-character increases as the energy rises. It was this property that is visible in the dispersion for the 5%-doped crystal from ARPES that first made me think that mixed-polaron theory would be relevant.
Mixed polaron theory has been used previously to interpret: 1. Large increases in effective masses in Zr-doped SrTiO3 with some Zr replacing Ti [3], deduced [8] from results on magnetic-field penetration depths in Zr-doped SrTiO3 [9]; 2. Results on infrared absorption [4] in reduced SrTiO3 at two temperatures obtained by Bursian et al. [10]; 3. Increases in masses with temperature [5] as deduced from specific-heat and thermoelectric-power measurements [11, 12, 13]; 4. Reductions in plasma frequencies as temperature rises in Nb-doped SrTiO3 [6] found by Gervais et al [14]. It has also been used, with further assumptions, to give a plausible explanation [15] as to why the density-of-states effective mass in SrTiO3 determined by tunnelling [16, 17] is smaller than that found by other methods.
Recently the term mixed-polaron has been used to indicate polarons with both coupling to breathing-modes and Su-Schrieffer-Heeger type of coupling [18]. We draw attention to the fact that this recent use of the term mixed polaron has no relation to the other meaning in our work.
Devreese et al. [19] claim that large-polaron theory alone is sufficient to interpret infrared data of van Mechelen et al. [20]. However, because they can only fit the data for photon energies greater than 300 meV, we do not find their arguments convincing. Nevertheless, one point made by Devreese et al. is that many-body effects reduce the absorption by large polarons by quite a large fraction for carrier concentrations of 1020 cm-3. How much such effects change the three contributions to the absorption involving the nearly-small component of the wave functions in either initial or final states or both in mixed-polaron theory has not been studied yet, but such effects may have to be taken into account in further study of optical properties in mixed-polaron theory for higher carrier concentrations than those of 1.1 cm-3 examined by Bursian et al..
In this paper we show that mixed-polaron theory can be used to interpret the curves right up to the zone edge in 5% La-doped SrTiO3 obtained by Meevasana et al. [2], but the energy overlap integral for the narrow band in the heavy direction is probably of opposite sign to that of the wide band. This difference in sign from that found in the lightly-doped samples is tentatively attributed to bond-centred nearly small polarons having the lowest energy above some critical doping. In 1% La-doped SrTiO3, there is too restricted a range of wave vectors for which observations have been recorded to permit confident determination of all parameters in a multiparameter fit, but we have found two sets of parameters which gives fairly good fits to the data.
In section 2 we write the basic equations of mixed-polaron theory modified from a previous formulation [5] by use of a tight-binding model with anisotropy for the bare conduction band. We also modify the theory for energies more than about 0.02 eV below the Fermi energy, where 0.02 eV is the approximate energy of a low energy phonon causing a kink in the E(k) curve at its energy. In section 3 we discuss how we fit the data, and give results for the data fitting for the 5%-doped crystal, and a briefer discussion of the results for the 1%-doped crystal. In section 4 we show how to calculate the transport mass approximately for the 5%-doped crystal in our model. In section 5 we show the calculated shape of the Fermi surface for the 5%-doped crystal, and section 6 gives a qualitative discussion of whether site- or bond-centred nearly small polarons have the lower energy. A brief discussion of the plausibility of the values of parameters found is given in section 7.
2. Mixed-polaron theory for SrTiO3
We use mixed-polaron theory in the formulation of [5], except that we first modify this theory slightly to use tight-binding forms for both the wide and narrow bands, and to allow different dispersions in different directions. Meevasana et al. [2] find the dispersion in the direction parallel to the surface, labelled the -direction, for a small value of the reduced (moduli a reciprocal lattice vector) wave vector in the direction perpendicular to the surface (-direction), and we take into account dispersion in both these directions. We assume that, when the mixed-polaron energy is within a low energy phonon eV of the Fermi energy, the energies and of the wide and narrow bands at wave vector components in the two directions measured from the energy of the narrow band at are given by
| (1) |
| (2) |
where is the energy difference of the narrow band and wide band at , and is the lattice constant. We ignore any slight orthorhombicity at low temperatures. Since the dispersion extends to the zone edge in the -direction, we assume that this is the heavy-mass direction, and the suffices and above denote ”heavy” and ”light”.
The restriction of use of the energies of equations (1) and (2) to a region close to the Fermi level is based on the fact that Meevasana et al. [2] find that an interaction corresponding to a coupling occurs with phonons of energy eV in both crystals of SrTiO3 studied, although more clearly shown for the 1%-doped crystal. This interaction gives rise to a change of slope of the curve and a sudden drop in the energy at the energy of the phonon. An interaction of strength implies that the wide-band energy overlap integrals and will increase by factors and at energies more than the relevant phonon energy below the Fermi energy, where and are the bare overlap integrals. Thus, when the mixed-polaron energy is more than the appropriate phonon energy below the Fermi energy we replace equation (1) by
| (3) |
where
| (4) |
and is introduced to make the mixed-polaron energy drop suddenly by at a critical wave number . An explicit expression for will be given shortly.
We ignore changes in the narrow band when the total polaron energy is more than the relevant phonon energy below the Fermi energy.
Introducing notations similar to those of [5], we write
| (5) |
| (6) |
| (7) |
| (8) |
Then we find that the state of the lowest mixed-polaron band with wave vector in the -plane has an energy measured from the Fermi energy given by
| (9) |
where eV is a weighted mean longitudinal polar optical phonon energy, and, if , where is the wave number where the kink starts,
| (10) |
Here
| (11) |
where
| (12) |
is twice the magnitude in phonon units of the matrix element of the Hamiltonian between orthogonalised large and nearly-small polarons of the same wave vector (assumed to be independent of wave vector), nm, and
| (13) |
By the requirement that the drop in energy at is , we find the following equation for of equation (3):
| (14) |
where
| (15) |
and
| (16) |
Equation (15) reduces to
| (17) |
From numerical data given to me by Dr. Meevasana, it looks as if the first threshold energy is closer to 0.018 eV than 0.02 eV. Also from the data it appears that nm-1 for the 5%-doped crystal and nm-1 for the 1%-doped crystal. A first guess at the second threshold energy would be the energy of the second longitudinal optical phonon ( 0.058 eV [21, 22]). However, data of Meevasana et al [2], appear to show that this second threshold is somewhere between 0.04 and 0.05 eV. For energies more than below the Fermi energy, we could introduce further changes, but we prefer to deal with the few observed points below this energy in a different way, as discussed in the next section.
3. Method of fitting data
3.1 5%-doped crystal
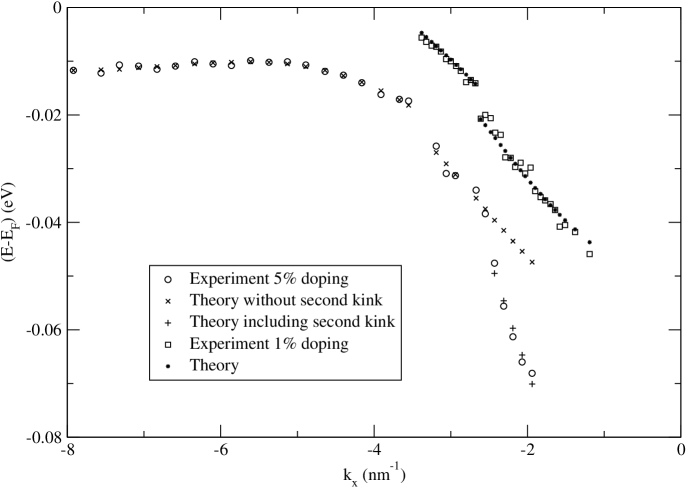
In this section we describe how we fit the data of figure 3(b) of Meevasana et al [2]. We concentrate first on fitting the 24 points nearest to the Fermi energy. The remaining five of 29 observed points are less accurate, but we can also fit them if we include a kink [23, 24] associated with the second lowest longitudinal optical phonon, with the kink determined by two parameters related to its position and slope.
Meevasana (private communication) estimates that, for a 24 eV photon energy, the reduced wave vector (modulo a reciprocal lattice vector) is about nm-1. However, the quantities appearing in this estimate may not be known accurately, and so we shall treat as adjustable initially, but check that the best-fit value is not necessarily inconsistent with Meevasana’s estimate. Then we have eight parameters appearing in the theory, i.e. , , , , , , , and . We estimate in terms of using the assumption that that the anisotropy of weak-coupling polaron masses is the same as that of bare masses. This is approximately true for weak and intermediate coupling in the Holstein model [25], but is poorer when long-range forces are included [26].
Thus we have seven parameters to fit the first 24 points. We also impose constraints (a) that the Fermi volume is in agreement with that calculated from the known carrier concentration, and (b) that the transport mass as determined by experiments [27] is approximately twice the bare mass, and (c) a constraint on based on estimates of lower and upper limits of by what factor it is reduced from its bare value . From figure 3 of [27] we estimate very approximately that the average bare mass of the two light bands up to the highest energy 110 meV above the bottom of the heavy-mass band shown in the figure is about 0.54 , and that of the heavy mass band is about 7.3 , both with appreciable uncertainties due to approximate methods of making the estimates. According to [27] there is about a factor of two increase in transport masses over bare masses at high carrier concentrations. In our theory this is partly due to the admixture of narrow-band states to the mixed polarons, and partly due to increases in the wide-band masses due to electron-phonon interactions.
Since the Fermi wave vector reaches the zone edge in the heavy direction, the volume of the Fermi surface determined by the carrier concentration requires that in the light direction the Fermi wave number is much smaller. Besides the data points we fit, we also require that the Fermi volume is consistent with that expected from the known doping level. Then, with an effective doping level of 5.6% [2], the carrier concentration per valley is cm-3, and so the Fermi volume per valley is cm-3. Hence we have the constraint
| (18) |
Here denotes the magnitude of the -plane component of the Fermi wave vector for a given . For the weighting we chose for this constraint, the value of the Fermi volume for the best fit was accurately in agreement with the value based on the estimated carrier concentration. We made approximations for the double integral.
Our constraint on is estimated as follows. The value of the bare overlap integral in the light direction which gives a bare mass of 0.54 is meV. The overlap will be reduced from the bare overlap integral by a factor which is almost certainly between a factor of (1/1.3)=0.77 assuming that the only reduction due to phonons is by the mode with energy of about 0.02 eV with a coupling paremeter of 0.3 as found empirically in [2], and by a factor which also includes the effect of unscreened interactions with longitudinal optical modes as estimated by use of [21] plus effects of anisotropy on weak-coupling polarons by Kahn [26]. With the estimate of anisotropy of bare masses given below this gives us a lower limit on approximately equal to [1/(1.3+0.45)]=0.57, where the quantity 0.45 comes from , where 1.6 is taken approximately from figure 2 of [26] with a bare-mass anisotropy of 7.3/0.54=13.5, 2.3 is the coupling constant for in SrTiO3 [21], and the mass increase in weak-coupling polaron theory is by a factor [28]. Thus we estimate that 264 meV meV, and we take these as 95% confidence limits.
How to impose the constraint involving the transport mass will be discussed in section 4.
The seven parameters determined by fitting the data with constraints as described above have the values meV, meV, , , meV, nm -1, meV, and the deduced value of the other parameter 23.5 meV.
The results for the parameters determined by the best fit are shown in figure 1. The other five unfitted points are also shown on the figure, both without and with a conjectured kink effect determined by two extra parameters for the 5%-doped crystal. The root-mean-square difference between the observed and calculated value of energy for the 24 fitted points is 0.72 meV.
The calculation of the Fermi volume used in the fit does not take into account any possible effects due to kinks. However, the kinks are expected to have the same depths in all directions, since these depths depend on the contribution of interactions with the relevant phonon modes to the electronic energy, and so the calculated Fermi volume should not be influenced by kinks.
The value of the ratio of the overlap integral associated with the bare mass of about 0.54 in the light direction determined approximately from figure 2 of [27] satisfies 1.46. The transport mass at high carrier concentrations is about twice the bare mass [27]. Thus the above ratio implies that 46% of the increase in the transport mass is due to increases of the wide-band mass above the bare mass, with the remainder due to the admixture of narrow-band states in the mixed-polaron wave function.
We note that is probably negative, i.e. a negative mass at for the nearly-small polaron band. This could be expected if the energy of the system comprised of bond-centred nearly small polarons is lower than for the case of site-centred polarons. For further discussion of this see section 6. The value of determined by our fitting is such that . This is higher than might be expected since, for site-centred polarons in lightly-doped crystals, the corresponding ratio is of the order of 0.01 [5]. For the heavy direction, the most probable ratio , which is also larger than the ratio of average overlaps of the order of 0.01 in lightly-doped crystals. We suggest tentatively that the narrow band may be composed of polarons which are nearly small and bond centred in one direction, but large in the other two directions, and that the larger ratio of narrow-band to bare overlap integrals may have different causes in different directions, i.e. because the polarons are large-polaron like in the two light directions but, for the heavy direction because of the smaller coupling to phonons for bond-centred nearly small polarons because they are more spread out. The problem of whether it is plausible to have two types of states with a fairly small matrix element of the Hamiltonian between them but with masses not drastically different in two directions might require quite a lot of work to resolve.
The value of nm-1 determined by our fit is slightly smaller in magnitude than the value of the order of 1 nm-1 estimated by Dr. Meevasana in calculations accompanying a letter, but the uncertainties in quantities put into these calculations make it look as if his estimated value would be consistent with our value. Also Dr. Meevasana in his letter states that the observed dispersion in the direction is approximately the same as if were zero.
The second kink in figure 1 commences at an energy between about 40 and 48 meV below the Fermi energy. This is lower than the energy of the middle energy longitudinal optical phonon of 58 meV in lightly-doped samples [21, 22]. Several possible explanations for this difference are: (a) the phonon energies may be lower in heavily doped crystals, (b) dispersion of the mode in a downward direction may occur in some directions in some models [29], or (c) some coupling to the transverse mode may occur when one gets away from low wave vectors. The middle transverse mode at has an energy of 22 meV in lightly-doped crystals [30].
From figure 1, we can see that the reduction in energy due to interaction with the mode involved in the second kink is somewhere between 21 and 30 meV. The coupling constant with the middle longitudinal mode in lightly doped crystals is [21]. Extrapolating from figure 2 of [26], with bare transverse and longitudinal masses of 0.54 and 7.3 , we deduce that the contribution to the polaron binding energy would be about meV in Meevasana et al.’s crystal if there were no reduction in coupling due to screening. Screening may decrease this contribution to a value closer to the lower limit of 21 meV estimated above.
For more heavily doped crystals, another kink would be expected starting at an energy below close to the highest energy longitudinal mode of energy 99 meV of the lightly-doped crystals.
Although an expression for in our theory is given in [3], it involves a sum of terms of differing signs which come close to cancelling, and so analysing the values of obtained here is not likely to be useful. Also is strongly correlated with other parameters, and so its value is not easy to interpret.
3.2 Remarks on the 1% doped crystal
Although there are 32 observed points on the curve for the 1%- doped crystal, the range of wave vectors involved and the relative simplicity of the curve makes it difficult to know whether any minimum found in our non-linear least squares fitting routine is an absolute minimum. As for the other crystal, we first added a constraint on , with an assumed most probable value of 289 meV, slightly smaller than obtained by our fit for the 5%-doped crystal because of smaller screening of electron-phonon interactions. We also imposed a constraint on based on the value found for this for the 5%-doped crystal, although we also tried putting both and equal to 1.4 meV, a value expected if there are site-centred polarons [5]. The method of estimating in [5] is appropriate when the energy of the saddle point between two minima in the polaron potential energy curve is smaller than the phonon energy For the 1%-doped crystal we took the bare mass in the heavy direction to be 5.6 rather than 7.3 in the 5%-doped crystal because band-structure calculations indicate that the bare mass in this direction decreases as carrier concentration decreases. We did not use the constraint that the transport mass is approximately equal to twice the bare mass for this crystal, as we did not know in advance an approximate shape of the Fermi surface.
For the first type of fit, with a constraint on to be close the value of 170 meV found from our fit to the data on the 5%-doped crystal, we found the following values of parameters: meV, meV, , , meV, nm-1, meV, with the deduced value of 30.3 meV. The root-mean-square difference between theory and experiment for the 32 points was 1.18 meV.
With the second procedure, with and equal to 1.4 meV, as expected for site-centred nearly small polarons [5], we found , , meV, nm-1, meV, with the deduced value of meV. The root-mean-square difference between theory and experiment for the 32 points for this case is 1.39 meV, slightly larger than for the first type of fit, but with more constraints on parameters. So we cannot say definitely whether site or bond-centred polarons are preferred in the 1%-doped crystal.
We show the fit obtained with the first set of parameters in figure 1.
4. Approximate calculation of the transport mass for the 5%-doped crystal
In this section we calculate an approximate value of the average over the Fermi surface of the transport mass (reciprocal of the average inverse mass), for the 5%-doped crystal, made with the approximation that the Fermi surface is replaced by a cylinder of radius 0.87 nm-1, chosen to give approximately the correct Fermi volume.
At a given wave vector , the reciprocal of the mass in the light direction is proportional to , where [3] , the fraction of the wide-band state in the mixed polaron of wave vector , is given by
| (19) |
with
| (20) |
Here and are given by equations (1) and (2). A similar expression occurs for the corresponding probability of occupation of the narrow band for the mixed polaron of wave vector , with the minus sign in the square bracket replaced by a plus.
The average of over the Fermi surface is given by
| (21) |
where = 0.87 nm-1 is the Fermi wave number in the -direction which gives the correct Fermi surface volume, with a similar equation for the average of the probability of occupation of the narrow-band states. We deduce that the transport mass is given by
| (22) |
where the averages are over the Fermi surface, and the factor 3/2 comes from only having only two out of three directions associated with light masses. The masses in the heavy direction do not appear in the transport mass because the Fermi surface reaches the zone edge in the heavy direction. Making the calculated mass given by equation (22) equal to the observed transport mass, which is approximately equal to , where is the bare mass [27], gives a constraint on parameter values which was used in our data fitting for the 5%-doped crystal.
5. Shapes of Fermi surfaces
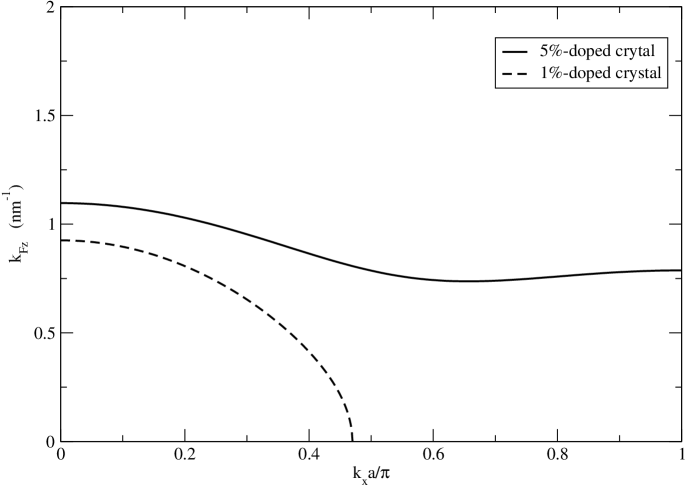
Although the Fermi surfaces are close to being cylindrically symmetric in our model, the diameters of the cylinders vary with . In figure 2 we show the cross sections in the -plane for the parameters we found.
We see that, for the 5%-doped crystal, the wave number in the -direction is maximised with a value of 1.10 nm-1 at , reaches a minimum of 0.74 nm-1 at , and has a subsiduary maximum at the zone edge. Testing whether such a shape is valid might be a worthwhile study for future ARPES measurements. The existence of a minimum in is a simple consequence of the maximum in energy as a function of , but the details of the curve of as a function of depend on the model used. The magnitude of the Fermi wave number in our model changes by less than 0.2% as the azimuthal angle in the plane of the light directions changes.
For the 1%-doped crystal, the Fermi surface cross section differs slightly from an ellipse. The value of at which reaches (0.75) of its maximum value is 0.205, which, for an ellipse would imply =0.41, whereas our model gives =0.47. Thus we have something more like an ellipse which is elongated at its ends. The magnitude of the Fermi wave vector is 4.09 times larger in the -direction than the -direction. The smaller ratio which looks as if it occurs from the figure arises because of our use of different scales for the two axes.
There appears to be a discrepancy between the ratios of magnitudes of axes of the Fermi surfaces between [1] and [2]. The value of =0.47 which we found above is close to what can be inferred directly from figure 2(a) of [2], and so does not depend strongly on our theory. The Fermi surface reported in [1] is considerably less anisotropic than that for the 1%-doped crystal in [2] despite the probably larger carrier concentration in [1]. We do not know the cause of this discrepancy.
6. Qualitative discussion of whether site-centred or bond-centred nearly small polarons have lower energy
In order to find out whether site-centred or bond-centred nearly small polarons are present, we would need a calculation of the total energy of the system for both types of polaron. For bond-centred polarons we could use our empirical parameters to estimate this energy, but for site-centred polarons we would need to rely on calculations. We are not confident that such calculations would be sufficiently accurate to determine the sign of the probably small difference in energy of the system for the two types. However, we note that the ratios of the narrow-band to bare bandwidths for what we think are bond-centred polarons are relatively large (0.37 in the light direction in the 5%-doped crystal) compared with ratio of the order of 0.01 for site-centred polarons [5]. As mentioned before, we tentatively suggest that the narrow-band states we find are connected with nearly small polarons in one direction but with large polarons in the other two directions.
Narrow-band states start to be occupied significantly when the bottom of the narrow band is within an energy of the order of of the Fermi energy, and hence the effect of the larger width of the narrow band can lower the total energy for Meevasana et al.’s crystal, but not for samples with much lower carrier concentrations. Against this we would have to take into account the probable smaller energy lowering of the local energy for bond- than for site-centred polarons. This difference will be less dependent on carrier concentration than the effect of different widths of the narrow bands because it depends on small changes in screening. Thus, while we cannot confirm that the total energy is lower for bond-centred polarons, we have an argument as to why bond-centred polarons are likely to have a lower relative energy for large carrier concentrations, and hence that a transition betwen types may be expected as the carrier concentration changes.
7. Discussion of values of some parameters
In this section we discuss to what extent values found for some of the parameters of our model are plausible. We have already given suggestions as to why is negative and its modulus rather larger than we might have guessed (bond-centred nearly small polarons), and why is not very small (polarons large-polaron like in two directions). The quantities and are difficult to estimate, because it is composed of several terms of different signs which come close to cancellation [3], and because its value is dependent on several other parameters. We do not have a theory for the size of , but a first guess would be that this should be larger if is smaller, which agrees with our fitted values. However, against the reduction of we have a probable stronger binding of nearly small polarons for smaller because of reduced screening. We have discussed previously that our values for are probably consistent with approximate estimates by Dr. Meevasana.
8. Conclusions
A good fit to curves in SrTiO3 determined by Meevasana et al. by ARPES measurements on a 5% La-doped SrTiO3 crystal is obtained by use of mixed-polaron theory. This type of theory has previously been used to interpret many types of data on SrTiO3. Of particular interest is the probable opposite sign of the energy overlap integral associated with the narrow band in the heavy direction compared with that for the wide band, and also the larger magnitude of the narrow-band energy-overlap integrals than found previously for lightly-doped samples. Both of these properties are conjectured to arise because bond-centred nearly small polarons have lower energies than site-centred ones, and, in the case of the second property, perhaps because the narrow-band states found are associated with polarons that are nearly small in one direction but large in the other two directions. For the 1% doped crystal we also obtained a fairly good fit to the data, but, because of the narrow range of wave vectors involved and the simplicity of the observed curves, we are less confident in this case that the minimum we found in our least-squares fitting routine is an absolute minimum.
Acknowledgments
I should like to thank Dr. W. Meevasana for numerical data from their ARPES work, and for a letter showing me a calculation estimating for some of their measurements, and Professor J. T. Devreese for correspondence and for a preprint of [19].
References
- [1] Y.J. Chang, A. Bostwick, Y.S. Kim, E. Rotenberg, Phys. Rev. B 81 (2010) 235109.
- [2] W. Meevasana, X.J. Zhou, B. Moritz, C.-C. Chen, R.H. He, S.-I. Fujimori, D.H. Lu , S.-K. Mo, R.G. Moore, F. Baumberger, T.P. Devereaux, D. van der Marel, N. Nagaosa, J. Zaanen, Z.-X. Shen, New Journal of Physics 12 (2010) 023004.
- [3] D.M. Eagles, Phys.Rev. 181 (1969) 1278.
- [4] D.M. Eagles, P. Lalousis, J.Phys.C 17 (1984) 655
- [5] D.M. Eagles, Physics of Disordered Materials, eds. D Adler, H Fritzsche and S R Ovshinsky, Plenum, New York, 1985, pp 357-367.
- [6] D.M. Eagles, M. Georgiev, P.C. Petrova, Phys.Rev. B 54 (1996) 22.
- [7] D.M. Eagles, Phys.Rev 145 (1966) 645.
- [8] D.M. Eagles, Phys.Rev 178 (1969) 668.
- [9] J.K. Hulm, C.K. Jones, R.C. Miller, T.Y. Tien, Proceedings of the Tenth International Conference on Low-Temperature Physics Viniti, Moscow: VINITI 1966, pp 86-114.
- [10] É.V. Bursian, G.A. Girshberg, A.V. Ruzhnikov, Fiz. Tverd. Tela 18 (1976) 578 [Sov. Phys. Solid. State 18 (1976) 335].
- [11] E. Ambler, J.H. Colwell, W.R. Hosler, J.R. Schooley, Phys. Rev. 148 (1966) 280.
- [12] H.P.R. Frederikse, W.R. Thurber, W.R. Hosler, Phys. Rev. 134 (1964) A442.
- [13] H.P.R. Frederikse, W.R. Thurber, W.R. Hosler, J. Phys. Soc. Jpn. Suppl. 21 (1966) 32.
- [14] F. Gervais, J.-F. Servoin, A. Baratoff, J.G. Bednorz, G. Binnig, Phys. Rev. B 47 (1993) 8187.
- [15] D.M. Eagles, Phys. Stat. Sol. (b) 48 (1971) 407.
- [16] Z. Sroubek, Solid State Commun. 7 (1969) 1561.
- [17] Z. Sroubek, Phys. Rev. B 2 (1970) 3170.
- [18] F. Herrera, K. Madison, R.V. Krems, M. Berciu, Phys. Rev. Lett. 110 (2013) 223002.
- [19] J.T. Devreese, S.N. Klimin, J.L.M. van Mechelen, D. van der Marel, Phys. Rev. B 81 (2010) 125119.
- [20] J.L.M. van Mechelen, D. van der Marel, C. Grimaldi, A.B. Kuzmenko, N.P. Armitage, H. Reyren, H. Hagerman, I.I. Mazin, Phys. Rev. Lett 100 (2008) 226403.
- [21] D.M. Eagles, J.Phys. Chem. Solids 26 (1965) 672.
- [22] A.S. Barker, Phys. Rev. 145 (1966) 391.
- [23] A. Damascelli, Z. Hussain, Z.-X. Shen, Rev. Mod. Phys. 75 (2003) 473.
- [24] T. Cuk, F. Baumberger, D.H. Lu, N. Ingle, X.J. Zhou, H. Eisaki, N. Kaneko, Z. Hussain, T.P. Devereaux, N. Nagaosa, Z.-X. Shen, Phys. Rev. Lett. 93 (2004) 117003.
- [25] A. Alvermann, H. Fehske, S.A. Trugman, Phys. Rev. B 78 (2008) 165106.
- [26] A.H. Kahn, Phys. Rev. 172 (1968) 813.
- [27] D. van der Marel, J.L.M. van Mechelen, I.I. Mazin, Phys. Rev. B 24 (2011) 205111.
- [28] H. Fröhlich, Advanc. Phys. 3 (1954) 325.
- [29] R.A. Cowley, Phys, Rev. 134 (1964) A981.
- [30] W.G. Spitzer, R.C. Miller, D.A. Kleinman, L.E. Howarth, Phys. Rev. 126 (1962) 1710.