Analysis of EEG signal by Flicker Noise Spectroscopy: Identification of right/left hand movement imagination
Abstract
Flicker Noise Spectroscopy (FNS) has been used for the analysis of electroencephalography (EEG) signal related to the movement imagination. The analysis of sensorimotor rhythms in time-frequency maps reveals the event-related desynchronization (ERD) and the post-movement event-related synchronization (ERS), observed mainly in the contralateral hemisphere to the hand moved for the motor imagery. The signal has been parameterized in accordance with FNS method. The significant changes of the FNS parameters, at the time when the subject imagines the movement, have been observed. The analysis of these parameters allows to distinguish between imagination of right and left hands movement. Our study shows that the flicker-noise spectroscopy can be an alternative method of analyzing EEG signal related to the imagination of movement in terms of a potential application in the brain-computer interface (BCI).
1 Introduction
Neuropsychological studies on processes occuring in the brain during the Motor Imagery (MI) show that similar parts of the brain are involved in the movement imagination as well as its real performance [1, 2, 3, 4]. The main difference between the movement execution and its imaginary is that in the latter case, the movement performance is blocked at some level of the corticospinal information transfer [5, 6, 7, 8, 9]. This phenomenon is observed in the sport psychology, where many examinations show that mental exercises have a positive effect on the later movement execution [10, 11, 12]. Similarity between the movement imagination and the real movement has been also confirmed by the research, in which healthy patients and patients with motor disabilities have been subjected to the neuropsychological observation [13, 14]. This fact causes that the movement imagination plays an important role as a control signal in the brain-computer interface (BCI) [15], which are dedicated to patients who partly or entirely lost the voluntary muscle contraction such as in the ’locked-in’ state [16, 17, 18]. The natural way of description both, the execution and the imagination of movement is the event-related desynchronization (ERD) and the event-related synchronization (ERS) [19, 20, 21, 22]. The spatiotemporal maps of ERD/ERS inform about the power decrease/increase in the brain activity in mu (813 Hz) and beta frequency range (1530 Hz), averaged over trials with respect to the power in a reference time interval [23, 24]. In case of experiment with hand movement, ERD appears in both mu and beta bands before movement (imagination) while ERS appears usually in the beta band as the post-movement beta synchronization (rebound). Since human somatotopic organization indicates that human limbs are controlled by contralateral brain hemispheres [25, 26, 27], we expect that the most important changes in the brain activity during right hand movement imagination occur mainly at electrode C3 which lies over the left hemisphere of the motor cortex whereas during left hand movement imagination at electrode laying over the right brain hemisphere i.e. C4.
Flicker Noise Spectroscopy (FNS) is a time series analysis method that introduces parameters characterizing the components of stochastic signals in different frequency ranges. So far the method has been applied to the parameterization of images produced by the atomic force microscopy (AFM) [28], analysis of geological signals measured in seismic areas (determination of earthquake precursors) [29, 30], determination of electric breakdowns precursors in thin porous silicon films [31], analysis of electric potential fluctuations in electromembrane systems [32]. FNS method has been also successfully applied to some problems in medical data processing. It is worth mentioning that the FNS method has been used to analyse the effect of different types of medical treatment on the dynamics of index finger tremor in Parkinsonian patients [33]. In Ref. [34] Timashev et al. have used FNS for the identification of the photosensitive epilepsy. Their results suggest that FNS is a promising method of early diagnosis, not only for the photosensitive epilepsy but also for other neurodegenerative diseases such as Parkinson’s, Alzheimer’s, Huntington’s, amyotrophic lateral sclerosis and schizophrenia. These suggestions have been confirmed in Ref. [35], where it has been found that the FNS parameterization of EEG signal may be used for the diagnosis of schizophrenia at the early stages of its development.
Motivated by the successful applications of the flicker-noise spectroscopy in the wide range of medical diagnoses, in the present paper we use this method to find episodes related to the imagination of the right and left hand movement. We have found that the changes in the FNS parameters allows to determine the moment at which the movement imagination occurs. It is also possible to differentiate which hand participates in the task. This classification is crucial to BCI applications.
2 The flicker-noise spectroscopy methodology
The basic idea of FNS method is the assumption that the main information about the system under study is provided by specific ”resonant” and ”chaotic” components including sequences of different types of irregularities such as spikes, jumps and discontinuities in their derivatives of different orders [36]. In FNS method the analysed signal is separated into following components: low-frequency corresponding to the system specific ”resonances” and two ”chaotic” components having the source in irregularities of the signal, appropriately spike and jumps.
The signal under consideration (in our case corresponds to the EEG signal) can be written in the form
| (1) |
where is the low-frequency signal formed by resonant component, is the chaotic component formed by spikes (mostly, the highest-frequency band based on the concept of the Dirac function) and is the chaotic component formed by jumps (mostly, the intermediate-frequency band, ”jumps-like” based on the concept of the Heaviside functions). According to FNS, the main tool to extract and analyse the information contained in the signal is the power spectrum (the cosine transform) of the autocorrelation function defined as
| (2) |
where is the time lag and is the autocorrelation function which can be expressed in the form
| (3) |
To extract the additional information contained in ( is assumed), the difference moments (Kolmogorov transient structure function) of the second order is required
| (4) |
Note that the functions and contain information averaged over time interval . In real experiment can be a subinterval of , where corresponds to the whole duration of the experiment. It is assumed that process in the interval is stationary. Thus, the time of the experiment is examined with the sliding window technique. The assumption that in the time interval the process is stationary, leads to the following form for the difference moments function
| (5) |
2.1 Signal parameterization
FNS method allows to determine several parameters which describe the dynamics/characteristic of the system. All these parameters can be extracted from chaotic components of the functions and using appropriate interpolation formulas presented underneath. The formula for the chaotic component of the difference moments is expressed as [33]
| (6) |
where , are the complete and incomplete gamma functions ( and ), is the standard deviation of the measured variable, is the Hurst constant and is the correlation time. The interpolation function for chaotic power spectrum component is separated into two independent parts related to spikes and jumps
| (7) |
| (8) |
where , , are the parameters and is expressed as
| (9) |
Parameters introduced above have a determinate physical interpretation and can be considered as parameters characterizing the signal . Parameter is the standard deviation of the signal, is the Hurst constant, which describes the rate at which the dynamic variable ”forgets” its values on the time intervals that are less than the correlation time . Time determines the characteristic time interval, during which the values of measured signal stop correlating. Parameter characterizes the boundary value of in the low frequencies bands, characterizes the boundary value of in the low frequencies bands, whereas describes the degree of the correlation loss in the frequency domain, when the frequency approach to the value . More details concerning FNS method can be found in Refs. [36, 32, 28, 37, 38, 39, 34, 40, 41, 35].
In case of nonstationary processes, it is suggested to check the dynamic of the parameters changes in the consecutive time windows (where and ), shifted within the time limit of the total duration of the experiment [39]. It is assumed that in each window the signal is stationary. This procedure is analogous to the method of the sliding window applied in the classical technique of the signal analysis.
3 Methods
3.1 Subjects and Data Acquisition
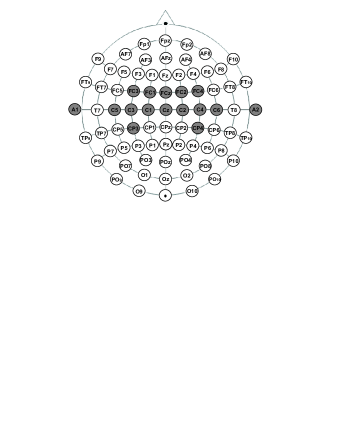
Three volunteers (two females and one male) between the ages of 24 and 35 participated in this study. Two of them are right handed and one patient is bimanual. One of them suffers from spinal muscular atrophy (SMA). All subjects gave informed consent. Each subject was seated in a comfortable armchair located about 1.5 m in front of a computer screen. Subjects were requested to relax the muscle and suppress eye blinking to avoid EMG and EOG activity artefacts. The trials with evident artefacts were excluded and only artifact-free EEG segments were used for the further analysis. Unipolar EEG-channels were recorded from 14 gold disk electrodes placed over the left and right hemisphere over the cortical hand area according to the international extended system. Disk electrodes enable to keep the resistance between electrodes in the range k. The configuration of electrodes used for the data acquisition is shown in Fig. 1. All 14 channels were referenced to the right or left ear’s lobe signals and ground from the forehead. Signals from all the channels were amplified with the biomedical signal amplifier g.USBamp (USB Biosignal Amplifier g.tec Guger Technologies). EEG was band-pass filtered between 0.5 and 100 Hz and recorded with a sample frequency of 1200 Hz.
3.2 Experimental paradigm
Since the motor imagery is not a routine natural behavior in a daily life, usually the mental training with feedback is required before subjects can perform a vivid imagination of the movement [42]. The schematic diagram of the experimental paradigm is shown in Fig. 2.
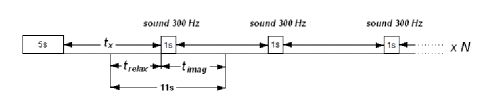
The experiment consists of 30 repetitions of right or left hand movement imagery trials. The duration time of the single trial takes 11 seconds and consists of three periods. First period, from 0 to 5 s, is the relaxation time used as the referential time needed for calculating time-frequency maps of ERD/ERS changes. In the second period, from 5 to 6 s, the sound signal indicates the performance of the hand movement imagination. The third one, from 6 to 11 s, is the time for the execution of the task and return to the relaxation state. The duration time between the consecutive stimuli varies randomly but is not shorter than 8 seconds. This condition guarantees that the referential time is not disturbed by the expectation of the stimulus. In the experiment the duration time between each stimulus is varied between 10 and 15 s. Each subject participated in at least two sessions. Each session consists of runs with 30 trials half of them is for the right and half for the left hand imagination. The number of runs depends on the tiredness of the subject.
4 Results and discussion
The ERD/ERS maps are the classical way of brain activity presentation in the experiment in which the sensorimotor cortex behaviour is investigated. In this section, we present the maps of ERD/ERS related to the hand movement imagination in the time-frequency plane. The ERD/ERS maps, calculated by the Continuous Wavelet Transform, are treated as the reference point for the FNS analysis. Then the results of the FNS parameterization methodology are presented and finally, the changes of the FNS parameters as a function of time (during imagination of hand movement) are shown.
The EEG signal recorded during the experiment has been prepared for ERD/ERS and FNS analysis in several steps. First, all trials with evident artefacts have been excluded. Second, the signal has been temporally filtered. Then, the signal has been spatially filtered using the small laplacian filter and finally, we have averaged the signal over all trials.
4.1 Time-frequency maps of ERD/ERS related to the hand movement imagination
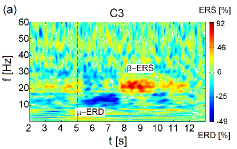
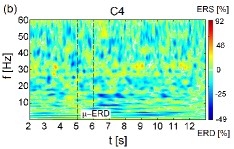
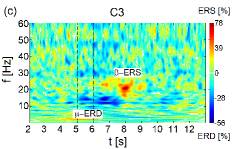
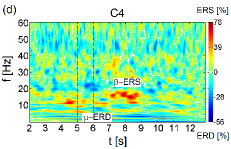
The ERD/ERS maps of the signal recorded during the imagination of the right hand movement are presented in the Fig. 3(a) and 3(b), at electrodes C3 and C4 respectively. Analogous, the ERD/ERS maps of the signal recorded at electrodes C3 and C4 during the imagination of the left hand movement are presented in the Fig. 3(c) and 3(d). The time interval of the sound signal which indicates the imagination of hand movement is marked by vertical dashed lines. In Fig. 3(a) and 3(b) it can be observed that the ERD, before and during the imagination, appears bilaterally, but mainly at the contralateral electrod C3. Simultaneously, in the range Hz the contralateral synchronization (rebound) appears after the end of the task from 8 to 10 second. This phenomenon results from the synchronization of the neuron’s beta-activity immidiatelly after the termination of the task performance at the contralateral side of the brain. The ERD/ERS maps related to the imagination of the left hand movement [see Fig. 3(c) and 3(d)] show that the rebound appears at electrode C4 (18 Hz) as well as the electrode C3 (about 20 Hz). Desynchronization in the range at the contralateral electrode is difficult to characterize and is only slightly outlined in the vicinity of 10 Hz. On the other hand at electrod C3 desynchronization in this range is distinctly evident.


These results indicate that the changes in the synchronization of rhythms occurrs contralaterally only for the imagination of the movement with dominat hand i.e. right for the considered subject. For the imagination of the movement with non-dominat hand i.e. left, changes at the ipsilateral side (C3 electrode) have similar character as at the contralateral side (electrode C4). Therefore, the imagination of the movement with left hand, non-dominat for this patient, causes relatively similar changes at both electrodes. Their lateralization is not evident.
4.2 FNS parameterization
In order to determine the parameters according to FNS methodology, the power spectrum of EEG signals has been calculated.
In Fig. 4 the power spectra (the cosine transform of the autocorrelation function) calculated using Eq. (2), for two different time intervals are shown. Figures 4(a) and 4(b) present the power spectra of the signal recorded in a time interval from 3 to 4 seconds at C3 and C4 electrodes, respectively. Since the stimulus initiates the movement imagination at second, the chosen time interval is related to the preparation to the task execution. At both electrodes the decreasing character of the EEG signal spectrum as a function of the frequency is visible with the distinct peak in 10 Hz. The peak corresponds to the dominance of the wave before the task execution. The rhythm is then reduced with intention to move and can be observed as ERD at the time-frequency maps (see Fig. 3). In Figs. 4(c) and 4(d) the power spectrum of the signal recorded from 7.5 to 8.5 seconds at C3 and C4 electrodes is presented. In this time interval the strong dominance of the rhythm at the C3 electrode in 20 Hz can be observed. This corresponds to the contralateral synchronization (rebound) visible in the time-frequency maps after the end of the task (see Fig. 3).
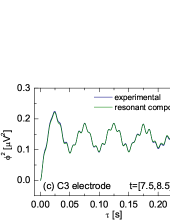
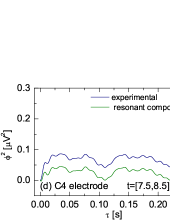
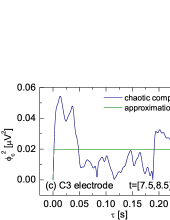
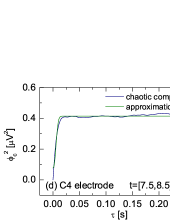
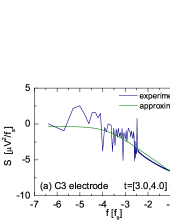
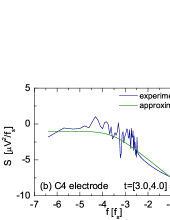
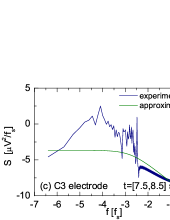
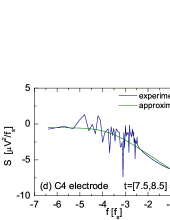
The FNS parameters are determined by the approximation of the chaotic power spectrum components using the formulas (7)(9). For this purpose the power spectra of EEG signal are presented in the logarithmic-logarithmic scale (Fig. 5). Diagrams 5(a)(d) are presented for the same data as shown in Fig. 4. With blue color the power spectrum of the experimental data is shown. In the same plot, the approximation of the chaotic component [Eq. (7)] is displayed by the green color. The approximation has beed performed by the least squares method.

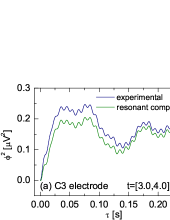
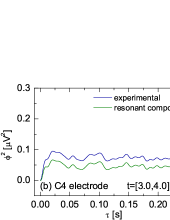
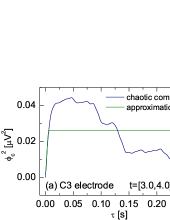
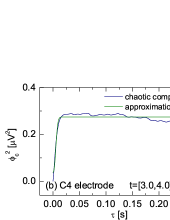
This procedure allows to determine , and parameters. The parameters , and are determined based on the difference moment presented in Fig. 6. The function calculated for the experimental data using the formula (4) is displayed by the blue line. With green color the resonant component of the difference moment is marked. The function has been determined from the resonance component of the autocorrelation function [see Eq. (5)] calculated from the resonance component by applying the inverse Fourier transformation, where . In the next step we have determined the chaotic component of the difference moments by the subtraction of the functions and . In Fig. 7, the function (blue line) and its approximation (green line) determined according to formula (6) are presented. As previously, the approximation has beed carried out with the least squares method. This procedure allows to determine parameters , , and indirectly, using the formula (9), the parameter .
4.3 Identification of right/left hand movement imagination
In order to determine the changes of the FNS parameters in time, their values have been considered in the constant time window second (what is equivalent to samples), moved along the whole duration of the experiment. For each window position, the parameters , , , , , , have been calculated with the procedure described above. Figure 8 displays the values of the FNS parameters as a function of time during the imagination of the right hand movement. Left column presents the parameters calculated for the data recorded at C3 electrode, whereas in the right column at electrode C4. We can observe that the values of parameters vary with time. Figure 8 shows that for the data recorded at electrode C3 an abrupt changes (visible as a peak) of the parameters , , , appear at about second, what corresponds to the initial moment of the movement imagination. In contrary, at electrode C4, no meaningful changes of the parameters are observed at this moment. Since changes related to the right hand movement imagination should predominantly occur at electrode C3, which lies over the left hemisphere above the area of the motor cortex, this findings agree with our expectations.
In Fig. 9, the changes of the FNS parameters as a function of time is shown during the imagination of the left hand movement. Significant increase of the parameter values , , , , at about second is observed at C4 electrode which lies over the motor areas contralateral to the left hand. At the ipsilateral electrode C3, the values of parameters , , , also increase at this moment, but this increase is lower comparing to C4 electrode. This phenomenon is also observed in ERD/ERS maps [see Fig. 3]. It seems to be characteristic, that for the subjects with strong right-handedness, changes related to the movement imagination of the dominant hand occur mainly at the contralateral electrode C3. At the same time, the non-dominant left hand movement imagination induces changes at both electrodes: contralateral C4 and ipsilateral C3.


Based on these results we can conclude that the investigation of the FNS parameters as a function of time reveals the moment of the task execution and allows to distinguish between imagination of right and left hands movement. Nevertheless, it has to be mentioned, that the length of the time window influences on the results. As the main tool to extract the information contained in the signal is the autocorrelation function, it causes that the information is averaged over the whole given time window . This means that the longer the time window is the more information is lost as an effect of averaging. In order to show this effect, in Fig. 10 the parameter as a function of time for imagination of right hand movement (at electrode C3) is shown. Calculations have been performed for four different time windows i.e. (a) s (), (b) s (), (c) s () and (d) s (). We see, that the extension of the time window above points (what corresponds to the s) causes a decay of peak and loss of the information about the movement imagination.
5 Conclusions
In summary, Flicker Noise Spectroscopy has been used to the analysis of EEG signal related to the movement imagination. Three subjects performed experiments consisted of several repetitions of either left or right hand motor imagery. The time-frequency analysis of EEG signal from scalp-mounted electrodes at locations C3 and C4 reveals the event-related desynchronization (ERD) and the post-movement event-related synchronization (ERS). The analysis of the data obtained for all subjects have yielded the consistent results with the exception of the individual characteristics. The signal has been parameterized in accordance with FNS method. Parameterization of the signal with FNS method faultless indicates the moment of movement imagination as well as the hemisphere activated by the task. This allows to effective differentiation between right and left hand movement imagination what is crucial for the potential application in the brain-computer interface.
References
References
- [1] L Deecke, W Lang, G Lindinger, G Goldenberg, I Podreka, and F Uhl. Dc-eeg, meg and spect in concert: joint investigations into human motor learning, mental imagery and voluntary movement physiology. Nano Lett., 5:245–266, 1991.
- [2] L Deecke and W Lang. Generation of movement-related potentials and fields in the supplementary sensorimotor area and the primary motor area. Adv Neurol., 70:127–146, 1996.
- [3] L Deecke. Planning, preparation, execution, and imagery of violitional action. Cognit Brain Res, 3:59–64, 1996.
- [4] R Kuś, J S Ginter, and K J Blinowska. Propagation of eeg activity during finger movement and its imagination. Acta Neurobiol Exp, 66:195–206, 2006.
- [5] J Decety, B Philippon, and D H Ingvar. r cbf landscapes during motor performance and motor ideation of a graphic gesture. Eur Arch Psy Clin N, 238:33–38, 1988.
- [6] J Decety and D Boisson. Effect of brain and spinal cord injuries on motor imagery. Eur Arch Psychiatry Clin Neurosci., 240:39–43, 1990.
- [7] J Decety, M Jeannerod, D Durozard, and G Baverel. Central activation of autonomic effectors during mental simulation of motor actions. J Physiol, 461:549–563, 1993.
- [8] M Jeannerod. The representing brain: neural correlates of motor intention and imagery. Behav Brain Sci, 17:187–202, 1994.
- [9] M Jeannerod. Mental imagery in the motor context. Neuropsychologia, 33:1419–32, 1995.
- [10] D L Feltz and D M Landers. The effects of mental practice on motor skill learning and performance: A meta-analysis. JSEP, 5:25–57, 1983.
- [11] M Denis. Visual imagery and the use of mental practice in the development of motor skills. Can J Appl Sport Sci, 10:4–16, 1985.
- [12] W Rodgers, C Hall, and E Buckolz. The effect of an imagery training program on imagery ability, imagery use, and figure skating performance. J Appl Sport Psychol, 3:109–125, 1991.
- [13] P Dominey, M Arbib, and J-P Joseph. A model of corticostrital plasticity for learning oculomotor associations and sequences. J Cogn Neurosci, 7:311–336, 1995.
- [14] C Neuper, G R Muller, and A Kubler. Clinical application of an eeg-based brain-computer interface: a case study in a patient with severe motor impairment. Clin Neurophysiol, 114:399–409, 2003.
- [15] J R Wolpaw, N Birbaumer, D J Mc-Farland, G Pfurtscheller, and Vaughan T M. Brain-computer interfaces for communication and control. Clin Neurophysiol, 113:767–791, 2002.
- [16] Vaughan T.M. Wolpaw J.R. McFarland D.J., Miner L.A. Mu and beta rhythm topographies during motor imagery and actual movement. Brain Topogr, 12:177–186, 2000.
- [17] J A Pineda, B Z Allison, and A Vankov. The effects of self-movement, observation, and imagination on rhythms and readiness potentials (rp’s): toward a brain-computer interface (bci). IEEE Trans Rehabil Eng, 8:219–222, 2000.
- [18] R Kuś, D Valbuena, J Żygierewicz, T Malechka, A Graeser, and P Durka. Asynchronous bci based on motor imagery with automated calibration and neurofeedback training. IEEE Trans Neural Syst Rehabil Eng, 20:823–35, 2012.
- [19] G Pfurtscheller and A Aranibar. Event-related cortical desynchronization detected by power measurements of scalp eeg. Electroenceph clin Neurophysiol, 42:817–26, 1977.
- [20] G Pfurtscheller and A Aranibar. Evaluation of event-related desynchronization (erd) preceding and following voluntary self-paced movements. Electroencephalogr Clin Neurophysiol, 46:138–46, 1979.
- [21] G Pfurtscheller and C Neuper. Event-related synchronization of mu rhythm in the eeg over the cortical hand area in man. Neurosci Lett., 174:93–96, 1994.
- [22] G Pfurtscheller and F H Lopes da Silva. Handbook of electroencephalography and clinical neurophysiology. ed Pfurtscheller G and Lopes da Silva FH, (Amsterdam: Elsevier), 1999.
- [23] P J Durka, J Żygierewicz, H Klekowicz, J Ginter, and K J Blinowska. On the statistical significance of event-related eeg desynchronization and synchronization in the time-frequency plane. IEEE T Bio-Med Eng, 51:1167–1175, 2004.
- [24] J Żygierewicz, P J Durka, H Klekowicz, P J Franaszczuk, and Crone N E. Computationally efficient approaches to calculating significant erd/ers changes in the time-frequency plane. J Neurosci Meth, 145:267–276, 2005.
- [25] A Jr. Stancak and G Pfurtscheller. The effects of handedness and type of movement on the contralateral preponderance of mu-rhythm desynchronization. Electroencephalogr Clin Neurophysiol, 99:174–182, 1996.
- [26] A Jr. Stancak and G Pfurtscheller. Event-related desynchronization of central beta rhythms in brisk and slow self-paced finger movements of dominant and nondominant hand. Cogn. Brain Res., 4:171–183, 1996.
- [27] J Jr Ginter, K J Blinowska, M Kamiñski, P J Durka, G Pfurtscheller, and C Neuper. Propagation of eeg activity in the beta and gamma band during movement imagery in humans. Methods Inf Med., 44:106–13, 2005.
- [28] S F Timashev, V E Belyaev, P S Timashev, and A B Solovieva. On parameterization of surface structures. Colloid J., 68:481–493, 2006.
- [29] V Descherevsky, A A Lukk, A Y Sidorin, G V Vstovsky, and S F Timashev. Flicker-noise spectroscopy in earthquake prediction research. NHESS, 3:159–164, 2003.
- [30] L Telesca, V Lapenna, S Timashev, G Vstovsky, and G Martinelli. Flicker-noise spectroscopy: a new approach to investigate the time dynamics of geoelectrical signals measured in seismic areas. Phys Chem Earth, 29:389–395, 2004.
- [31] V Parkhutik, E Rayon, C Ferrer, S Timashev, and G Vstovsky. Forecasting of electrical breakdown in porous silicon using flicker noise spectroscopy. Phys Status Solidi, 197:471–475, 2003.
- [32] S F Timashev and G V Vstovskii. Flicker-noise spectroscopy for analyzing chaotic time series of dynamic variables: Problem of signal-to-noise relation. Russ. J. Electrochem, 39:141–153, 2003.
- [33] R M Yulmetyev, S A Demin, O Y Panischev, P Hanggi, S F Timashev, and G V Vstovsky. Regular and stochastic behavior in parkinsonian pathological tremor signals. Physica A, 360:655–678, 2006.
- [34] S F Timashev, Y S Polyakov, R M Yulmetyev, S A Demin, O Y Panischev, S Shimojo, and J Bhattacharya. Analysis of biomedical signals by flicker-noise spectroscopy: identification of photosensitive epilepsy using magnetoencephalograms. Laser Phys, 19:836–854, 2009.
- [35] S F Timashev, Y Oleg, Y Panischev, S Polyakov, A Deminc, and A Kaplane. Analysis of cross-correlations in electroencephalogram signals as an approach to proactive diagnosis of schizophrenia. Physica A, 391:1179–1194, 2012.
- [36] S F Timashev. Flicker-noise spectroscopy in analysis of chaotic flow in distributed dynamic dissipative systems. Russ. J. Phys. Chem., Engl. Transl., 75:17421749, 2001.
- [37] S F Timashev and G V Vstovskii. Flicker noise spectroscopy and its application: information hidden in chaotic signals. Russ. J. Electrochem, 42:424466, 2006.
- [38] S F Timashev and Y S Polyakov. Review of flicker noise spectroscopy in electrochemistry. Fluct. Noise Lett., 7:R15R47, 2007.
- [39] S F Timashev and Y S Polyakov. Analysis of discrete signals with stochastic components using flicker noise spectroscopy. Int. J. Bifurcation Chaos, 18:27932797, 2008.
- [40] S F Timashev, Y S Polyakov, P I Misurkin, and S G Lakeev. Anomalous diffusion as a stochastic component in the dynamics of complex processes. Phys. Rev. E, 81:1–17, 2010.
- [41] S F Timashev, Y S Polyakov, R M Yulmetyev, S A Demin, O Y Panischev, S Shimojo, and J Bhattacharya. Frequency and phase synchronization in neuromagnetic cortical responses to flickering-color stimuli. Laser Phys, 20:604617, 2010.
- [42] C Neuper, R Scherer, S Wriessnegger, and G Pfurtscheller. Motor imagery and action observation: modulation of sensorimotor brain rhythms during mental control of a brain-computer interface. Clin Neurophysiol, 120:239247, 2003.