figure \MakeSortedtable
11email: ghassem.gozaliasl@helsinki.fi 22institutetext: Department of Theoretical Physics and Astrophysics, University of Tabriz, P.O. Box 51664, Tabriz, Iran 33institutetext: School of Astronomy, Institute for Research in Fundamental Sciences (IPM), Tehran, Iran 44institutetext: Institute of Astronomy, University of Cambridge, Madingley Road, Cambridge CB3 0HA, UK
Evolution of the galaxy luminosity function in progenitors of fossil groups
Using the semi-analytic models based on the Millennium simulation, we trace back the evolution of the luminosity function of galaxies residing in progenitors of groups classified by the magnitude gap at redshift zero. We determine the luminosity function of galaxies within , and for galaxy groups/clusters. The bright end of the galaxy luminosity function of fossil groups shows a significant evolution with redshift, with changes in by 1-2 mag between and (for the central ), suggesting that the formation of the most luminous galaxy in a fossil group has had a significant impact on the galaxies e.g. it is formed as a result of multiple mergers of galaxies within the last 5 Gyr. In contrast, the slope of the faint end, , of the luminosity function shows no considerable redshift evolution and the number of dwarf galaxies in the fossil groups exhibits no evolution, unlike in non-fossil groups where it grows by % towards low redshifts. In agreement with previous studies, we also show that fossil groups accumulate most of their halo mass earlier than non-fossil groups. Selecting the fossils at a redshift of 1 and tracing them to a redshift 0, we show that 80% of the fossil groups () will lose their large magnitude gaps. However, about 40% of fossil clusters ( ) will retain their large gaps.
Key Words.:
Galaxies: groups: general – Galaxies: clusters: general-Galaxies: luminosity function – Galaxies: formation-Galaxies:evolution– Galaxies: redshifts – Galaxies: elliptical– Methods: numerical1 Introduction
The first fossil galaxy group, , was discovered by Ponman et al. (1994). Since then, a number of studies have revealed that these systems exhibit interesting properties compared to similar normal groups and clusters (e.g. Vikhlinin et al. 1999; Jones et al. 2003; Khosroshahi, Ponman & Jones 2006; Khoroshahi, et al 2006; Khosroshahi et al. 2007; Dariush et al. 2007; Miller et al. 2012; Proctor et al. 2011; Eigenthaler & Zeilinger 2013; Khoroshahi, Jones & Ponman 2004; La Barbera et al. 2009).
According to the first formal definition presented by Jones et al. (2003), a fossil group of galaxies is identified as an extended X-ray source with L2.13 1042 hergs-1 that includes a luminous elliptical galaxy with at least two magnitude difference in the R-band from the second brightest galaxy located within half the virial radius.
Jones et al. (2003) reported 8% to 20 % of all galaxy groups have the same X-ray luminosity as fossil groups. The redshift evolution of the fossil fraction has been studied by Gozaliasl et al. (2014), finding that fossil groups constitute % and % of massive galaxy groups () at and , respectively. In the semi-analytic halo catalogue, based on the Millennium simulation, 7.20.2 per cent of massive groups are fossils (Dariush et al. 2007).
Today, there is no consensus about the origin of fossil groups (Mulchaey & Zabludoff 1999; Cypriano et al. 2006; Ponman et al. 1994; Aguerri et al. 2011; Proctor et al. 2011; Girardi et al. 2014; Zarattini et al. 2014). Mulchaey & Zabludoff (1999) portrayed a fossil group as a “failed group” in which the majority of the baryonic materials were used in building up the giant elliptical galaxy, rather than in several massive galaxies. In contrast, following Barnes (1989), number of studies have suggested that the central elliptical galaxy in a fossil group forms because of multiple mergers of massive galaxies in groups in a few tenths of a Hubble time. For this to be a viable formation scenario, we expect fossil groups to present a luminosity function (LF) with a deficit of galaxies. The key lies in the timescale for the merging of dwarf galaxies and cooling group X-ray halo (Ponman & Bertram 1993; Ponman et al. 1994), which is much longer than the timescale for the merging of more luminous galaxies. The final product of these mergers are present day isolated ellipticals, which are immersed in group size X-ray halos and surrounded by substantially fainter galaxies (e.g. Ponman et al. 1994; D’Onghia et al. 2005).
D’Onghia et al. (2005) found that fossils have assembled half of their current dark matter mass at above z, having enough time to merge L∗ galaxies and increase the magnitude gap between the first and second brightest group galaxies. Using the Millennium simulations, Dariush et al. (2007) revealed that fossils have accumulated a larger fraction of their final halo mass at any redshift earlier than non-fossil groups of similar X-ray luminosity, and concluded that an early formation of fossil systems. However, von Benda-Beckmann et al. (2008) traced fossil groups since z1 and pointed out that the majority of these systems fill their large magnitude gap due to the infall of luminous galaxies, suggesting that the fossil phase is an evolutionary stage of a galaxy group. Supporting this suggestion, we show that some fossil groups in our XMM-CFHTLS galaxy groups catalogue at include few galaxies outside the 0.5, which are brighter than the second brightest galaxy used for magnitude gap calculation (Gozaliasl et al. 2014).
Eigenthaler & Zeilinger (2013) determined flat metallicity gradients for six fossil galaxies, in contrast to the steep slope predicted by a monolithic collapse, suggesting multiple mergers of galaxies for the formation of fossil groups. Recently, following the fossil group origins project, Aguerri et al. (2011), Zarattini et al. (2014), and Girardi et al. (2014) carried out a multi-wavelength study of a sample of 34 fossil group candidates, revealing that the brightest group galaxy (BGG) in a fossil group forms from the merger/cannibalism of the galaxies and the large magnitude gap in fossil groups is the result of an evolutionary effect and the extreme merger ratio of galaxies within these systems. Moreover, Miraghaei et al. (2014) have reported on the radio properties of the brightest group galaxies in fossil groups in which they discover that such galaxies are under-luminous in radio, compared to non-fossil group galaxies of similar stellar mass.
We aim to use the semi-analytic model (SAM) of Guo et al. (2011, hereafter G11), to study the composite LF of galaxies in fossil and non-fossil groups down to an absolute magnitude of mag. We use a well-defined, mass-selected sample of galaxy groups and clusters at redshift zero and trace these halos and their properties up to . In order to find any effect of galaxy mergers on the composite LF of galaxies in fossil groups, we examine evolution of the luminosity of the bright end and the faint end slope as a function of redshift within a redshift range of 01. We compare our results with those of non-fossil groups with similar halo mass and BGG luminosity. In this paper, we also investigate the halo mass assembly history and the growth of the magnitude gap.
In §2, we describe data and define galaxy groups sample. Section 3 reports the halo mass assembly history and evolution of the magnitude gap of groups. Section 4 describes the galaxy LF and the redshift evolution of Schechter function parameters. In §5, we discuss our results and present conclusions. Throughout this paper, we adopt a ‘concordance’ cosmological model, with .
2 Data and sample selections
2.1 Millennium simulation and semi-analytic galaxy catalogue
The SAM of galaxy formation used in G11, is implemented on the stored output of a very large cosmological N-body simulation, the Millennium simulation (Springel et al. 2005). The Millennium simulation assumes a CDM cosmology with parameters, (, based on a combined analysis of the 2dFGRS (Colless et al. 2001) and the first-year WMAP data (Spergel et al. 2003). Despite the fact that these values not the most recent results (e.g., WMAP7 and Planck Colabration XVI 2013), they correctly reproduce the group abundance and clustering of dark halos at low-. The value is higher in the Millennium simulation than in the WMAP7 results. This generally results in a discrepancy in the size and the luminosity density of the structures (Tavasoli et al. 2013). While this might have an effect on the space density of fossil groups, the present study focuses on the evolution of the composite luminosity function based on SAMs, between and the present day. Guo et al. (2013) implement SAM on both Millennium and Millennium II simulations in two cosmologies based on WMAP1 and WMAP7 to investigate how the formation, evolution, and clustering of galaxies vary in different cosmologies. The increased matter density and decreased linear fluctuation amplitude in WMAP7 have compensating effects, so that the abundance and clustering of dark halos are predicted to be very similar to those in WMAP1 for 3. Therefore, the main findings of our study should remain intact.
The Millennium simulation traces particles with typical masses of M⊙ from redshift 127 to the present day. A friends-of-friends (FOF) algorithm is used to identify groups by linking particles with separation less than the mean inter-particle separation (Davis et al. 1985). Identification of the sub-halos in each FOF group is done using the SUBFIND algorithm (Springel et al. 2001). The G11 is an updated and extended version of earlier galaxy formation models based on the Millennium simulation (Springel et al. 2005; Croton et al. 2006; De Lucia & Blaizot 2007). To estimate photometric properties of galaxies, G11 uses a Chabrier IMF and stellar population synthesis model from Bruzual & Charlot (2003).
Following White & Frenk (1991), G11 defines a cooling radius as the radius within which the cooling time of the gas equals the current age of the halo, and compares it with the virial radius (). If the virial radius becomes smaller than the cooling radius, the gas is accreted on the central galaxy on a free-fall timescale (rapid infall regime). Conversely, if the virial radius becomes larger than the cooling radius, cooling occurs in a statistic cooling flow. G11 utilizes a new prescription for satellite galaxies: when a galaxy passes outside , it is no longer subject to the tidal and ram-pressure forces. The gas stripping from satellites is gradual, allowing the star formation to continue. Thus, in this model, satellite galaxies can stay blue for longer periods. G11 also includes starbursts triggered by a major merger associated with the mass ratio of the merging progenitors in excess of 0.3. When a major merger occurs, all of the stellar masses of the merging galaxies are transformed to the bulge, while only a fraction of cold gas is turned into the bulge stars, in accordance to the implementation of Somerville et al. (2001). This model also includes the satellite-satellite mergers and the disruption of satellite galaxies in presence of strong tidal forces, which can reduce the number of satellite and dwarf galaxies (which are generally overpredicted by the most SAMs) in massive halos. G11 uses a new disc model that separately allows the gas and stellar discs to grow continuously in mass and angular momentum. A velocity dependent model of supernovae feedback model is adopted in G11. G11 model also implements both radio and quasar modes of the active galactic nuclei (AGN) feedback following Croton et al. (2006). It also allowed the radio mode of AGN feedback to occur in satellite galaxies.
2.2 Definition of fossil groups and sample selection
In order to define our sample of galaxy groups (e.g. fossil groups) we assume the coordinates of the BGGs as group centres and then measure the magnitude gap, , between the first and second brightest galaxies within a half of the projected radius enclosing 200 times the mean density, , of each galaxy group, similar to the convention used in studies of fossil groups (Jones et al. 2003). We define three samples of galaxy groups based on the magnitude gap measurements:
(i) groups with mag as fossil groups,
(ii) groups with mag as non-fossil or control groups, and
(iii) to understand whether distinguishes between galaxy groups, we also select a sample of groups with any values of . This helps us find the robustness of as an optical criterion in identifying fossil groups.
The constraint on the halo mass results in an initial sample of 51366 galaxy groups at z, with 13 per cent fossil groups and 25 per cent mag control groups.
For each sample of galaxy groups, we define three sub-samples following the halo mass and the BGG luminosity ranges:
(SI) and ,
(SII) and , and
(SIII) and .
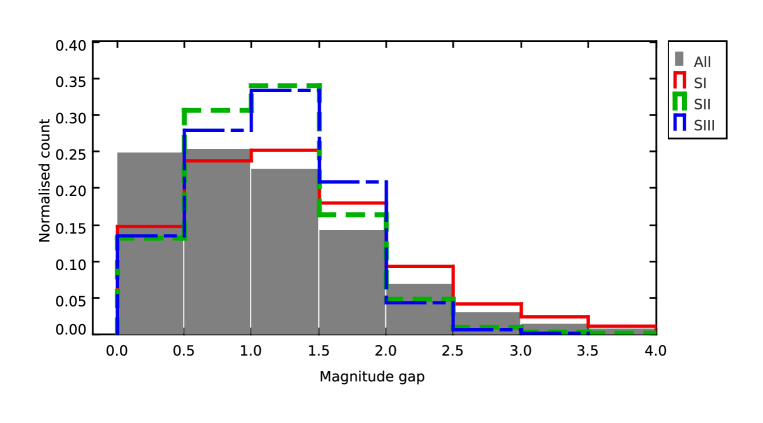
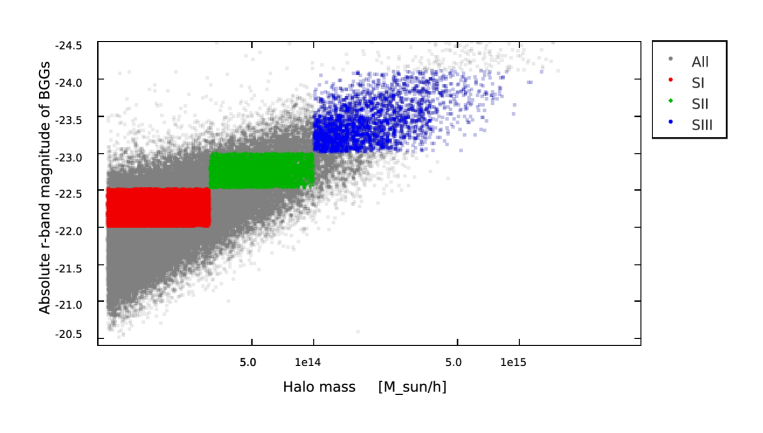
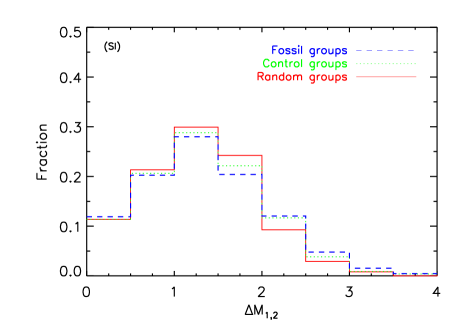
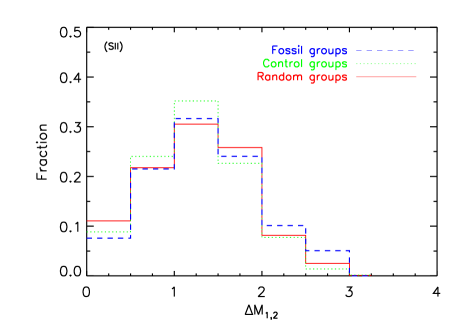
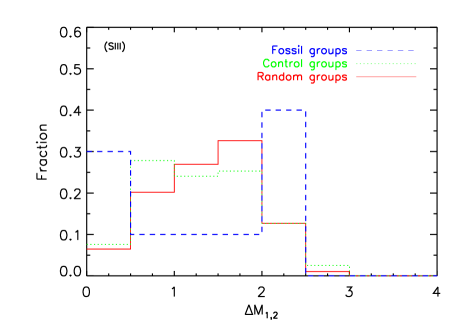
We select 1481, 307, and 89 galaxy groups at of each group type obeying the SI, SII, and SIII criteria, respectively. The constraint on the luminosity of BGG enables us to select relatively homogeneous sub-samples and also to detect a presence of a large magnitude gap in the shape of composite LF of fossil groups. Otherwise, the large gap in the bright end of the composite LF is filled by combining groups with different BGGs. In Fig. 1 (lower panel), we plot the absolute r-band magnitude of BGGs () versus halo mass for all groups (gray points) and for all group sub-samples at . We select our sample of the fossil, control, and random groups from the highlighted sub-samples.
3 The and the halo mass evolution of galaxy groups
3.0.1 Tracing the backwards
Magnitude gap has been often used as a tool to understand the dynamical age and formation history of galaxy groups (Milosavljević et al. 2006; Dariush et al. 2007, 2010; van den Bosch et al. 2007). Based on simulations, D’Onghia et al. (2005) showed that early formed galaxy groups, such as fossil groups, have a large magnitude gap. In Fig. 1 (upper panel), we show the magnitude gap distribution for all groups at z=0 and for SI (solid red histogram), SII (dashed green histogram), and SIII (long-dashed blue histogram). It appears that the fraction of fossil groups decreases with increasing halo masses.
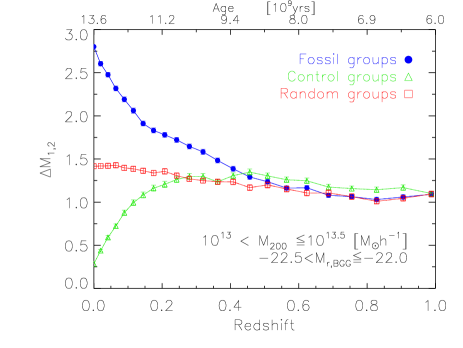
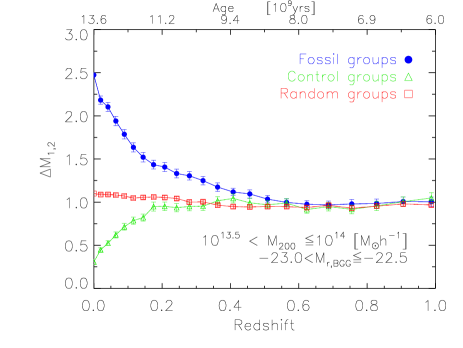
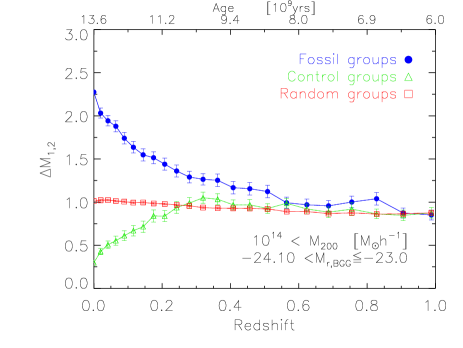
In order to understand the time evolution of parameter, we trace backwards all halos in our sub-samples from z to z and measure their mean magnitude gaps at each redshift slice. In Fig.2, we illustrate the mean magnitude gap as a function of redshift for SI (top panel), SII (middle panel), and SIII (bottom panel) sub-samples. We find that the mean magnitude gap of fossils decreases to a lower value with increasing redshift, so that at z0.5 we detect no differences between all three samples of groups. In contrast to fossils, the mean magnitude gap for the control sample grows with increasing redshift between to . We detect no redshift evolution for the mean magnitude gap of random groups. We detect no difference for the magnitude gap evolution between different subsamples shown in Fig. 2.
3.0.2 Tracing the forwards
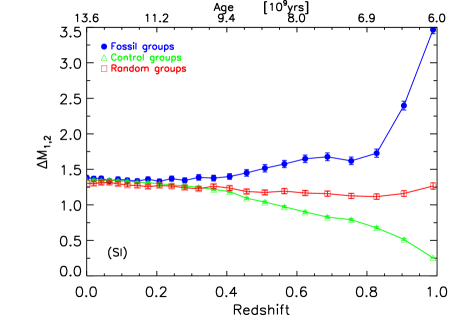
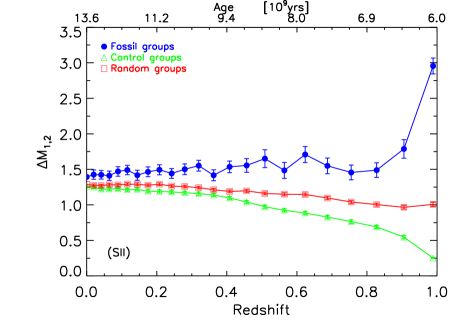
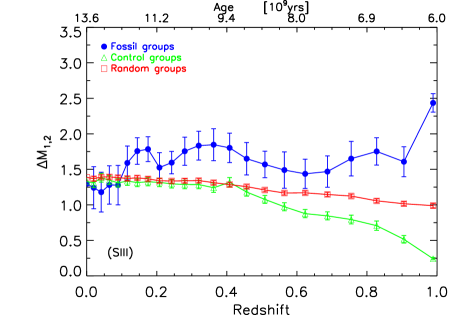
Similar to von Benda-Beckmann et al. (2008), we examine whether the magnitude gap of groups evolves forwards in time and select three different sub-samples of fossil, control, and random groups at , according to the mass ranges defined in §2.2. We use a similar cut for the absolute magnitude of BGGs ( mag) for all halos. We track these groups forwards in time from z to z (Fig. 3). In agreement with von Benda-Beckmann et al. (2008), we find that the majority ( 80 per cent) of fossil groups with a halo mass less than h-1 fill their large magnitude gaps (e.g., due to the infall of luminous galaxies within , where we calculate the magnitude gap). However, about 40 per cent of fossil clusters with h-1 retain their large magnitude gap. In addition, the mean gap value for the control groups increases with decreasing redshift. For random groups, the mean gap value remains flat with redshift. The mean gap value of all group types in SI becomes similar below 0.3, but for SII and SIII the mean gap values become similar more recently, 0.
In Fig. 4, we show the magnitude gap distributions at for the traced groups since . We also find that 15 per cent of control groups, which tracing from , become fossil groups at .
4 Evolution of the halo mass
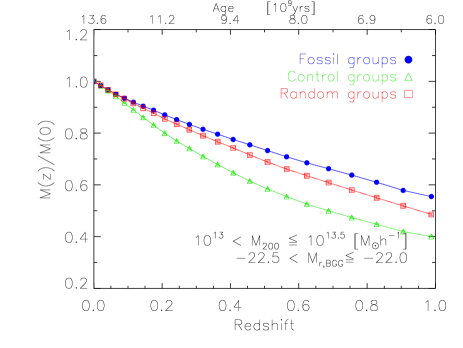
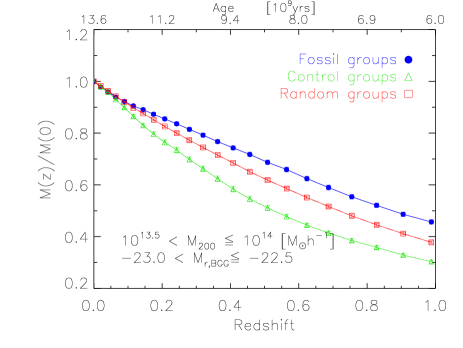
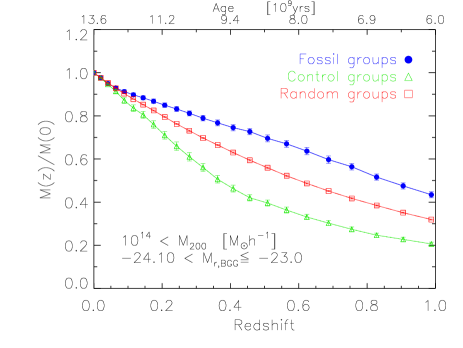
Previous studies argued that fossil groups are early formed, relatively old, and isolated systems (Dariush et al. 2007; D’Onghia et al. 2005). Similar to other studies e.g. Dariush et al. (2007, 2010), we investigate the halo formation history and mass assembly of galaxy groups in our sub-samples of galaxy groups using the G11 model. In Fig. 5, we trace backwards the mass build-up of dark matter halos as a function of redshift for fossil, control, and random groups from to .
The vertical axis in Fig. 5, represents a ratio of the mean mass of selected halos at each redshift to their final mass at z=0. The error bars are the standard error on the mean. A similar evolution is detected for the halo mass build-up of fossil groups within SI, SII, and SIII. Fossils have assembled 50 per cent of their current mean halo masses at z, while controls and random groups accumulate 30 per cent and 40 per cent, respectively. In agreement with early studies we find that fossils are early formed groups compared to control groups with similar halo masses and BGG luminosities. We also find that low-mass groups have assembled larger fraction of their masses at compared to the high-mass groups. For example, fossils within SI, SII, and SIII are accumulated 57, 46, and 41 per cent of their final halo mass at , respectively. Fig. 5 also shows that the mean halo mass of selected fossil, control, and random groups evolve with different trends at . Similar trends are observed if halos are traced forwards from to .
5 Luminosity Function
5.1 Composite luminosity function
Luminosity function (LF) of galaxies is used as a key function to advance our understanding of galaxy properties in different environments (Bahcall 1979; Binggeli et al. 1988; Blanton et al. 2001; Yang et al. 2003; Benson et al. 2003; Lin et al. 1996; Milosavljević et al. 2006; Tinker & Conroy 2009; van den Bosch et al. 2007; Popesso et al. 2005). As such, the observed LFs are regarded as fundamental observational quantities and they must be reproduced by a successful theoretical model of galaxy formation and evolution. A number of studies have detected substantial differences between the LF of galaxies in the field, group, and cluster environments that can arise from differing of the galaxy formation, because of the differences in the galaxy environments, or that can be related to effects on the LF by dynamical physical processes (i.e. mergers, effects of tidal and ram-pressure forces) that occur during or after the collapse of galaxy groups/clusters (e.g., Miles et al. 2006). Several earlier studies attempted to show similarities between LFs in different environments, suggesting the LF as universal function (e.g., Oemler 1974; Gaidos 1997; Colless 1989; De Propris et al. 2003). In contrast, a number of studies disagree with the universal shape of LF (e.g., Godwin & Peach 1977; Piranomonte et al. 2001; Hansen et al. 2005; Giodini et al. 2012).

The luminosity evolution of the bright end and slope of the faint end of the galaxy LF in the field and clusters has been well understood (Bowler et al. 2014; Lilly et al. 1995; Norberg et al. 2002; Willmer et al. 2006; Ellis et al. 1996; Alshino et al. 2010). However, because of a lack of data for fossil groups, the nature of such evolution in fossils has remained an open question.
Using numerical simulation of the merging of a compact group, Barnes (1989), concluded that an elliptical galaxy can be formed by merging galaxies in a few tenths of a Hubble time. Later, Ponman & Bertram (1993) and Ponman et al. (1994) studied HCG 62 and RX , finding that compact groups of galaxies form as a result of the orbital decay of galaxies into an extended dark matter halo. Finally, massive galaxies in these systems merge with the central group galaxy as a result of dynamical friction, forming a system known as a fossil group. Such a fossil group includes a giant elliptical galaxy with an extended hot gas halo that displays a large difference in magnitude relative to the second brightest satellite galaxy within .
If fossil groups are indeed early-formed systems, it is feasible to address this by studying the redshift evolution of the two particular components of galaxy LF, bright, and faint ends, with the help of SAMs. To this end, we select our galaxy group samples at z=0 according to the definition given in §2.2. Then, we trace backwards all halos and measure the composite LF of galaxies in groups/clusters for each sub-sample in 22 different redshift slices from to , down to an absolute r-band magnitude of -15 mag. The composite LF is measured from a combination of the LF of traced galaxy groups, according to the method introduced in detail by Colless (1989). The number of galaxies within each luminosity or magnitude bin is measured using the following equation (1):
| (1) |
where is number of galaxies within the j-th bin of the composite LF, is the count in the -th bin of the -th group LF, is the normalisation of the -th group LF (assumed here the number of galaxies brighter than within given radius), is the number of groups counterpart to the -th bin, and
| (2) |
The error for each bin of the composite LF is calculated according to the following relation:
| (3) |
where and and are formal errors corresponding to the -th bin of the luminosity function of the -th galaxy groups and composite groups, respectively.
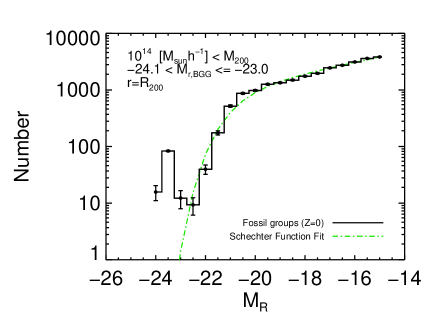
In order to study the environmental dependence of the composite LF, we compute the LF of each group within three radii from the BGG: , and. To quantify the redshift evolution of the composite LF of galaxies in fossil, control, and random groups, we fit a single Schechter function (Schechter 1976):
| (4) |
where and is proportional to the number of galaxies that have absolute magnitudes in the range (M, M+dM). The parameter is the characteristic number of galaxies and is the characteristic absolute magnitude. The Schechter function drops sharply at bright magnitudes and rises at the faint end following a power law with a slope given by .
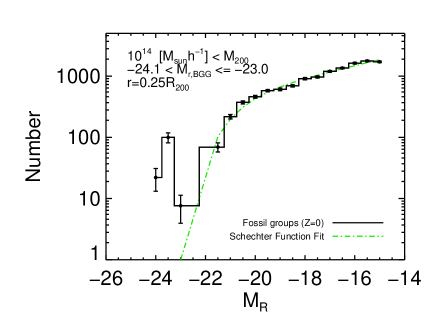
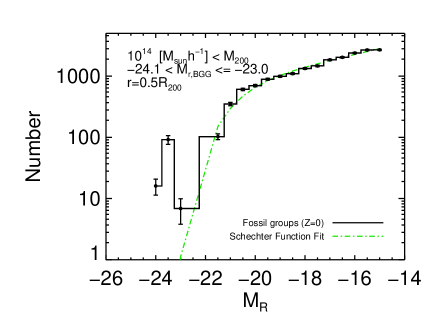
The large magnitude gap in the LF of fossil groups, affects the goodness of the fit. To overcome this effect, we exclude the BGGs/BCGs from the Schechter function fit to the composite LF.
Fig. 6 shows the Schechter function fit (green dashed curve) to the composite LF of galaxies (black histogram with error bars) in fossil groups/clusters within (top panel), (middle panel), and (bottom panel) for SIII at . As discussed in §2.2, applying limits on BGG/BCG luminosities in defining group/cluster sub-samples, allows us to detect the large magnitude gap in the bright end of the composite LF of galaxies in fossil groups (see Fig. 6). In Fig.7, we show the 1- and error contours of the fit on the composite LF fossils at .
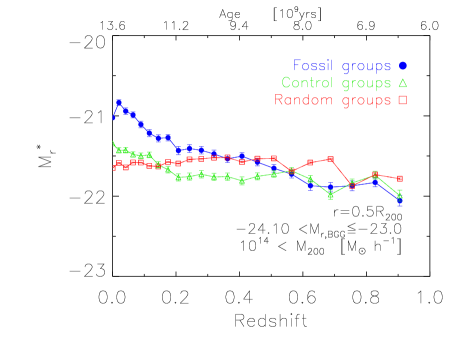
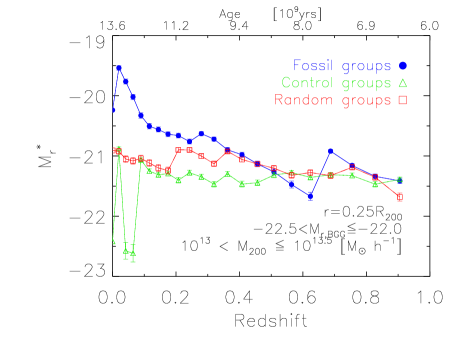
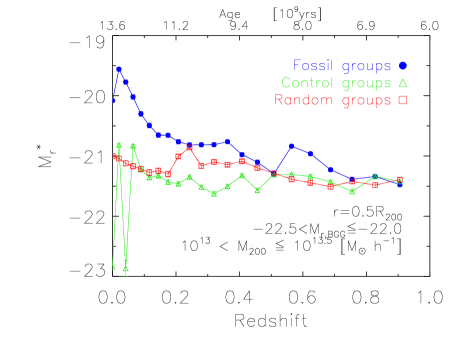
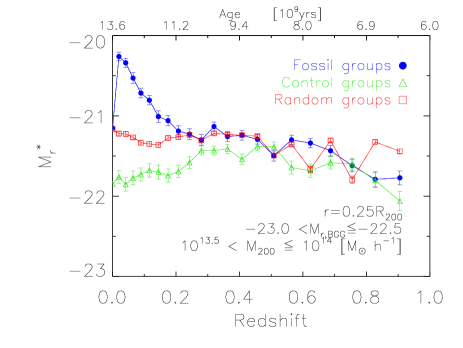
5.2 Evolution of the luminosity of the bright end of LF,
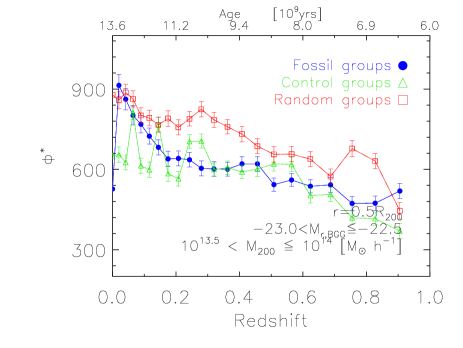
In Fig. 8, we plot the versus redshift for fossils (filled blue circle) , controls (green open triangle), and random groups (red open square) for SI. The luminosity of the bright end of the composite LF of galaxies in fossil groups, selected within radius from BGG evolves substantially, changing by mag, while LF of random groups shows no considerable evolution with redshift. The bright end of the composite LF of the control groups shows no evolution between z and . However, it appears that at , of these groups is skewed to lower magnitudes, which is probably caused by the infall of luminous galaxies within .
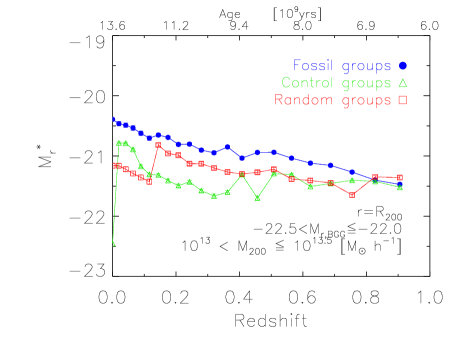
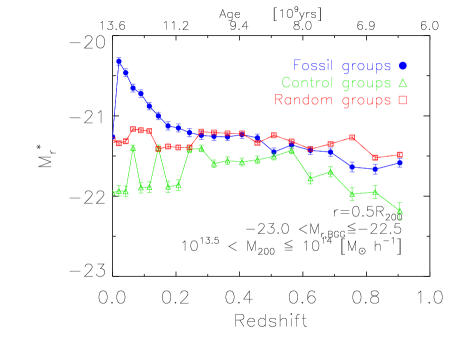
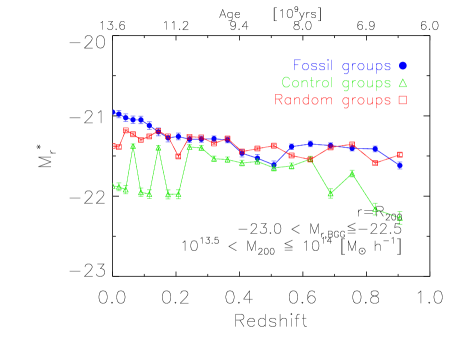
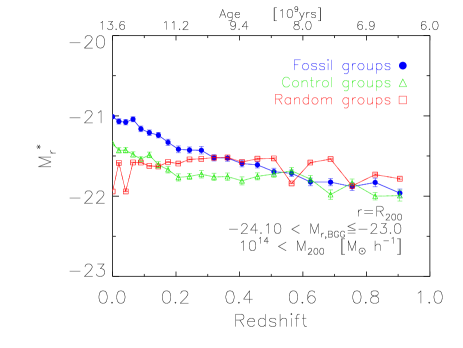
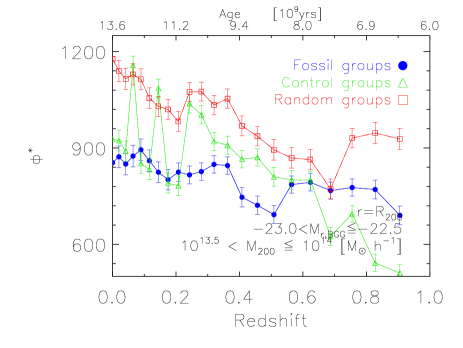
As shown in the middle panel of Fig. 8, we find evolution of for the composite LF of galaxies selected within for different types of groups for SI are similar to that of the composite LF within . We notice that by increasing the group radius to , of fossils increases between and present day by mag (see lower panel in Fig. 8). As a result, the of the composite luminosity function of galaxies in fossil groups within at is consistent with that () of our study of the composite luminosity function of four fossil group candidates (Khosroshahi et al. 2014). No significant redshift evolution of is seen for the random groups and control groups.
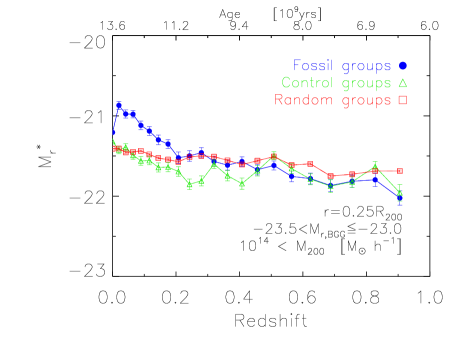
Our conclusions derived for SI sub-sample also apply to SII and SIII (see Fig.9 and Fig.10). For both SII and SIII sub-samples, the of composite LF of galaxies within and radii of fossil groups shows an evolution with redshift by mag, which is different from evolution of LF for the random and control groups. We notice a substantial change in of composite LF of fossil groups takes place around the central region of these systems at z in the last . Furthermore, the slope of relation of fossil groups decreases with increasing halo mass.
In this study, we have selected our groups by considering the r-band absolute magnitude of BGGs, magnitude gap- and halo mass of groups/clusters. These considerations do not allow us to compare our findings with previous results from other literature. Nevertheless, our prediction of the evolution is approximately consistent with that of the -band composite LF of galaxies in C1 clusters presented in Table 4 in Alshino et al. (2010). We perform a comprehensive comparison of the evolution of the galaxy composite LF in groups/clusters from the SAM with that of observations using the X-ray galaxy groups catalogue in Gozaliasl et al. (in prep.).
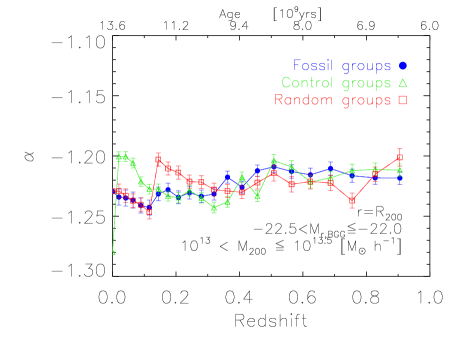
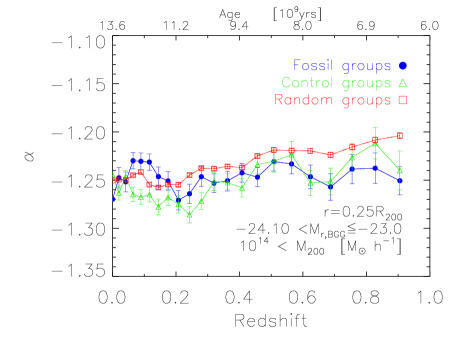
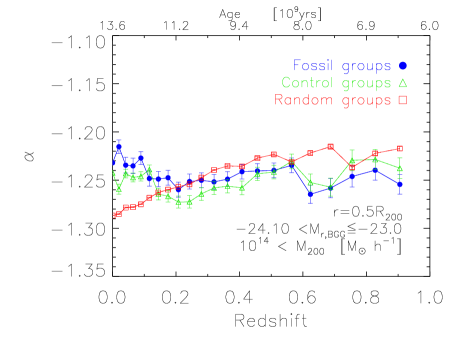
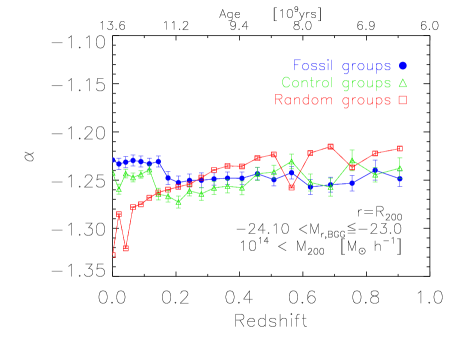
5.3 Evolution of the faint end slope of LF,
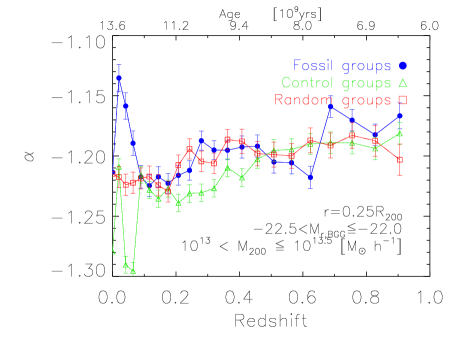
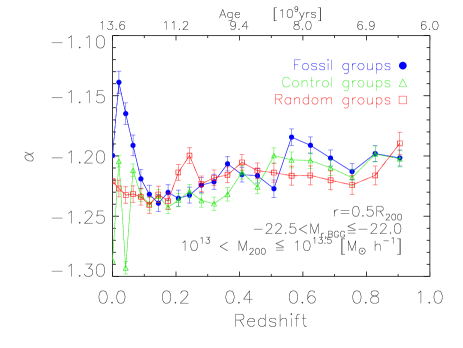
In Fig. 11, we show the redshift evolution of the faint end slope, , of the composite LF of galaxies corresponding to (top panel), (middle panel), and (bottom panel) for SI. The faint end slope of composite LF of galaxies within for fossil, control, and random groups show little evolution with redshift between z and z. At z the slope starts evolving steeply with redshift from to for the fossils. It appears that the faint end of composite LF of control groups evolves from to . The of the composite LF of random groups shows no evolution in this redshift range. A similar evolution of is also detected for the composite LF of galaxies within (middle panel of Fig. 11). The faint end slope of the composite LF of galaxies in all three types of groups within shows no evolution with redshift. In addition, the predicted of the composite luminosity function of fossil groups within at agrees within observational uncertainties with that () of our study of the composite luminosity function of four fossil group candidates (Khosroshahi et al. 2014).
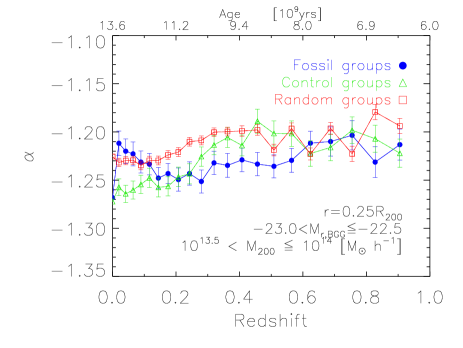
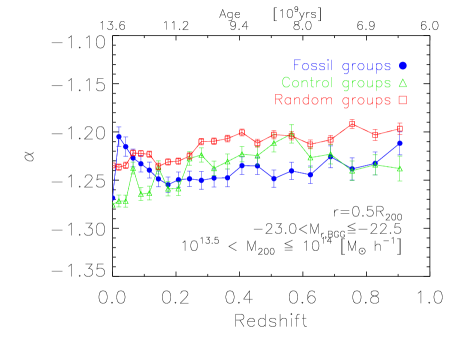
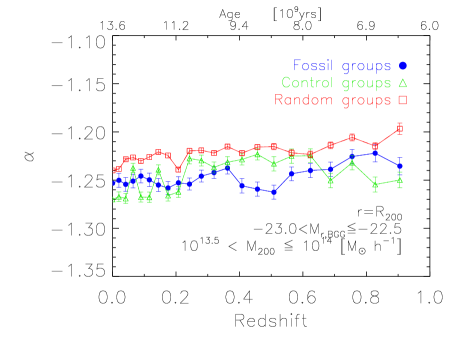
In Fig. 12, we illustrate as a function of time and redshift for SII. All three panels indicate has approximately similar constant behaviour with redshift. The of composite LF of fossil groups (for SI and SII) at shows an evolution at by . This evolution of indicates that the number of the dwarf galaxies within central regions of fossil groups at reduces with time, which can be a consequence of the merger ratio within these systems.
Fig. 13 presents a redshift evolution of the slope of the faint end of the composite LF for SIII. We observe no significant redshift evolution of (0.05) for all types of selected groups within , , and .
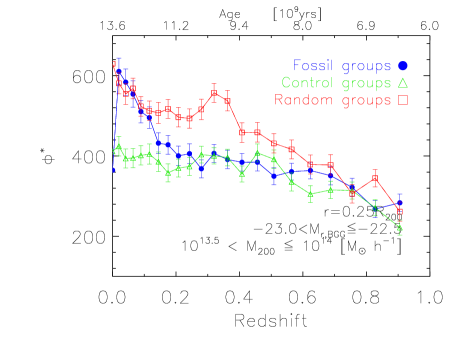
5.4 Evolution of and dwarf galaxies
In Fig. 14, we show of the composite LFs of galaxy groups versus redshift for SII. The of the composite LFs of groups in SI and SIII are similar to that of SII. Each panel corresponds to the evolution of the composite LFs of groups within (upper panel), (middle panel), and (lower panel). The of the composite LFs of random and control groups show similar trends that increase with redshift in all panels. For fossil groups, we detect a trend for of the composite LF within (lower panel). We detect that of the composite LFs of fossil groups within and also evolve similar to that of control groups between to . However, the of the composite LF of fossil groups rises rapidly from z to present day, indicating recent changes in the number of galaxies in these systems.
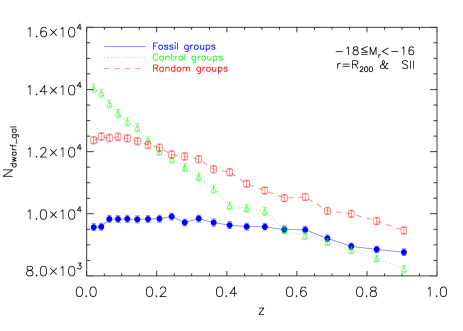
In order to find out what caused the changes in , we investigate whether the number of dwarf galaxies (, hereafter) in our sample of groups evolves with redshift. We select galaxies in the r-band magnitude range . In Fig. 15, we plot of fossil (filled blue circles), control (open green triangles), and random (open red squares) groups within versus redshift for SII (we find similar trends for the of groups in SI and SIII). The of fossil groups grows by between and , after which remains constant with redshift. We also notice a % drop in in fossil groups below . This evolution is consistent with the recent evolution of in composite LFs of fossils within at (see the upper and middle panels of Figs. 11 and 12).
The of random groups grows by since to present day. We detect of control groups to evolve similar to that of the fossils between to . In contrast to fossil groups, of control groups steeply rises with redshift by below . The constant behavior of the number of dwarf galaxies in the fossil groups indicates that changes in are caused by changes in (see Figs. 8 to 10) and not in the number of galaxies. These findings strongly suggest that the BGG in fossil group forms because of the multiple mergers with massive galaxies, and that the large magnitude gap of fossil groups is the effect of galaxy merger/cannibalism.
6 Summary and conclusions
In this paper, we investigate the redshift evolution of the composite LF of galaxies within the mass-selected sub-samples of fossil groups, control groups with , and groups with any . We select our sub-samples at z=0 in the SAM of Guo et al. (2011) and trace the halos backwards in redshift up to z. For 22 snapshots (redshifts), we calculate the mean luminosity gap, and an average ratio of the halo mass of groups to their final masses (at z=0). We also measure a composite LF of galaxies within three radii, , , and . We also trace forwards in time the magnitude gap of groups from z=1 to present day. Our main results are as follows:
(I) Similar to other studies, we show that fossil groups in the G11 model have accumulated their halo mass earlier than non-fossil groups. We also detect that at redshift one the low-mass fossil systems (SI) had on average 15 per cent more mass compared to massive fossil clusters (SIII).
(II) By tracing halos from to , we show that the large magnitude gaps of fossil groups for all halo mass ranges have been formed between the present day and z (e.g. last Gyrs). By forward tracing from to we find that 80 per cent of fossil groups with M☉h-1 fill their large gap possibly due to the infall of bright galaxies within , in agreement with findings of von Benda-Beckmann et al. (2008). In addition, we detect 40 per cent of fossil clusters with a halo mass above M☉h-1 retain their large magnitude gaps since .
(III) We calculate composite LFs of galaxies in traced galaxy groups at 22 redshift slices and fit a single Schechter function. The bright end characteristic absolute magnitude, , of the composite LF for fossils shows a significant redshift evolution by mag between z and present day. This evolution for composite LFs of fossils within and is comparable with the composite LFs calculated inside . In contrast, the of the composite LFs for control and random groups, corresponding to different radii, show no considerable evolution with redshift.
We observe that the slope of the faint end, , of the composite LF within and for fossils with M☉h-1 evolves with redshift by at . This evolution of in fossil groups can be explained by a recent devouring of dwarf galaxies by a central giant galaxy in fossils. The corresponding to the composite LFs within for both fossil and non-fossil groups, show no significant evolution with redshift.
We have investigated the evolution of of composite LFs and find that the of composite LFs of fossil groups within and steeply evolves towards larger values at redshifts below z. This evolution for the composite LF of fossils within is slow. Similar to fossil groups, the of composite LF of control and random groups significantly increases with redshift.
(IV) We find that the number of dwarf galaxies in fossil groups has no evolution with redshift since z=1 to present day,while a significant evolution is observed for control and random groups, by and , respectively. The constant behavior of a number of dwarf galaxies in fossil groups indicates that the changes in in these systems are caused by the changes in and not in the number of galaxies.
(V) In contrast to the fossil and to the control groups, we detect that the magnitude gap and the composite LF of random groups show no considerable evolution with redshift, indicating the importance of the magnitude gap as an optical tool in the study of galaxy groups.
Our findings on the time evolution of the Schechter parameters, suggest that the central elliptical galaxies in local fossil groups have been formed by multiple massive galaxy mergers since z0.5. Because the timescale for the merging of faint galaxies is larger than the timescale for merging of massive galaxies in groups, the effect of this merger scenario is more pronounced in the bright end of galaxy luminosity functions of fossil groups than in the faint end.
7 Acknowledgements
We thank Saeed Tavasoli, Ali Koohpaee, Amin Farhang, Ehsan Kourkchi, Anoushiravan Roozrokh, and Mojtaba Raouf for helpful assistance. We used the Millennium Simulation databases in this paper and the web application providing online access to them were constructed as part of the activities of the German Astrophysical Virtual Observatory. This work also has been partially supported by the grant of Finnish Academy of Sciences to the University of Helsinki, decision number 266918.
References
- Aguerri et al. (2011) Aguerri, J. A. L., Girardi, M., Boschin, W., et al. 2011, A&A, 527, A143
- Alshino et al. (2010) Alshino, A., Khosroshahi, H., Ponman, T., et al. 2010, MNRAS, 401, 941
- Bahcall (1979) Bahcall, N. A. 1979, ApJ, 232, 689
- Blanton et al. (2001) Blanton, M. R., Dalcanton, J., Eisenstein, D., et al. 2001, AJ, 121, 2358
- Barnes (1989) Barnes J. E., 1989, Nat, 338, 123
- Benson et al. (2003) Benson, A. J., Bower, R. G., Frenk, C. S., et al. 2003, ApJ, 599, 38
- Binggeli et al. (1988) Binggeli, B., Sandage, A., & Tammann, G. A. 1988, ARA&A, 26, 509
- Bowler et al. (2014) Bowler, R. A. A., Dunlop, J. S., McLure, R. J., et al. 2014, MNRAS, 440, 2810
- Bruzual & Charlot (2003) Bruzual, G., & Charlot, S. 2003, MNRAS, 344, 1000
- Chabrier (2003) Chabrier G. 2003, ApJ, 586, L133
- Colless (1989) Colless, M. 1989, MNRAS, 237, 799
- Colless et al. (2001) Colless, M., et al. 2001, MNRAS, 328, 1039
- Cooray (2006) Cooray, A. 2006, MNRAS, 365, 842
- Croton et al. (2006) Croton, D.J., Springel, V., White, S.D.M.,et al. 2006, MNRAS, 365, 11
- Cypriano et al. (2006) Cypriano E.S., Mendes de Oliveira C.L., Sodré L. Jr. 2006, AJ, 132, 514
- Dariush et al. (2007) Dariush A. A., Khosroshahi H. G., Ponman T. J., Pearce F., Raychaudhury S., Hartly W. 2007, MNRAS, 382, 433
- Dariush et al. (2010) Dariush A. A., Raychaudhury S., Ponman T. J., Khosroshahi H. G., Benson A. J., Bower R. G., Pearce F. 2010, MNRAS, 405, 1873
- Davis et al. (1985) Davis, M., Efstathiou, G., Frenk, C. S., White, S. D. M. 1985, ApJ, 292, 371
- De Lucia et al. (2006) De Lucia, G., Springel, V., White, S. D. M., Croton, D., Kauffmann, G. 2006, MNRAS, 366, 499D
- De Lucia & Blaizot (2007) De Lucia, G., Blaizot, J. 2007, MNRAS , 375, 2
- De Propris et al. (2003) De Propris, R., Colless, M., Driver, S.P., Couch, W., Peacock, J.A. et al. 2003, MNRAS, 342, 725
- D’Onghia et al. (2005) D’Onghia E., Sommer-Larsen J., Romeo A.D., Burkert A., Pedersen K., Portinari L., Rasmussen J. 2005, ApJ, 630, L109
- Eigenthaler & Zeilinger (2013) Eigenthaler, P., & Zeilinger, W. W. 2013, A&A, 553, A99
- Ellis et al. (1996) Ellis, R. S., Colless, M., Broadhurst, T., Heyl, J., & Glazebrook, K. 1996, MNRAS, 280, 235
- Gaidos (1997) Gaidos, E.J., 1997, AJ, 113, 117
- Giodini et al. (2012) Giodini, S., Finoguenov, A., Pierini, D., et al. 2012, A&A, 538, A104
- Girardi et al. (2014) Girardi, M., Aguerri, J. A. L., De Grandi, S., et al. 2014, A&A, 565, A115
- Godwin & Peach (1977) Godwin, J. G., & Peach, J. V. 1977, MNRAS, 181, 323
- Gozaliasl et al. (2014) Gozaliasl, G., Finoguenov, A., Khosroshahi, H. G., et al. 2014, A&A, 566, A140
- Guo et al. (2011) Guo, Q., White, S., Boylan-Kolchin et al. 2011, MNRAS, 413, 101
- Guo et al. (2013) Guo, Q., White, S., Angulo, R. E., et al. 2013, MNRAS, 428, 1351
- Hansen et al. (2005) Hansen, S.M., McKay, T.A., Wechsler, R.H., Annis, J., Sheldon, E.S., Kimball, A., 2005, ApJ, 633, 122
- Jones et al. (2003) Jones L.R., Ponman T.J., Horton A., Babul A., Ebeling H., Burke D.J. 2003, MNRAS, 343, 627
- Khosroshahi et al. (2014) Khosroshahi, H. G., Gozaliasl, G., Rasmussen, J., et al. 2014, MNRAS, 443, 318
- Khoroshahi, Jones & Ponman (2004) Khosroshahi H.G., Jones L.R., Ponman T.J. 2004, MNRAS, 349, 1240
- Khoroshahi, et al (2006) Khosroshahi H.G., Maughan B.J., Ponman T.J., Jones L.R. 2006, MNRAS,
- Khosroshahi, Ponman & Jones (2006) Khosroshahi H. G., Ponman T. J., and Jones L. R., 2006, MNRAS Letters, 372, 68
- Khosroshahi et al. (2007) Khosroshahi H.G., Ponman, T.J., Jones L.R. 2007, MNRAS, 377, 595
- La Barbera et al. (2009) La Barbera F., de Carvalho R.R., de la Rosa I.G., Sorrentino G., Gal R.R., Kohl-Moreira J.L. 2009, AJ, 137, 3942
- Lilly et al. (1995) Lilly, S. J., Tresse, L., Hammer, F., Crampton, D., & Le Fevre, O. 1995, ApJ, 455, 108
- Lin et al. (1996) Lin, H., Kirshner, R. P., Shectman, S. A., et al. 1996, ApJ, 464, 60
- Miles et al. (2006) Miles, T.A., Raychaudhury, S., Russell, P.A., 2006, MNRAS, 373, 1461
- Milosavljević et al. (2006) Milosavljević M., Miller C. J., Furlanetto S. R., Cooray A. 2006, ApJ, 637, L9
- Miller et al. (2012) Miller, E. D., Rykoff, E. S., Dupke, R. A., et al. 2012, ApJ, 747, 94
- Miraghaei et al. (2014) Miraghaei, H., Khosroshahi, H. G., Klöckner, H.-R., et al. 2014, arXiv:1407.0759
- Mulchaey & Zabludoff (1999) Mulchaey, J. S., & Zabludoff, A. I. 1999, ApJ, 514, 133
- Norberg et al. (2002) Norberg, P., Cole, S., Baugh, C. M., et al. 2002, MNRAS, 336, 907
- Oemler (1974) Oelmer, A.Jr. 1974, ApJ, 194, 1
- Piranomonte et al. (2001) Piranomonte, S., Longo, G., Andreon, S., Puddu, E., Paolillo, M., Scaramella, R., Gal, R., Djorgovski, S.G., 2001, ASPC, 225, 73
- Planck Colabration XVI (2013) Planck Colabration, XVI 2013,arXiv:1303.5076
- Ponman & Bertram (1993) Ponman, T. J., & Bertram, D. 1993, Nature, 363, 51
- Ponman et al. (1994) Ponman T. J., Allan D. J., Jones L. R., Merrifield M., MacHardy I. M. 1994, Nature, 369, 462
- Proctor et al. (2011) Proctor, R. N., de Oliveira, C. M., Dupke, R., et al. 2011, MNRAS, 418, 2054
- Popesso et al. (2005) Popesso, P., Biviano, A., Bhringer, H., Romaniello, M., Voges, W. 2005, A&A, 433, 431
- Schechter (1976) Schechter, P. 1976, ApJ 203, 297
- Spergel et al. (2003) Spergel, D. N., Verde, L., Peiris, H. V., Komatsu, E., et al. 2003, ApJS, 148, 175
- Springel et al. (2005) Springel, V. et al. 2005, Natur, 435, 629
- Springel et al. (2001) Springel, V., Yoshida, N. & White, S. D. M. 2001, NewA, 6, 79S
- Tavasoli et al. (2013) Tavasoli, S., Vasei, K., & Mohayaee, R. 2013, A&A, 553, A15
- Tinker & Conroy (2009) Tinker, J. L., & Conroy, C. 2009, ApJ, 691, 633
- Vikhlinin et al. (1999) Vikhlinin A., McNamara B.R., Hornstrup A., Quintana H., Forman W., Jones C., Way M. 1999, ApJ, 520, L1
- Voevodkin et al. (2010) Voevodkin A., Borozdin K., Heitmann K., Habib S., Vikhlinin A., Mescheryakov A., Hornstrup A., Burenin R. 2010, ApJ, 708, 1376
- von Benda-Beckmann et al. (2008) von Benda-Beckmann A.M., D’Onghia E., Gottlöber S., Hoeft M., Khalatyan A., Klypin A., Müller V. 2008, MNRAS, 386, 2345
- van den Bosch et al. (2007) van den Bosch F. C., et al. 2007, MNRAS, 376, 841
- Somerville et al. (2001) Somerville, R. S., Primack, J. R., & Faber, S. M. 2001, MNRAS, 320, 504
- White & Frenk (1991) White, S. D. M. & Frenk, C. S. 1991, ApJ, 379, 52
- Willmer et al. (2006) Willmer, C. N. A., Faber, S. M., Koo, D. C., et al. 2006, ApJ, 647, 853
- Yang et al. (2008) Yang, X., Mo, H., van den Bosch, F. 2008, ApJ, 676, 248
- Yang et al. (2003) Yang, X., Mo, H. J., & van den Bosch, F. C. 2003, MNRAS, 339, 1057
- Zarattini et al. (2014) Zarattini, S., Barrena, R., Girardi, M., et al. 2014, A&A, 565, A116