Galaxy Zoo: CANDELS Barred Disks and Bar Fractions††thanks: This publication has been made possible by the participation of more than 200,000 volunteers in the Galaxy Zoo project. Their contributions are individually acknowledged at http://authors.galaxyzoo.org/ .
Abstract
The formation of bars in disk galaxies is a tracer of the dynamical maturity of the population. Previous studies have found that the incidence of bars in disks decreases from the local Universe to , and by simulations predict that bar features in dynamically mature disks should be extremely rare. Here we report the discovery of strong barred structures in massive disk galaxies at in deep rest-frame optical images from CANDELS. From within a sample of 876 disk galaxies identified by visual classification in Galaxy Zoo, we identify 123 barred galaxies. Selecting a sub-sample within the same region of the evolving galaxy luminosity function (brighter than ), we find that the bar fraction across the redshift range ( after correcting for incompleteness) does not significantly evolve. We discuss the implications of this discovery in the context of existing simulations and our current understanding of the way disk galaxies have evolved over the last 11 billion years.
keywords:
galaxies: general — galaxies: evolution — galaxies: spiral — galaxies: structure1 Introduction
Large-scale galactic stellar bars are thought to form within dynamically cold, rotationally supported disks (Athanassoula, 2005; Combes, 2009; Athanassoula et al., 2013; Sellwood, 2013). Thus, the evolution of the fraction of disk galaxies with bar features traces the overall evolution of disk galaxy dynamics. Locally, bars are present in of disk galaxies (where bars are classified either visually, from Fourier analysis, or from examining elliptical isophotes; e.g. Odewahn, 1996; Elmegreen et al., 2004a; Aguerri et al., 2009; Nair & Abraham, 2010; Masters et al., 2011; Cheung et al., 2013), with their abundance steadily decreasing to 10% of disk galaxies at (Abraham et al., 1999; Elmegreen et al., 2004a; Elmegreen & Elmegreen, 2005; Sheth et al., 2008; Melvin et al., 2014).
The lower incidence of bars at higher redshifts may be in part be due to the increased incidence of mergers and galaxy interactions (Conselice et al., 2003; Lotz et al., 2011; Casteels et al., 2013), which disrupt and heat disks, destroying or preventing the formation of bars. More generally, disk galaxies at tend to be less dynamically “settled” than their more local counterparts, with a lower rotation velocity compared to velocity dispersion as redshift increases (Förster Schreiber et al., 2011; Kassin et al., 2012). The redshift dependence of bar fractions may also be related to the expected increase in disk gas fraction with redshift; this has been observed directly via the increased from CO observations (e.g., Tacconi et al. 2010, 2013; for a detailed review, see Carilli & Walter 2013). The presence of a bar in a galaxy is anti-correlated with specific star formation rate (Cheung et al., 2013) and disk gas fraction (Masters et al., 2012), in agreement with theoretical predictions (Friedli & Benz, 1993; Berentzen et al., 2007; Villa-Vargas et al., 2010; Athanassoula et al., 2013), although a high gas fraction does not entirely preclude the existence of a bar (Nair & Abraham, 2010; Masters et al., 2012).
The current theoretical understanding of bar fraction evolution suggests that disk galaxies at may be too dynamically hot to form bars: Kraljic, Bournaud, & Martig (2012) find no observable bars within a simulated sample of galaxies at . However, other simulations explore the impact of tidal heating and galaxy harassment, which can either inhibit bar formation or promote it, depending on mass (Noguchi, 1988; Moore et al., 1996; Skibba et al., 2012). Testing the viability of the proposed mechanisms responsible for the redshift dependence of bar fractions requires high-resolution imaging over a large area of the sky to observe statistically significant samples in multiple redshift bins and adequate spatial resolution to resolve galactic-scale bars in the rest-frame optical (since the detectability of bars decreases rapidly blueward of the 4000 Å break; Sheth et al., 2008).
These observing requirements currently limit studies of disk populations via bar fractions to surveys with the Hubble Space Telescope (HST). Previous studies have used the optical cameras on HST to examine bar fractions to . In this paper, we present the first results from Galaxy Zoo morphological classifications of galaxies imaged by the Cosmic Assembly Near-Infrared Deep Extragalactic Legacy Survey (CANDELS; Grogin et al., 2011; Koekemoer et al., 2011), which uses HST’s near-infrared Wide-Field Camera 3 (WFC3) and which allows us to probe the bar fractions of galaxies with out to .
In Section 2 we describe our sample selection, including a summary of Galaxy Zoo classifications of CANDELS galaxies and how disks and bars are selected. We also explore any potential biases that may affect our results. We present our results in Section 3, with a discussion including comparison to simulated predictions in Section 4, and a summary in Section 5. Throughout this paper we use the AB magnitude system, and where necessary we adopt a cosmology consistent with CDM, with Mpc-1, and (Bennett et al., 2013).
2 Data
2.1 CANDELS
The Cosmic Assembly Near-infrared Extragalactic Legacy Survey (CANDELS; Grogin et al., 2011; Koekemoer et al., 2011) is an HST Treasury program combining optical and near-infrared imaging from the Advanced Camera for Surveys (ACS) and Wide Field Camera 3 (infrared channel; WFC3/IR) across five well-studied survey fields (GOODS-North and -South, Giavalisco et al. 2004; EGS, Davis et al. 2007; UDS, Lawrence et al. 2007, Cirasuolo et al. 2007; and COSMOS, Scoville et al. 2007) using a two-tiered “deep” and “wide” approach. Each of the wide fields (UDS, COSMOS, EGS and flanking fields to the GOODS-S and GOODS-N deep fields) are imaged over 2 orbits in WFC3/IR, split in a 2:1 ratio between filters F160W and F125W, respectively, with parallel exposures in F606W and F814W using ACS. Each of the deep fields (GOODS-S and GOODS-N) are imaged over at least 4 orbits each in both the F160W and F125W filters and 3 orbits in the F105W filter, with ACS exposures in F606W and F814W in parallel. These are reduced and combined to produce a single mosaic for each field in each band, with drizzled resolutions of and per pixel for ACS and WFC3/IR, respectively (a process described in detail by Koekemoer et al., 2011).
Here we use the CANDELS ACS and WFC3/IR images from within the COSMOS, GOODS-South, and UDS fields for which raw classifications from the Galaxy Zoo project are presently available. The WFC3/IR observations of these fields cover approximately 0.15 square degrees combined. The Galaxy Zoo classifications are based on colour images created using the Lupton et al. (2004) asinh stretch method with resolution-matched WFC3 F160W, F125W, and ACS F814W as red, green and blue channels respectively. Some of the colour images use ACS data that was observed during previous surveys (Giavalisco et al., 2004; Scoville et al., 2007; Koekemoer et al., 2007; Davis et al., 2007) and re-analysed by the CANDELS pipeline.
2.2 Classifications
Galaxy Zoo provides quantified visual morphologies by obtaining multiple independent classifications for each galaxy. Beginning in 2007, more than 1,000,000 galaxy images in total from the Sloan Digital Sky Survey and the HST have each been classified by typically independent volunteers via a web interface222zoo4.galaxyzoo.org. The initial version of the project (Lintott et al., 2008, 2011) asked a single question per galaxy (whether the galaxy was spiral or elliptical). Subsequent versions have collected more detailed morphological information, including finer sub-structures of disk galaxies such as bulge strength and bars, via a tiered classification tree (e.g., Willett et al., 2013; Melvin et al., 2014). All previous Galaxy Zoo projects have incorporated extensive analysis of volunteer classifications to measure classification accuracy and bias and compute user weightings (for a detailed description of debiasing and consistency-based user weighting, see Section 3 of Willett et al., 2013). The classifications are highly accurate and the high number of independent classifications per galaxy has enabled a diverse range of investigations in the overall field of galaxy evolution (e.g., Darg et al., 2010a, b; Masters et al., 2011; Skibba et al., 2012; Casteels et al., 2013).
This work uses classifications collected during the fourth release of Galaxy Zoo, specifically of 49,555 images from the COSMOS, GOODS-South, and UDS fields in the CANDELS survey (hereafter GZ-CANDELS). The dataset was initially composed of all sources having () apparent magnitude . This limit is considerably brighter than the expected extended-source detection limits reported in Grogin et al. (2011). Within this sample, 58% of sources have , and 31% of sources have . (We note that this brighter sub-sample includes 95% of galaxies later selected as “featured” galaxies; Section 2.4).
Several months after the launch of GZ-CANDELS, an initial analysis motivated by community333talk.galaxyzoo.org tags of sources considered too faint to classify resulted in the application of systematic cuts in magnitude-surface-brightness space and the early retirement of 1,555 point-like sources and 11,837 faint, low-surface brightness galaxies without resolvable fine features. Although the project is still ongoing, as of the date of this analysis each of the remaining objects has received at least 40 independent classifications (mean number 43; maximum 81). For each source classified by volunteers in GZ-CANDELS, all independent classifications are combined to produce “vote percentages”, where a vote percentage for a given answer to a given question in the classification tree is the number of votes for that answer divided by the number of classifiers who answered the question.
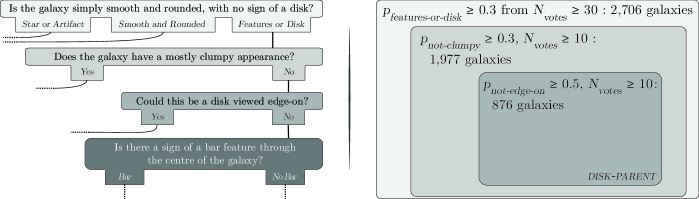
The classification tree used for GZ-CANDELS (B. Simmons et al., in preparation; see Figure 1 for the portion relevant here) first asks volunteers to choose whether a galaxy is mostly smooth, has features, or is a star/artifact. The bar classification question (“Is there a sign of a bar feature through the centre of the galaxy?”) is reached once a volunteer has chosen “Features or Disk” as an answer to the first question and has subsequently said the galaxy does not have a mostly clumpy appearance, nor is it an edge-on disk. The bar classification is therefore a fourth-tier task, and the number of volunteers per galaxy who answer the bar question varies depending on responses to the earlier tasks. We discuss the details of the disk and barred disk galaxy sample selections based on the tiered questions in the tree in Section 2.4.
We note that an independent effort is underway to collect at least 3 visual classifications per galaxy from CANDELS team members (classifications for one field have been published; Kartaltepe et al., 2014). These classifications use a different approach to the decision tree method used by Galaxy Zoo; we defer a full analysis between these classifications and Galaxy Zoo results to our upcoming data release paper.
2.3 Redshifts
Each of the fields covered by CANDELS data has considerable ancillary data from previous and ongoing work. In addition to newly-calculated photometric redshifts in CANDELS (based on a Bayesian approach combining results from multiple different analyses; Dahlen et al., 2013), we assemble additional photometric and spectroscopic redshifts from the available literature. For galaxies in the COSMOS field, we combine spectroscopic redshifts from the zCOSMOS project (Lilly et al., 2007) with photometric redshifts from COSMOS (Ilbert et al., 2009) and from the NEWFIRM medium-band survey (Whitaker et al., 2011). In the GOODS-South field, we use the catalog of Cardamone et al. (2010), who added photometric redshifts based on deep broad- and medium-band data from MuSYC (Gawiser et al., 2006) to available spectroscopic redshifts compiled from multiple sources (Balestra et al., 2010; Vanzella et al., 2008; Le Fèvre et al., 2004; Cimatti et al., 2002). In the UDS field, we use available spectroscopic (Simpson et al., 2012) and photometric redshifts (Hartley et al., 2013), the latter of which make use of deep multi-wavelength coverage from UKIDSS as well as and -band magnitudes from CANDELS. Of the 49,555 galaxies originally included in Galaxy Zoo: CANDELS, 46,234 currently have spectroscopic (2,886) or photometric (43,348) redshifts. Where available, agreement between spectroscopic and photometric redshift is generally very good, with and of sources having . The use of photometric redshifts introduces an uncertainty of less than into the population bar fractions discussed in Section 3. These uncertainties are discussed along with other possible sources of error in Section 2.5.
2.4 Sample Selection
A full reduction of the GZ-CANDELS classifications, resulting in a catalog of morphological measurements that incorporates weighted user votes and adjustments for biases in classifications due to cosmological dimming and resolution effects for each galaxy, is ongoing. Here we use the raw vote percentages, which have been neither weighted nor debiased. The effects of using raw versus the reduced classifications are twofold. First, the unweighted votes are likely biased in the first question toward an excess of votes for “Star or Artifact” (see Willett et al. 2013 for a discussion of how inconsistent votes are downweighted in Galaxy Zoo 2, which has a similar classification tree). Second, the effects of surface brightness dimming and loss of spatial resolution are not accounted for in the vote percentages, which is potentially a significant effect in a sample extending to in the rest-frame optical. We minimize the effect of surface brightness dimming via luminosity cuts described in Section 2.4.1, and address the lack of user weighting via threshold cuts in classification vote fractions, as described below.
To favour completeness in the final disk galaxy sample and to minimize the impact of the lack of user weighting, we employ a lower vote percentage threshold when selecting “featured” galaxies than is typical when using weighted data. We select as “featured” galaxies those where at least 30% of votes (out of at least 30 volunteers total) were registered for “Features or Disk”. This selects 2,706 featured galaxies. For comparison, a more typical threshold for weighted classifications is (e.g., Melvin et al., 2014). After the first question, the user weighting used by previous Galaxy Zoo data reductions (Lintott et al., 2008; Bamford et al., 2009; Willett et al., 2013) affects vote percentages by typically no more than a few percent. We therefore expect the lack of weighting to have little to no systematic effect on additional vote percentages.
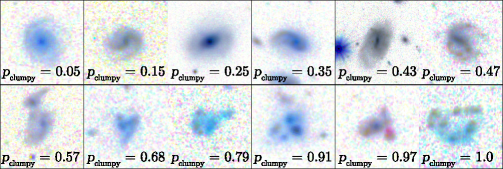
Subsequent to the featured galaxy selection, we select a sub-sample where at least 30% of volunteers (where a minimum of 10 answered the question) registered a vote for “no” to the question “Does the galaxy have a mostly clumpy appearance?” Figure 2 shows examples of galaxies along the full range of clumpy/not-clumpy vote percentages. We include the clumpy selection in order to explicitly consider each branch of the classification tree that leads to the bar-feature question, but the threshold is deliberately lower than previous studies (Melvin et al., 2014) to favour inclusiveness of clump-dominated disks that may be more prevalent at higher redshift (e.g., Elmegreen et al., 2004b; Elmegreen & Elmegreen, 2005; Elmegreen et al., 2007; Förster Schreiber et al., 2011) while removing galaxies with no apparent underlying disks or whose morphologies preclude evaluation of potential bar features. This selection removes 729 sources in total, leaving 1,977 galaxies. However, were we to ignore the clump-threshold criterion completely, this would only affect the final sample of disk galaxies at the 1% level, due to the subsequent inclination and luminosity selection criteria. Our qualitative results are thus not sensitive to the specific choice of clumpy threshold between .
We also require that 50% of volunteers (of at least 10) registered a vote for a disk galaxy that is “not-edge-on”. This is a deliberately conservative choice to reflect the fact that bars would be invisible in edge on systems (the thresholds used to select disk features are less strict to favour completeness).444The discussion in Section 3 assumes the bar fraction is the same in edge-on galaxies as face-on galaxies; an application of the results to include strongly clump-dominated galaxies requires a similar assumption. This selects a sample of 876 disk galaxies, within each of which a bar may be identified, if it exists. This parent sample of 876 not-edge-on disk galaxies is referred to hereafter as the disk-parent sample. As a sanity check on the selection of disks, we examine the Sérsic (1968) indices of the disk-parent sample using the parametric fits of van der Wel et al. (2012). We find that the distribution of Sérsic indices is peaked at , with , fully consistent with a disk-dominated sample (e.g., Häussler et al., 2007; Simmons & Urry, 2008).
Figure 1 shows a visual representation of this sample selection, from which a further sub-sample of barred galaxies may be identified. However, approximately 20% of these 876 galaxies received less than 10 raw votes total for the question “Is there any sign of a bar feature through the centre of the galaxy?”, a consequence of the broad initial selection of featured galaxies and the multiply-branched nature of the classification tree. Because of this incompleteness and the lower number of votes per galaxy in the 4th tier of the classification tree (the position of the bar question), within the disk-parent sample the raw bar fractional vote is statistically useful, but uncertain for individual galaxies.
We therefore elected to supplement the volunteer data with visual classifications from the Galaxy Zoo science team to select the sub-sample of barred disk galaxies. Eight of the authors555BDS, TM, KWW, WCK, MR, KLM, RJS, EC inspected each of the 876 disk-parent galaxies for evidence of a bar. These votes were unanimous approximately 60% of the time, either for a bar feature (23 galaxies) or no bar (512 galaxies). Among galaxies where the science team voted unanimously that a bar is present, the median volunteer bar vote percentage and interquartile range are . Among galaxies where the science team was unanimous that a bar is not present, the median volunteer bar vote percentage and interquartile range are . The science team and volunteer bar vote percentages correlate ( with very high significance666The statistics package R reported , which indicates a value smaller than can be precisely reported using floating-point precision.: -value ), although the low number of volunteer votes for many objects means the dispersion in the correlation is high. We therefore choose not to include the incomplete volunteer votes for this question, considering only the science-team classifications in the determination of the bar percentage, . Following vote percentage thresholds used in previous studies, we mark a galaxy as barred if at least half of the science-team classifiers indicated the presence of a bar (). This vote fraction threshold has been shown to select strong bars (Masters et al., 2011; Willett et al., 2013; Melvin et al., 2014). Using this vote percentage threshold identifies 123 barred disk galaxies (hereafter the bar-parent sample) from among the disk-parent sample of 876 disk galaxies selected from the full GZ-CANDELS sample.
2.4.1 Redshift and Luminosity Selections
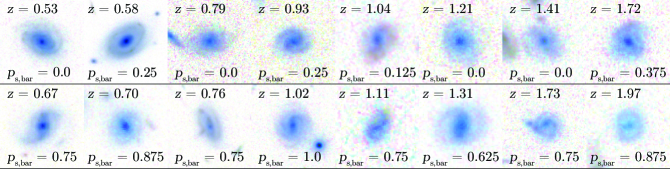
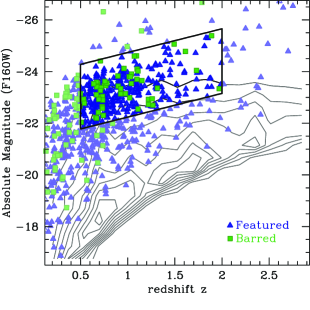
The absolute -band magnitudes in the sample are plotted as a function of redshift in Figure 4. Within the disk-parent sample, 525 galaxies have redshifts between ; within the bar-parent sample, 61 galaxies have . Within this redshift range, all flux measured in the WFC3 band is redward of the 4000 Å break. Examples of barred and unbarred galaxies are shown in Figure 3.
To minimize any bias caused by surface-brightness dimming at higher redshifts, we additionally employ a conservative luminosity cut when examining bar fractions, choosing a minimum absolute magnitude of at . This ensures that galaxy features can be detected within the sub-sample at all . We note that this is brighter than the knee of the rest-frame--band luminosity function at this redshift (Marchesini et al., 2012). In order to examine similar populations across our entire redshift range, we use a redshift-dependent luminosity cut based on selecting the same region of the evolving luminosity function (corrected to observed band; Blanton & Roweis, 2007; Marchesini et al., 2012): this selection is shown as a parallelogram shape in Figure 4. This final cut produces 370 not-edge-on disk galaxies within these luminosity and redshift bounds, of which 56 have strong bar signatures. Hereafter we refer to these as the disk-lz and bar-lz samples, respectively. We note that our results are robust to small variations in the redshift and luminosity thresholds chosen for the sample. For example, our qualitative result does not change if we use a fixed luminosity/stellar mass range.
2.4.2 Completeness corrections
For galaxies within the luminosity ranges considered here and observed at the depth of the CANDELS images (even the shallower “wide” fields), the composition of the final disk-lz sample is unlikely to be affected by surface brightness dimming. Furthermore, the analysis in this paper is concerned with large-scale, strong galactic bars, which are less affected by surface brightness dimming or the effects of diminishing resolution than weaker features. The result is a conservative selection with respect to feature detection, in the sense that both strong bars in particular and disks with features in general are unlikely to be missed.
However, it is necessary to account for the possibility that a substantial number of rotationally-supported disks with deceptively smooth distributions of light (i.e., disk galaxies that are entirely lacking in ‘features’) might be present in the sample. The presence of such a population would result in our measured bar fractions (Section 3) being overestimates.
To estimate the maximum contamination from such a population, we examine ‘smooth’ galaxies. In particular, we examine a subsample of all galaxies within our luminosity and redshift cuts (Section 2.4.1) with fewer than 30% of votes in the first question (from a total of at least 30) for either ‘Features or Disk’ or ‘Star or Artifact’ (hereafter the smooth-lz sample). We assume this sample has a mix of rotation-dominated and dispersion-dominated galaxies, and we assess the maximum fraction of this sample that could reasonably be a disk population using measurements of axis ratios for these systems (Galametz et al. 2013; Guo et al. 2013; Fontana et al. 2014, in press; M. Peth et al., in preparation).
Typical low-redshift disk galaxies have minimum (i.e., edge-on) axis ratios varying from (depending on bulge strength; e.g., Padilla & Strauss, 2008), and this minimum disk thickness likely increases somewhat for disk galaxies at higher redshift (e.g., Förster Schreiber et al., 2009; Law et al., 2009). To account conservatively for the possible thickening of disks, we assume that all featureless galaxies with axis ratios (i.e., ellipticities ) are disk galaxies. Assuming these are part of a randomly-oriented population of disks, we use their expected distribution of axis ratios (Lambas, Maddox, & Loveday 1992; Binney & Merrifield 1998; Padilla & Strauss 2008; Law et al. 2012b) to constrain the fraction of the smooth-lz sample that is composed of this hypothetical disk population. This fraction is for the full sample, and generally increases with redshift within our limits between 15% and 25%. It should be noted this is likely an overestimate of the contamination, as dispersion-dominated early-type galaxies with smooth light profiles and low axis ratios certainly exist (Emsellem et al., 2011).
In order to account for this possible contamination, we then apply these fractions to that part of the smooth-lz sample that is consistent with the not-edge-on selection described for the disk-lz sample above. We add those galaxy counts to each redshift bin of the disk-lz sample. The completeness correction effectively increases the size of the disk-lz sample to 525 galaxies. The bar fractions derived below are thus conservative lower limits.
2.5 Uncertainties and Measurement Errors
The goal of this study is to determine the fraction of the disk galaxy population at redshifts with strong bar features. We must therefore account for several potential sources of uncertainty in the measurement of the population bar fraction.
First, there are sampling errors due to the fact that we cannot sample the complete population of disk galaxies. When considering fractions of populations with a given attribute (such as a bar feature), the Normal approximation systematically underestimates proportional confidence errors when the true population fraction approaches 0 or 1, especially for small sample sizes. On the other hand, Cameron (2011) convincingly argues that an alternative and often-used approach estimating wider confidence intervals in the case of small number statistics (Clopper & Pearson, 1934; Gehrels, 1986) systematically overestimates these confidence intervals. For that reason, Cameron advocates a Bayesian approach to binomial confidence intervals, which we adopt in this study to estimate the uncertainty due to incomplete sampling. The full 68% confidence intervals for bar fractions in this study range from 0.04 to 0.07 around the measured fractions at each redshift. We additionally apply this method to re-calculate uncertainties for all the previous studies of bar population fractions to which we compare our results in Section 3.
There are also numerous sources of standard measurement error that could affect the measured population fractions. Here we consider the two additional sources of measurement error likely to have the greatest effect on the bar fractions: classification errors and errors in photometric redshifts.
We have estimated the uncertainties introduced into the bar fractions by photometric redshift errors via a bootstrap resampling of the redshifts in the disk-parent sample. Specifically, we resample the disk-parent sample times using a Monte Carlo method to vary the redshifts within the measured ; 92% of the sample is assumed to vary Normally around this value, and 8% are catastrophic outliers with errors uniformly distributed between . Errors on spectroscopic redshifts are assumed to be negligible. For each resampling, we re-calculate luminosities and re-select the disk-lz and bar-lz samples based on the resampled luminosities and redshifts. Using this method we find the additional uncertainties introduced into the bar fraction are small: .
Errors in visual classifications are greatly reduced by the Galaxy Zoo approach, which combines multiple independent classifiers. Each of the galaxies in the disk-parent sample have at least 40 independent classifications, enough that answers given in the first few branches of the classification tree have converged to a stable percentage of votes for a given feature (Willett et al., 2013). The selection method using vote percentages has also been demonstrated in previous studies to be very robust.
However, as described above, the volunteer classifications for the fourth-tier question, which directly asks about bar features (Figure 1), are not yet complete and have not uniformly converged in the disk-parent sample. The bar classifications from 8 of the authors of this study are complete, but the smaller number may introduce additional uncertainties into the measured bar fractions. Specifically, the mean and median of the individually classified population bar fractions are fully consistent with the bar fractions described in Section 3, but the spread from individual classifiers ranges from to , depending on redshift bin.
Combining the errors from these three sources produces estimates of combined uncertainties of , which are shown in Figure 5. We also show the error bars from the binomial confidence intervals calculated according to Cameron (2011) in both Figures 5 and 6, as these error bars provide a uniform context to compare with the results from other studies.
3 Results: Bar fractions
The fraction of disk galaxies with visually identified strong bars between is , a figure that is robust to moderate changes in luminosity ranges or vote fractions for detected features, lack of clumpiness, disk inclination angle, and strong bar features. Figure 5 shows the bar fraction with lookback time, from Gyr () to 10.2 Gyr (). The disk-lz sample encompasses the same subset of the galaxy luminosity function relative to the evolving . This conservative selection to ensure detectability of features (or lack thereof) to means the galaxies examined here are all brighter than at their epoch.

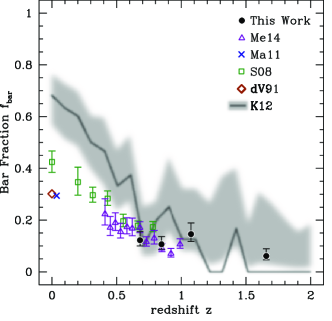
Figure 6 shows the visually identified strong bar fraction versus redshift in the context of other work, both observational and theoretical. Within the redshift range where we overlap with other observational studies, the bar fraction is consistent. However, the bar fraction with redshift appears to flatten at .
Within this sample, and given the uncertainties described in Section 2.5, the bar fraction is consistent with zero evolution between . Many studies of the bar fraction at find that the bar fraction does evolve, though these findings are not unanimous (Abraham et al., 1996, 1999; Jogee et al., 2004; Elmegreen et al., 2004a; Elmegreen & Elmegreen, 2005; Sheth et al., 2008; Cameron et al., 2010; Melvin et al., 2014). Two independent studies of the full COSMOS-ACS sample (Sheth et al., 2008; Melvin et al., 2014) show that the fraction of visually identified strong bars decreases with redshift, from approximately 35% at to 15% at .
Using zoom-in cosmological simulations of 33 field and loose group galaxies, Kraljic et al. (2012) find that disk galaxies at are generally too dynamically hot to become unstable to bar formation; this manifests itself as a decreasing bar fraction with increasing redshift. Although the quantitative bar fractions in their simulations depend on the threshold used to define a bar feature, the fraction of disk galaxies hosting bars drops to zero, or near zero, by any definition they use (Figure 6 shows their standard “strong bar” definition, which is the closest to observational samples defined by visual classifications such as those here and in previous work; Masters et al., 2011; Willett et al., 2013; Melvin et al., 2014). This initially appears inconsistent with our results showing a low, but non-zero, bar fraction (the observed bar fraction is formally inconsistent with 0 at the level). However, due to the very small number of simulated galaxies in Kraljic et al. that are disk galaxies at , a complete lack of bar feature detection within the subset of their sample identified as disk galaxies does not directly predict a bar fraction, and given the small sample the uncertainties quoted in that study (using the Normal approximation) are likely underestimates. We have re-calculated the uncertainties quoted in Kraljic et al., using the Bayesian approach to compute binomial confidence intervals (Cameron, 2011) discussed in Section 2.5. Given this approach, the lack of detection of bars at in the simulations is consistent with a bar fraction of up to % at these redshifts, within the recalculated 68% confidence intervals (shown in Figure 6).
We also note that the galaxy masses and luminosities used in the simulations were on average lower than those examined in this work: the model galaxies in the simulations reached at , whereas the galaxies in the disk-lz sample are within that stellar mass range by (Ilbert et al., 2009; Whitaker et al., 2011; Hartley et al., 2013). This makes a direct comparison between the simulations and this work more difficult, as bar fraction also depends on stellar mass (Sheth et al., 2008; Melvin et al., 2014). Kraljic et al. predict that massive disk galaxies will be more likely to form bars at higher redshift than lower mass disk galaxies due to higher-mass galaxies reaching dynamical maturity at earlier epochs. This is qualitatively consistent with our finding that the bar fraction at may be as high as within combined uncertainties (Section 2.5), but a direct and quantitative theoretical comparison to our observational result is currently not possible given available simulations. Expanded simulations encompassing galaxies with higher stellar masses would help to advance this field further.
Our results agree with previous work that the main epoch of disk settling (and thus bar formation) in the disk galaxy population begins at . However, bars are not completely absent even at : some disks at the masses probed by our sample () are mature enough even by this epoch ( Gyr after the Big Bang) to host a bar.
Whether the bar features are analogous to long-lived bars in dynamically cold disks at lower redshift or are shorter-lived features triggered within dynamically warmer disks is unclear from examination of bar fractions alone. Examination of individual simulated galaxies by Kraljic et al. indicates that bars formed at tend to undergo shorter cycles of formation and destruction., and there is some evidence that short-lived grand design spiral features more commonly associated with mature disks can be triggered by interactions at (Law et al., 2012a).
Thus the incidence of bars in massive high-redshift disks may be due at least in part to galaxy interactions and mergers, combined with shorter bar lifetimes due to dynamically warmer disks. Minor galaxy mergers may dynamically heat a disk and destroy a bar, or they may trigger the formation of a bar, depending on the particulars of the interaction (Noguchi, 1988; Gerin et al., 1990; Berentzen et al., 2003, 2004). The relative likelihood of these contrasting end results, combined with the incidence of minor mergers among this population at (e.g., Lotz et al., 2011), may combine to produce a net effect that stabilizes the bar fraction at % during this epoch of galaxy assembly.
Among the galaxies in the highest-redshift bin of the sample, 2 of the 8 barred galaxies appear to be undergoing an interaction or merger, and another 2 appear tidally disturbed, possibly by a nearby companion. This may suggest these bar features are merger-induced; on the other hand, mergers and interactions are not particularly rare during this epoch of galaxy assembly, so their appearance in the same galaxy population during the same epoch does not necessarily indicate a causal link.
To investigate this further, we examined the distributions of Galaxy Zoo vote fractions for the question “Is the galaxy currently merging or is there any sign of tidal debris?”, a second-tier question in the classification tree to which the possible responses are “Merger”, “Tidal features”, “Both”, or “Neither”. Kolmogorov-Smirnov tests between the barred and unbarred disk galaxy samples in any redshift bin for vote fractions for responses , , , and the sum of these fractions, are inconclusive (typical , with among the K-S tests, meaning the null hypothesis cannot be ruled out for any test). Resolving the question of whether shorter-lived bars are triggered by interactions and/or mergers may be possible in the future, upon the full reduction of Galaxy Zoo: CANDELS data and the addition of galaxy images from the remaining CANDELS fields to the Galaxy Zoo sample.
4 Summary
Using visual classifications of rest-frame optical HST galaxy images from the ongoing Galaxy Zoo: CANDELS project, we examined for the first time the fraction of disk galaxies hosting a bar feature to in order to trace the dynamical state of disks as early as Gyr after the Big Bang. We find that the bar fraction to is consistent with previous studies using similar analysis methods.
At , the bar fraction is approximately % and consistent with no evolution to . This is qualitatively consistent with the predictions of zoom-in cosmological simulations, although further work is needed to determine whether simulations of disk galaxies with predict the same quantitative strong bar fraction at .
That the bar fraction from appears to be small but constant among massive disk galaxies implies that massive disk dynamics do not rapidly change on average over this period. Further clarification may come in the future when additional detailed morphological classifications of deep rest-frame optical galaxy images are available. Future comparison with independent morphologies of the same galaxies (e.g., Kartaltepe et al., 2014) as well as additional simulations will help provide a more nuanced understanding of the underlying physical causes of this apparently stable bar fraction.
Acknowledgments
We are grateful to the anonymous referee for helpful comments and suggestions which improved this manuscript. TOPCAT (Taylor, 2005) and an OS X widget form of the JavaScript Cosmology Calculator (Wright, 2006; Simpson et al., 2013) were used while preparing this paper. BDS gratefully acknowledges support from the Oxford Martin School, Worcester College and Balliol College, Oxford. TM acknowledges funding from the Science and Technology Facilities Council ST/J500665/1. KLM acknowledges funding from The Leverhulme Trust as a 2010 Early Career Fellow. KWW and LF acknowledge funding from the UMN Grant-In-Aid program. RJS acknowledges funding from the Science and Technology Facilities Council ST/K502236/1. RCN acknowledges STFC Rolling Grant ST/I001204/1 to ICG for Survey Cosmology and Astrophysics . KS gratefully acknowledges support from Swiss National Science Foundation Grant PP00P2_138979/1.
The development of Galaxy Zoo was supported in part by the Alfred P. Sloan Foundation. Galaxy Zoo was supported by The Leverhulme Trust.
This work is based on observations taken by the CANDELS Multi-Cycle Treasury Program with the NASA/ESA HST, which is operated by the Association of Universities for Research in Astronomy, Inc., under NASA contract NAS5-26555.
References
- Abraham et al. (1999) Abraham R. G., Merrifield M. R., Ellis R. S., Tanvir N. R., Brinchmann J., 1999, \mnras, 308, 569
- Abraham et al. (1996) Abraham R. G., Tanvir N. R., Santiago B. X., Ellis R. S., Glazebrook K., van den Bergh S., 1996, \mnras, 279, L47
- Aguerri et al. (2009) Aguerri J. A. L., Méndez-Abreu J., Corsini E. M., 2009, A&A, 495, 491–504
- Athanassoula (2005) Athanassoula E., 2005, Celest.Mech.Dyn.Astron.
- Athanassoula et al. (2013) Athanassoula E., Machado R. E. G., Rodionov S. A., 2013, \mnras, 429, 1949
- Balestra et al. (2010) Balestra I. et al., 2010, \aap, 512, A12
- Bamford et al. (2009) Bamford S. P. et al., 2009, \mnras, 393, 1324
- Bennett et al. (2013) Bennett C. L. et al., 2013, \apjs, 208, 20
- Berentzen et al. (2003) Berentzen I., Athanassoula E., Heller C. H., Fricke K. J., 2003, \mnras, 341, 343
- Berentzen et al. (2004) Berentzen I., Athanassoula E., Heller C. H., Fricke K. J., 2004, \mnras, 347, 220
- Berentzen et al. (2007) Berentzen I., Shlosman I., Martinez-Valpuesta I., Heller C. H., 2007, \apj, 666, 189–200
- Binney & Merrifield (1998) Binney J., Merrifield M., 1998, Galactic astronomy. Galactic astronomy / James Binney and Michael Merrifield. Princeton, NJ : Princeton University Press, 1998. (Princeton series in astrophysics) QB857 .B522 1998 ($35.00)
- Blanton & Roweis (2007) Blanton M. R., Roweis S., 2007, \aj, 133, 734
- Cameron (2011) Cameron E., 2011, \pasa, 28, 128
- Cameron et al. (2010) Cameron E. et al., 2010, \mnras, 409, 346
- Cardamone et al. (2010) Cardamone C. N. et al., 2010, \apjs, 189, 270
- Carilli & Walter (2013) Carilli C. L., Walter F., 2013, \araa, 51, 105
- Casteels et al. (2013) Casteels K. R. V. et al., 2013, \mnras, 429, 1051
- Cheung et al. (2013) Cheung E. et al., 2013, \apj, 779, 162
- Cimatti et al. (2002) Cimatti A. et al., 2002, \aap, 392, 395
- Cirasuolo et al. (2007) Cirasuolo M. et al., 2007, \mnras, 380, 585
- Clopper & Pearson (1934) Clopper C. J., Pearson E. S., 1934, Biometrika, 26, 404
- Combes (2009) Combes F., 2009, in Astronomical Society of the Pacific Conference Series, Vol. 419, Galaxy Evolution: Emerging Insights and Future Challenges, Jogee S., Marinova I., Hao L., Blanc G. A., eds., p. 31
- Conselice et al. (2003) Conselice C. J., Bershady M. A., Dickinson M., Papovich C., 2003, Astron.J., 126, 1183
- Dahlen et al. (2013) Dahlen T. et al., 2013, \apj, 775, 93
- Darg et al. (2010a) Darg D. W. et al., 2010a, \mnras, 401, 1552
- Darg et al. (2010b) Darg D. W. et al., 2010b, \mnras, 401, 1043
- Davis et al. (2007) Davis M. et al., 2007, \apjl, 660, L1
- de Vaucouleurs et al. (1991) de Vaucouleurs G., de Vaucouleurs A., Corwin, Jr. H. G., Buta R. J., Paturel G., Fouqué P., 1991, Third Reference Catalogue of Bright Galaxies. Volume I: Explanations and references. Volume II: Data for galaxies between 0h and 12h. Volume III: Data for galaxies between 12h and 24h.
- Elmegreen & Elmegreen (2005) Elmegreen B. G., Elmegreen D. M., 2005, \apj, 627, 632
- Elmegreen et al. (2004a) Elmegreen B. G., Elmegreen D. M., Hirst A. C., 2004a, \apj, 612, 191
- Elmegreen et al. (2004b) Elmegreen D. M., Elmegreen B. G., Hirst A. C., 2004b, \apjl, 604, L21
- Elmegreen et al. (2007) Elmegreen D. M., Elmegreen B. G., Ravindranath S., Coe D. A., 2007, \apj, 658, 763
- Emsellem et al. (2011) Emsellem E. et al., 2011, \mnras, 414, 888
- Förster Schreiber et al. (2009) Förster Schreiber N. M. et al., 2009, \apj, 706, 1364
- Förster Schreiber et al. (2011) Förster Schreiber N. M., Shapley A. E., Erb D. K., Genzel R., Steidel C. C., Bouché N., Cresci G., Davies R., 2011, \apj, 731, 65
- Friedli & Benz (1993) Friedli D., Benz W., 1993, \aap, 268, 65–85
- Galametz et al. (2013) Galametz A. et al., 2013, \apjs, 206, 10
- Gawiser et al. (2006) Gawiser E. et al., 2006, \apjs, 162, 1
- Gehrels (1986) Gehrels N., 1986, \apj, 303, 336
- Gerin et al. (1990) Gerin M., Combes F., Athanassoula E., 1990, \aap, 230, 37
- Giavalisco et al. (2004) Giavalisco M. et al., 2004, \apjl, 600, L93
- Grogin et al. (2011) Grogin N. A. et al., 2011, \apjs, 197, 35
- Guo et al. (2013) Guo Y. et al., 2013, \apjs, 207, 24
- Hartley et al. (2013) Hartley W. G. et al., 2013, \mnras, 431, 3045
- Häussler et al. (2007) Häussler B. et al., 2007, \apjs, 172, 615
- Ilbert et al. (2009) Ilbert O. et al., 2009, \apj, 690, 1236
- Jogee et al. (2004) Jogee S. et al., 2004, \apjl, 615, L105
- Kartaltepe et al. (2014) Kartaltepe J. S. et al., 2014, ArXiv e-prints, 1401.2455
- Kassin et al. (2012) Kassin S. A. et al., 2012, \apj, 758, 106
- Koekemoer et al. (2007) Koekemoer A. M. et al., 2007, \apjs, 172, 196
- Koekemoer et al. (2011) Koekemoer A. M. et al., 2011, \apjs, 197, 36
- Kraljic et al. (2012) Kraljic K., Bournaud F., Martig M., 2012, \apj, 757, 60
- Lambas et al. (1992) Lambas D. G., Maddox S. J., Loveday J., 1992, \mnras, 258, 404
- Law et al. (2012a) Law D. R., Shapley A. E., Steidel C. C., Reddy N. A., Christensen C. R., Erb D. K., 2012a, \nat, 487, 338
- Law et al. (2009) Law D. R., Steidel C. C., Erb D. K., Larkin J. E., Pettini M., Shapley A. E., Wright S. A., 2009, \apj, 697, 2057
- Law et al. (2012b) Law D. R., Steidel C. C., Shapley A. E., Nagy S. R., Reddy N. A., Erb D. K., 2012b, \apj, 745, 85
- Lawrence et al. (2007) Lawrence A. et al., 2007, \mnras, 379, 1599
- Le Fèvre et al. (2004) Le Fèvre O. et al., 2004, \aap, 428, 1043
- Lilly et al. (2007) Lilly S. J. et al., 2007, \apjs, 172, 70
- Lintott et al. (2011) Lintott C. et al., 2011, \mnras, 410, 166
- Lintott et al. (2008) Lintott C. J. et al., 2008, \mnras, 389, 1179
- Lotz et al. (2011) Lotz J. M., Jonsson P., Cox T. J., Croton D., Primack J. R., Somerville R. S., Stewart K., 2011, \apj, 742, 103
- Lupton et al. (2004) Lupton R., Blanton M. R., Fekete G., Hogg D. W., O’Mullane W., Szalay A., Wherry N., 2004, \pasp, 116, 133
- Marchesini et al. (2012) Marchesini D., Stefanon M., Brammer G. B., Whitaker K. E., 2012, \apj, 748, 126
- Masters et al. (2012) Masters K. L. et al., 2012, \mnras, 424, 2180
- Masters et al. (2011) Masters K. L. et al., 2011, \mnras, 411, 2026
- Melvin et al. (2014) Melvin T. et al., 2014, \mnras
- Moore et al. (1996) Moore B., Katz N., Lake G., Dressler A., Oemler A., 1996, Nature, 379, 613–616
- Nair & Abraham (2010) Nair P. B., Abraham R. G., 2010, ApJL, 714, L260–L264
- Noguchi (1988) Noguchi M., 1988, \aap, 203, 259
- Odewahn (1996) Odewahn S. C., 1996, in Astronomical Society of the Pacific Conference Series, Vol. 91, IAU Colloq. 157: Barred Galaxies, Buta R., Crocker D. A., Elmegreen B. G., eds., p. 30
- Padilla & Strauss (2008) Padilla N. D., Strauss M. A., 2008, \mnras, 388, 1321
- Scoville et al. (2007) Scoville N. et al., 2007, \apjs, 172, 1
- Sellwood (2013) Sellwood J. A., 2013, Dynamics of Disks and Warps, Oswalt T. D., Gilmore G., eds., p. 923
- Sérsic (1968) Sérsic J. L., 1968, Atlas de galaxias australes. Cordoba, Argentina: Observatorio Astronomico, 1968
- Sheth et al. (2008) Sheth K. et al., 2008, \apj, 675, 1141
- Simmons & Urry (2008) Simmons B. D., Urry C. M., 2008, \apj, 683, 644
- Simpson et al. (2012) Simpson C. et al., 2012, \mnras, 421, 3060
- Simpson et al. (2013) Simpson R. J. et al., 2013, ArXiv e-prints, 1301.5193
- Skibba et al. (2012) Skibba R. A. et al., 2012, \mnras, 423, 1485
- Tacconi et al. (2010) Tacconi L. J. et al., 2010, \nat, 463, 781
- Tacconi et al. (2013) Tacconi L. J. et al., 2013, \apj, 768, 74
- Taylor (2005) Taylor M. B., 2005, in Astronomical Society of the Pacific Conference Series, Vol. 347, Astronomical Data Analysis Software and Systems XIV, Shopbell P., Britton M., Ebert R., eds., p. 29
- van der Wel et al. (2012) van der Wel A. et al., 2012, \apjs, 203, 24
- Vanzella et al. (2008) Vanzella E. et al., 2008, \aap, 478, 83
- Villa-Vargas et al. (2010) Villa-Vargas J., Shlosman I., Heller C., 2010, \apj, 719, 1470–1480
- Whitaker et al. (2011) Whitaker K. E. et al., 2011, \apj, 735, 86
- Willett et al. (2013) Willett K. W. et al., 2013, \mnras, 435, 2835
- Wright (2006) Wright E. L., 2006, \pasp, 118, 1711