Spectroscopic detections of CIII]1909 Å at : A new probe of early star forming galaxies and cosmic reionisation
Abstract
Deep spectroscopic observations of galaxies have revealed a marked decline with increasing redshift in the detectability of Ly emission. While this may offer valuable insight into the end of the reionisation process, it presents a fundamental challenge to the detailed spectroscopic study of the many hundreds of photometrically-selected distant sources now being found via deep HST imaging, and particularly those bright sources viewed through foreground lensing clusters. In this paper we demonstrate the validity of a new way forward via the convincing detection of an alternative diagnostic line, CIII]1909 Å , seen in spectroscopic exposures of two star forming galaxies at and 7.213. The former detection is based on a 3.5 hour X-shooter spectrum of a bright () gravitationally-lensed galaxy behind the cluster Abell 383. The latter detection is based on a 4.2 hour MOSFIRE spectra of one of the most distant spectroscopically confirmed galaxies, GN-108036, with . Both targets were chosen for their continuum brightness and previously-known redshift (based on Ly), ensuring that any CIII] emission would be located in a favorable portion of the near-infrared sky spectrum. We compare our CIII] and Ly equivalent widths in the context of those found at from earlier work and discuss the motivation for using lines other than Ly to study galaxies in the reionisation era.
keywords:
cosmology: observations - galaxies: evolution - galaxies: formation - galaxies: high-redshift1 Introduction
In the last few years, HST imaging has delivered several hundred galaxies with photometric redshifts estimated to be above (e.g., Schenker et al. 2013b; McLure et al. 2013; Bouwens et al. 2014; Ellis et al. 2013). Yet concerted efforts to secure spectroscopic redshifts through the detection of Ly emission have led to minimal progress. At the time of writing there are fewer than 10 spectroscopically-confirmed galaxies beyond (Vanzella et al., 2011; Ono et al., 2012; Schenker et al., 2012; Finkelstein et al., 2013; Schenker et al., 2014). and no convincing example beyond . While this represents some progress compared to 2006 when the frontier was at redshift 6.96 (Iye et al., 2006), the investment of telescope time to push the frontier back a mere 100 Myr in look-back time has been very costly. The relevant spectroscopic campaigns probing beyond have achieved a success rate for Ly significantly lower than at , where large equivalent width Ly emission is found in more than half of the galaxies observed (Stark et al. 2010, 2011). The most natural explanation for the downturn in Ly transmission in similarly-selected star-forming galaxies is that the intergalactic medium (IGM) is still partially neutral at , causing attenuation of Ly (e.g., Treu et al. 2013; Schenker et al. 2014).
While the reduced transmission of Ly at provides valuable insight into the end of the reionisation process, it also has profound implications for future spectroscopic studies of galaxies within the reionisation era. The arrival of efficient near-infrared spectrographs (McLean et al., 2012) and the discovery of a growing number of bright gravitationally-lensed galaxies (e.g., Richard et al. 2011; Zitrin et al. 2012; Bradley et al. 2013) promises great progress not only in measuring redshifts but also in spectroscopic diagnostic studies of typical early galaxies. However, with Ly increasingly obscured, presumably by the partially-neutral IGM at , the current approach of targeting Ly is unlikely to be productive. Indeed, even a 52 hour exposure recently undertaken with the ESO VLT failed to detect the line in a promising bright target (Vanzella et al., 2014).
The disappointing outcome of earlier spectroscopic efforts raises several important strategic questions. If Ly is undetectable in most star-forming galaxies in the reionisation era, must we rely entirely on photometric redshifts and imaging data to determine their physical properties? In fact, if there are no detectable features in the rest-frame UV, it would be unclear whether ground-based telescopes, including more powerful ones soon under construction, can contribute much to the study of early galaxies. Moreover, while JWST will ultimately provide access to strong nebular emission lines ([OIII]5007, H) to , spectroscopic studies at the highest redshifts (), where new sources are likely to be found, must perforce rely on detectable rest-frame UV features.
Ly is usually considered to be the only prominent UV emission line for star-forming galaxies. But this perception is mostly based on spectroscopic studies of relatively massive, chemically-enriched galaxies undergoing fairly rapid ( M⊙ yr-1) star formation (e.g., Shapley et al. 2003). However, the galaxies that populate the reionisation era are likely to have lower masses, reduced metallicities and larger specific star formation rates. In an important, in-depth, study of a metal-poor (1/6 Z⊙) galaxy at , Erb et al. (2010) demonstrated the presence of numerous prominent emission lines (OIII]1661,1666; He II1640, and the blended CIII]1908 Å doublet) throughout the rest-frame UV spectral region. Additional low mass galaxies have recently shown similar rest-UV emission spectra (Christensen et al., 2012; Bayliss et al., 2013; James et al., 2014).
In an attempt to select galaxies with physical properties similar to those expected in the reionisation era, Stark et al. (2014) secured deep rest-frame UV spectra for 17 faint gravitationally-lensed galaxies at with characteristic very blue UV colors () and intrinsic (unlensed) stellar masses ranging from 2106 M⊙ to 1.4109 M⊙. In this campaign, the CIII]1908 Å doublet was typically the strongest line other than Ly and detected in 16 galaxies with rest-frame equivalent widths up to 14 Å. Stark et al. interpreted such powerful metal line emission as arising from the large ionisation parameters and electron temperatures associated with metal poor galaxies dominated by very young stellar populations.
Thus, based on the emerging picture at , the strongest UV metal lines (CIV1549, OIII]1661,1666, CIII]1908 Å ) provide the most promising route not only to securing redshifts of star-forming galaxies in the reionisation era but also to progress in determining their physical nature. Stark et al. (2014) predicted that existing ground-based facilities should be able to detect these UV metal emission lines in galaxies. In this paper we present the first confirmation of this prediction from an ongoing campaign targeting UV metal line emission in the spectra of galaxies. In the initial phase of this program, our primary goal has been to verify that metal line equivalent widths are sufficiently large to be detected at . To maximise the likelihood of success, we have chosen targets that have bright continuum magnitudes () and known (Ly-based) spectroscopic redshifts. The latter requirement ensures that the relevant metal emission lines would lie in regions where the atmospheric transmission is near unity and obscuration from sky emission lines minimal. Clearly in the longer term, it is desirable to demonstrate spectroscopic detections for systems where Ly is completely suppressed.
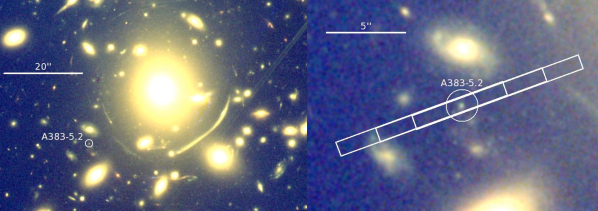
Here we report VLT/X-Shooter and Keck/MOSFIRE spectroscopic observations of the CIII]1908 doublet in two galaxies. The first system we discuss is a bright gravitationally-lensed system at . The galaxy, reported in Richard et al. (2011) and Bradley et al. (2013), is multiply-imaged into a pair by the foreground cluster Abell 383. The two images, A383-5.1 and A383-5.2, are both bright (J125=24.6 and 25.2) and highly-magnified (11.4 and 7.3). Ly emission was detected in each image by Richard et al. (2011) and, at the redshift , the CIII] doublet falls within a relatively clean region of the -band. The second system we discuss is GN-108036, a galaxy located in the GOODS North field. This galaxy was first identified as a bright (J140=25.2) z-band dropout in Ouchi et al. (2009). Ly emission was reported in Ono et al. (2012), providing spectroscopic confirmation at . At this redshift, the CIII] doublet is located in a region free from atmospheric absorption within the H-band.
The paper is organised as follows. We discuss our new near-infrared spectroscopic observations and reduction procedures in §2. The properties of Ly and CIII] for both sources are detailed in §3. We describe the modelling of the continuum and emission lines for A383-5.2 in §4. By determining the velocity offset of Ly with respect to CIII] we discuss the implications for the interpretation of the evolution of the fraction of photometrically-selected galaxies with Ly emission in §5. Finally, we discuss the prospects of using CIII] in future surveys and summarise our conclusions in §6. Throughout the paper, we adopt a -dominated, flat Universe with , and . All magnitudes in this paper are quoted in the AB system (Oke & Gunn, 1983).
2 Observations and data reduction
2.1 VLT/XShooter
As part of ESO program ID: 092.A-0630 (PI: Richard), the galaxy A383-5.2 (Richard et al., 2011) was observed with the XShooter spectrograph on the VLT (Vernet et al., 2011). We chose to pursue A383-5.2 because A383-5.1 (the brighter of the two lensed images) is located closer to the cluster centre, where diffuse light from bright cluster galaxies contributes considerably to the background in the near-infrared. Observations were conducted on the nights of 2013 October 27 and 2013 December 15 for 3 and 2 observing blocks (OBs) of 1 hour each, respectively. We used the 110.9” slit oriented to avoid bright galaxies (Figure 1). One OB comprised three exposures of 955 sec. in the visible arm, covering the wavelength range 5630-10090 Å at a resolution of R8800, and 3 exposures of 968 sec. in the near-infrared arm (with 4 sub-integrations of 242 sec.), covering the wavelengh range 10350-24780 Å at a resolution of R5300. A dither pattern of 2.5” along the slit was performed between each exposure, for optimal sky subtraction (Figure 1, right). The total exposure time on source was 14325 sec in the visible arm and 14520 sec in the near-infrared arm.
The sky conditions were clear and the seeing was very good in the first 3 OBs, with a range of 0.50-0.70” and a median seeing of 0.55”, but less good in the second set of 2 OBs, with a range of 0.60-0.90”. A spectroscopic standard star was observed on both nights for absolute flux calibration, and multiple telluric standard stars were observed to estimate telluric correction.
We used the latest version of the XShooter data reduction software (v.2.2.0) in the Recipe Flexible Execution Workbench (REFLEX) environment to perform a first calibration and reduction of each exposure. We then applied standard IDL and IRAF routines for optimally combining and extracting the 15 exposures. Specifically, we used the Lyman- emission line, well-detected in each exposure, to correct for variations in seeing and atmospheric conditions between the different OBs, and applied a scaling and weighting of the 2D spectra according to the flux and detection level of the Lyman-alpha line. We also used the spatial position of the line measured in the reduced spectrum to precisely compute the offsets between each OB for optimal combination. We used the same offsets, scaling factors and weights to combine the exposures in the near-infrared arm. Applying these corrections slightly strengthened the S/N of the CIII] line, increasing our confidence in the detection.
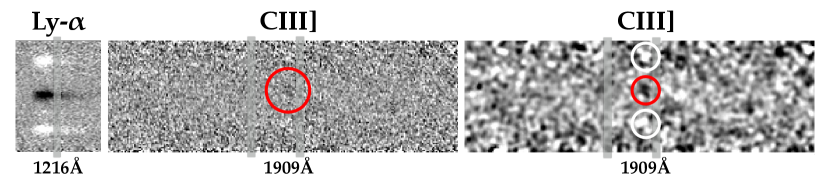
The combined 2D spectrum was extracted using a variance-weighting scheme in IRAF based on the detected profile of the lines. We also used the normalized extracted spectrum of the telluric standards to apply a median correction for telluric absorptions in the near-infrared arm. The final combined 2D spectrum at wavelengths near Ly and CIII] are presented in Figure 2 and discussed in Section 3.1
2.2 Keck/MOSFIRE
We secured spectroscopic observations of GN-108036 with MOSFIRE (McLean et al., 2012) on the Keck I telescope on the nights of March 6 and April 11, 2014. GN-108036 is one of the most distant spectroscopically-confirmed galaxies at =7.213, first verified by Ono et al (2012) based on three separate exposures with the DEep Imaging Multi-Object Spectrograph (DEIMOS) on Keck 2; the rest-frame equivalent width of Ly is reported as 33 Å . During the March run, we compiled a total of 3.1 hours of exposure in the H band with an 0.8” slit. Conditions were generally clear, but with slight cloud during the first half of the observations. The median FWHM of a reference star included on the mask was 0.6”. On the April night, we secured an additional 1.1 hours, with a median seeing FWHM of 0.5” and clear conditions.
The data were reduced using the regular MOSFIRE data reduction pipeline (DRP)***https://code.google.com/p/mosfire/ following a procedure similar to that described in (Schenker et al., 2014) to which the reader is referred. Briefly, this pipeline first creates a median, cosmic-ray subtracted flat field image for each mask. Wavelength solutions for each slit are fit interactively for the central pixel in each slit, then propagated outwards to the slit edges to derive a full wavelength grid. Background subtraction is handled as a two stage procedure. First, individual stacks of all A frames and all B frames are used to produce A-B and B-A stacks. As the A and B frames are temporally interleaved, this provides a first level of subtraction. Secondly, a 2-D b-spline model is fit to the residuals in each of these stacks. The two stacks are then shifted, rectified, and combined, producing a positive source signal flanked by two negative signals at approximately half strength, separated by the dither length. To account for the variation in conditions during the March run, we split the data into three segments of 1 hour each, which were then run through the DRP separately. To produce a final science stack, the resulting three images plus the single reduced image from our April data were then stacked using inverse-variance weighting. The final stack has an average 5 flux limit of 1.8 10-18 erg cm-2 s-1 in between sky lines, consistent with the expectation produced from the MOSFIRE exposure time calculator. The final combined 2D spectrum at a wavelength near CIII] is presented in Figure 3 and discussed in Section 3.2 below.
3 Rest-UV Spectroscopic Properties
3.1 A383-5.2
3.1.1 Large equivalent width Ly emission
The Ly emission line of both A383-5.1 and A383-5.2 was first reported in the original Richard et al. (2011) paper following observations with the DEIMOS spectrograph on the Keck II telescope. In the discovery spectrum, Ly was significantly detected (S/N=7.3), but it was blended with a sky line and the slit was slightly offset from the target (J. Richard, private communication), precluding reliable constraints on the line strength and profile.
Figure 2 demonstrates a much more significant detection of Ly. The improved spectral resolution of XShooter separates Ly from the nearby sky line. We derive a total Ly line flux of 1.210-16 erg cm-2 s-1. Correcting for slit losses (taking into account the size of the galaxy, the slit width, and the seeing), we estimate an aperture correction of 1.06. The peak of the line occurs at 8545.6 Å, implying a Ly redshift of z. After correcting for the source magnification (7.3; Richard et al. 2011) and applying the aperture correction, the total Ly luminosity is 6.81042 erg s-1.
The Ly equivalent width is inferred via two different methods. First, using the measured line flux and the upper limit (2) on the continuum flux from the XShooter spectrum ( erg cm-2 s-1 Å-1), we derive a lower limit on the rest-frame equivalent width (W Å). Since the continuum is usually well below spectroscopic flux limits, it is common to use the continuum flux measured from broadband imaging to calculate the equivalent widths of emission lines. With this second method, we infer WLyα,0=138 Å, consistent with the upper limit derived above and placing A383-5.2 among the most extreme Ly emitters at (e.g., Ouchi et al. 2010; Stark et al. 2011; Pentericci et al. 2011; Curtis-Lake et al. 2012). The large equivalent width likely reflects both a larger-than-average escape fraction of Ly radiation (fesc,Lyα) and an efficient production rate of Ly photons (as might be expected for a young metal-poor system). Assuming a metallicity of 0.2 Z⊙, a Chabrier IMF, and 10% ionising photon escape fraction) and using Bruzual & Charlot (2003) stellar population models, the Ly luminosity of A383-5.2 implies a a star formation rate of 3.2 (fesc,Lyα)-1 M⊙ yr-1.
3.1.2 CIII]1909 emission
At , the CIII] equivalent width generally increases with the Ly equivalent width (e.g., Shapley et al. 2003, Stark et al. 2014). For Ly emitters with equivalent widths as large as A383-5.2 (WLyα,0=138 Å), the blended CIII]1908 doublet would be expected to have a rest-frame equivalent width above 10 Å. However at the resolution of XShooter resolves the CIII] doublet, so each of the individual components will be detected with somewhat lower equivalent widths. Given the bright apparent magnitude of A383-5.2 (J125=25.2), both components of CIII] should be above the XShooter detection limits if located in between the OH sky lines.
Knowledge of the spectroscopic redshift from Ly allows us to estimate the observed wavelengths of CIII]. However, a precise determination must account for the fact that the peak of the emergent Ly profile is typically offset with respect to the systemic redshift probed by CIII]. For low mass star forming galaxies similar to A383-5.2, the centroid of the blended CIII] doublet is blueshifted between 60 and 450 km s-1 (with a mean of 320 km s-1) from Ly (Stark et al. 2014). We thus expect [CIII]1907 to lie between 1.3383 and 1.3400 m and CIII]1909 to lie between 1.3397 and 1.3415 m, each of these windows spanning just 50 spectral pixels. Since the spatial position is also well established (by the location of Ly along the slit), the window over which we expect to see CIII] is confined to a very small area in the spectrum.
Examination of the XShooter spectrum reveals a 3.8 emission feature at 1.3412 m, in the spectral window expected for the CIII]1909 emission line. The feature is in the centre of the slit at the spatial location of A383-5.2 and is blueshifted by 120 km s-1 with respect to Ly, implying a CIII]1909 redshift of . At this redshift, [CIII]1907 is unfortunately coincident with an atmospheric OH line at 1.3397m. There is a positive emission feature at the expected location, but the noise associated with the sky line precludes useful flux constraints. The flux of CIII]1909 is . As we will show below, the chance of randomly finding a 3.8 fluctuation in the small 50 pixel area defined by Ly is very small.
To compare the UV spectrum of A383-5.2 to that of UV line emitters at (e.g. Erb et al. 2010; James et al. 2014, Stark et al. 2014), we must estimate the flux in the [CIII]1907 line. The ratio of the individual components of CIII] is set by the electron density. Over the range of gas densities typical in high redshift star forming galaxies (102 cm-3 and 104 cm-3; e.g., Hainline et al. 2009; James et al. 2014), the [CIII]1907/CIII]1909 ratio varies between 1.6 and 1.2 respectively. Taking the ratio as 1.40.2, we estimate that the total flux in the CIII] doublet is . Via the same procedure, we determine the total rest-frame CIII] equivalent width to be Å.
Confidence in the detection is bolstered by two tests. As described above, prior knowledge of the redshift allows us to define a very small (50 pixels by 5 pixels) search window for each component of the CIII] doublet. The likelihood of randomly finding a 3.8 emission feature in the area expected for CIII] is highly unlikely. In N=105 realisations of the error spectrum, we do not find any case in which the flux in the small window is as large as we observed. We have also verified that the emission feature is not dominated by spurious emission in one or two of the fifteen exposures. We visually examined each of the exposures and verified that hot pixels and cosmic rays are not present. We also split the exposures into two subsets. The first group contains the six exposures with the best seeing and stable conditions (as defined by the Ly detection in the visible arm), and the second group contains the nine frames over which the seeing degraded. The CIII] emission feature is 2.5 more significant in the stack with the best seeing, as would be expected if the line is associated with A383-5.2 and not a detector artifact.
3.2 GN-108036
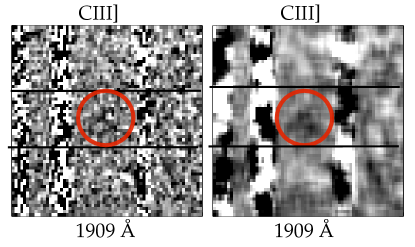
The centroid of Ly (0.9984 m) reported for GN-108036 by Ono et al. (2012) places CIII] in the H-band. Assuming the velocity offset of Ly with respect to CIII] is between 0 and 450 km s-1 (e.g. Stark et al. 2014), [CIII]1907 will be located between 1.56359 and 1.56594 m and CIII]1909 between 1.56528 and 1.56763m. With the spectral resolution of MOSFIRE, each window spans only 14 spectral pixels. Figure 3 reveals a faint emission feature in the small window as expected for CIII]1909. Clearly the feature is not as prominent as in A383-5.2 (Figure 2) but this is perhaps not surprising given the lower Ly equivalent width (33 Å). The line is in a region free from skyline contamination, and the centroid is consistent with the expected position of the target along the slit to within 3 pixels, or 0.55 arcseconds. We measure a flux of 0.910-18 erg cm-2 s-1 in an aperture of 1.1 arcseconds in the spatial direction and 13 Å in the spectral direction. With a S/N of 2.8, it is difficult to reliably determine the line centroid. Positive emission roughly spans 1.5672 to 1.5684m. If the emission shown in Figure 3 is CIII]1909, it would imply a small velocity offset for Ly (between 150 and 76 km s-1), consistent with Ly emerging near the systemic redshift. At the redshift of GN-108036, the two components of the CIII] doublet are split by 17 Å. For the CIII]1909 redshift defined by the emission feature described above, the [CIII]1907 line would lie underneath the bright OH skyline visible blueward of the CIII]1909 in Figure 3. The noise is more than 3 larger on the skyline, precluding identification of the second component.
One test of the reality of the detection is to measure the fluxes at the expected positions of the two negative images flanking the emission feature. As our final stack is the sum of an A-B image and a shifted B-A image, we expect two negative images, each of approximately half the total flux, offset above and below the positive image by the dither length of 2.5 arcseconds. We find this is the case and measure significances of 2.0 above the line, and 1.9 below. We further evaluate the line in the four separate subsets of the data discussed earlier, each with an exposure time of 1 hour. In each subset, we measure a positive signal to noise ratio in the same aperture used to measure the composite line flux.
To compute the total equivalent width of the CIII] doublet, we follow same procedure we described in §3.1.2. Given the likely range of electron densities (102 cm-3 - 104 cm-3), we expect a [CIII]1907/CIII]1909 flux ratio of 1.40.2. Taking into account the uncertainty in the flux ratio and the noise in the CIII]1909 flux, we estimate a [CIII]1907 flux of 1.310-18 erg cm-2 s-1. The CIII] doublet rest-frame equivalent width implied by this analysis ( Å) is slightly lower than seen in A383-5.2, but is consistent with the Ly - CIII] equivalent width relationship for galaxies from Stark et al. (2014).
Although our detection of CIII]1909 is much less secure than that of A353-5.2, it is a good indication of the challenge and prospects of securing non-Ly redshifts for typical sources. Deeper MOSFIRE data with exposure times in excess of 6-8 hours may be required for convincing measurements of the fluxes and equivalent widths of such examples. Given the lower significance of the CIII]1909 detection in GN-108036, we will focus most of the remaining discussion on the more secure detection in A383-5.2.
4 Modelling the continuum and emission lines of A383-5.2
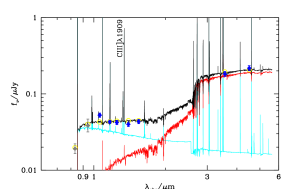
The broadband SED of A383-5.2 (Figure 4) exhibits a very strong break between the H160-band and the [3.6] and [4.5] bands. Richard et al. (2011) interpret this as a Balmer Break indicative of an evolved (800 Myr) stellar population. Alternatively the break could arise if nebular emission from [OIII]+H and H provide substantial contributions within the [3.6] and [4.5] filters, as might be expected if the SED is dominated by a very young stellar population. Distinguishing between these two very different interpretations of the SED is clearly important and can only proceed via direct measurements of the rest-frame optical emission lines. Here we consider whether adding a CIII] line flux constraint, which is sensitive to star formation on shorter timescales than that based on the stellar continuum, can clarify the past star formation history of A383-5.2.
4.1 Method
We fit the continuum spectral energy distribution and CIII] equivalent width of A383-5.2 using an approach similar to that adopted in Stark et al. (2014). We use the latest version of the Bruzual & Charlot (2003) stellar population synthesis model with the standard photoionisation code CLOUDY (Ferland et al., 2013) to describe both the stellar and gaseous emission (Gutkin et al., in preparation, who follow the prescription of Charlot & Longhetti 2001).
Further details are provided in Stark et al (2014) but, in brief, the main parameters of the photoionised gas are its interstellar metallicity, , the typical ionisation parameter of a newly ionised HII region, (which characterises the ratio of ionising-photon to gas densities at the edge of the Strmgren sphere), and the dust-to-metal (mass) ratio, (which characterizes the depletion of metals on to dust grains). We consider models with C/O (and N/O) abundance ratios ranging from 1.0 to 0.05 times the standard values in nearby galaxies [ and ] to describe the delayed release of C and N by intermediate-mass stars relative to shorter-lived massive stars in young galaxies. We also include attenuation of line and continuum photons by dust in the neutral ISM, using the 2-component model of Charlot & Fall (2000), as implemented by da Cunha et al. (2008, their equations 1–4). This is parameterised in terms of the total -band attenuation optical depth of the dust, , and the fraction of this arising from dust in the diffuse ISM rather than in giant molecular clouds. Accounting for these two dust components is important in differentiating the attenuation of emission-line and stellar continuum photons.
As we will describe in more detail in §4.2, the need to simultaneously fit the continuum spectral energy distribution and the CIII] equivalent width motivates us to explore a wider range of star formation histories than Stark et al. (2014). In particular, we consider models with two-component star formation histories: a ‘starburst’ component (represented by a 10 Myr-old stellar population with constant SFR) and an ‘old’ component (represented by a stellar population with constant or exponentially declining SFR with age between 10 Myr and the age of the Universe at the galaxy redshift). We adopt the same stellar metallicity for both components matching that of the gas-phase. The relative contribution of the burst component is a free parameter; in the limiting case where the burst provides a negligible contribution to the stellar mass fraction, the star formation history approaches the single component star formation histories which are commonly used in high redshift SED fitting. Given the young ages at redshifts , this simple modeling of star formation and chemical enrichment adequately samples the allowed parameter space. We adopt a Chabrier (2003) initial mass function in all models.
To interpret the combined stellar and nebular emission from A383-5.2, we build a comprehensive grid of models covering wide ranges of input parameters. Specifically, we take about 70 model ages between 10 Myr and the age of the Universe (at the redshift of the galaxy we are modelling) for the old stellar component; 30 stellar mass fractions of the starburst relative to the old components, spaced logarithmically between and unity; metallicities , 0.0002, 0.0005, 0.001, 0.002, 0.004, 0.008, 0.017, and 0.03; gas ionisation parameters , , , , , , and ; dust-to-metal ratios , 0.3, and 0.5; C/O (and N/O) scaling factors 1.0, 0.85, 0.65, 0.45, 0.25, 0.15, and 0.05; 10 attenuation optical depths between 0 and 1; and, for each , 2 values of (0.3 and 0.9). We adopt a Bayesian approach similar to that of Pacifici et al. (2012, their equation 2.10) to compute the likelihood of each model given the data.
4.2 A383-5.2
| Model fit to A383.5.2 | |
|---|---|
The acceptable parameter fits are shown in Table 1. Including the nebular line constraints in the modelling has provided several key advances. First the dependence of emission line equivalent widths on the ionised gas physical conditions allows new constraints on the metallicity, relative C/O abundance, and ionisation parameter in star forming galaxies at . As can be seen in Table 1, the large equivalent width of CIII] in A383-5.2 requires models with a very low metallicity (log Z = ), large ionisation parameter (log U=), and low C/O ratio (log C/O = ), similar to the population of ultra-faint lensed galaxies at (Stark et al., 2014). These constraints are almost entirely lost when the CIII] equivalent width is not included in the fitting procedure. The total stellar mass implied by the models is 3.2109 M⊙, in close agreement with that reported in Richard et al. (2011). The current star formation rate is 1.9 M⊙ yr-1, broadly consistent with that inferred from the Ly luminosity in §3.1.1.
We find that single component star formation histories struggle to reproduce the continuum SED and CIII] equivalent width. Very young ( yr), dusty, and metal poor models can reproduce the apparent Balmer Break with strong [OIII]+H and H emission dominating the [3.6] and [4.5] fluxes. But with strong attenuation and substantial reddening, the young single component models underpredict the CIII] equivalent width and overestimate the H160 flux. Similarly, while an old stellar population produced by a single component star formation history can account for the large break between the H160-band and [3.6], it is unable to reproduce a large equivalent width CIII] emission or a blue UV continuum slope supported by the available imaging and spectroscopy.
We thus find that the observational data indicate a two-component star formation history (Figure 4). The nebular lines and far UV continuum are dominated by a recent burst, while the rest-optical light seen by the Spitzer/IRAC filters is powered by a somewhat older stellar population. Both populations contribute roughly equally to the emerging near-UV continuum. The young burst component contributes very little to the total stellar mass ( 10-3) but provides enough ionizing output to match the observed CIII] equivalent width.
A383-5.2 is certainly not unique in this respect at very high redshift: Rodriguez Espinosa et al. (2014) have recently argued that a two component star formation history is necessary to explain the combined emission line and continuum constraints on a pair of galaxies at . But whether multi-component star formation histories are typical among at sources is not yet clear. Very young stellar ages (10 Myr for constant star formation) have been suggested based on the large equivalent width of optical nebular emission lines required to match the Spitzer/IRAC colours of galaxies (e.g. Finkelstein et al. 2013; Smit et al. 2014). But it is unlikely that such systems (located 650-800 Myr after the Big Bang) have only been forming stars for such a short period. Indeed the average stellar continuum of galaxies is indicative of older (100 Myr for constant star formation) stars (Dunlop et al. 2013, Labbé et al. 2013). Multi-component star formation histories with a recent upturn powering the nebular emission provide a natural explanation for this tension. As larger samples of galaxies with UV metal line and high S/N continuum constraints emerge, it will be possible to clarify the nature of early galaxy star formation histories in more detail.
5 Reionisation and the Ly velocity offset
The attenuation of Ly emission from galaxies at provides a valuable probe of reionisation. Ground-based spectroscopy has been used by several groups to measure the redshift dependent fraction of UV selected galaxies at with Ly emission (e.g., Stark et al. 2010; Schenker et al. 2012; Ono et al. 2012). As described in §1, the Ly emitter fraction appears to drop rapidly over (e.g., Ono et al. 2012; Treu et al. 2013; Pentericci et al. 2014; Schenker et al. 2014; Tilvi et al. 2014), as might be expected if the IGM is partially neutral at .
Theoretical efforts are now focused on determining how neutral the IGM must be at in order to reproduce the drop in visibility of Ly emission beyond . During the late stages of reionisation, the cosmic HII regions surrounding star-forming galaxies are expected to be very large. As a result, the impact of IGM damping wing absorption on Ly emission is likely to be minimal in the final phase of reionisation when neutral hydrogen fractions are low. Because of this, most attempts to model the drop in the Ly emitter fraction require that the IGM evolves from being fully ionised at to a neutral fraction by volume as large as 60% at (e.g., McQuinn et al. 2007; Mesinger & Furlanetto 2008; Jensen et al. 2013).
Such a striking evolution in the ionization state of the IGM seems unphysical over such a brief period of cosmic history (e.g., Sobacchi & Mesinger 2014; Robertson et al. 2013; Mesinger et al. 2014). As a result, alternative explanations have been considered. If the photo-ionising background drops at , the prevalence of self-shielded systems within ionised regions of the IGM would increase rapidly, providing an additional source of opacity for Ly photons (Bolton & Haehnelt, 2013). Furthermore, if the escape fraction of ionising radiation (fesc) increases by a small amount over (fesc=0.1), the Ly luminosity may be significantly reduced (Dijkstra et al., 2014). Finally, if the velocity offset between Ly and the galaxy systemic redshift is less than observed at low redshift, a partially neutral IGM would be more effective at attenuating Ly, thereby lowering the neutral fraction required to reproduce the observations (e.g., Dijkstra et al. 2011; Schenker et al. 2014; Mesinger et al. 2014).
Of the three factors described above, the Ly velocity offset is the most feasible to constrain via direct observations. If the Ly velocity offset is similar to that found in bright UV-selected galaxies at (= 445 km s-1; Steidel et al. 2010), the IGM would likely have to be mostly neutral at to be consistent with the Ly observations at the 1 level (Mesinger et al., 2014). But if the Ly velocity offset is lower (i.e., 200 km s-1) as is often seen in strong Ly emitters (e.g. Tapken et al. 2007; McLinden et al. 2011; Hashimoto et al. 2013), the downturn in Ly visibility could be produced with an IGM that is still substantially ionised (; Mesinger et al. 2014) at . Schenker et al. (2013a) already indicated a possible reduction in the velocity offset with increasing redshift by comparing observations of [O III] and Ly in UV-selected galaxies at with similar samples at . Albeit with a small sample of 9 sources, their velocity offsets were typically 150 km s-1.
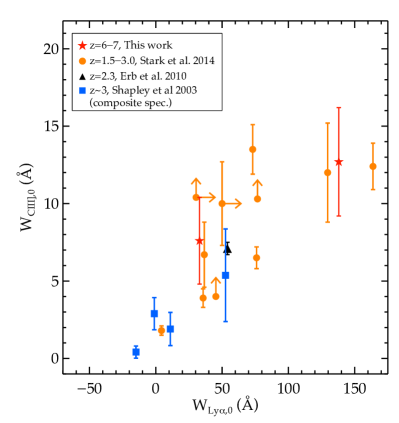
However, at , such rest-frame optical emission lines are not detectable from the ground. Thus, since the UV metal lines probe the galaxy systemic redshift (e.g., Erb et al. 2010, Stark et al. 2014), they provide the only immediate means of determining the distribution of at . Indeed, our detection of CIII]1909 in A383-5.2 provides the first constraint on the Ly velocity offset in a galaxy, and reveals an offset of only (Figure 5). Such a low Ly velocity offset is consistent with an extension of the redshift-dependent trend found in Schenker et al. (2013a), likely reflecting the general increase in the Ly equivalent width over seen for similarly-selected UV sources (Stark et al., 2011).
The detection of CIII]1909 in Figure 3, although less significant, implies that the Ly offset of GN-108056 is possibly even smaller. While A383-5.2 is observed when the Universe is highly ionized, GN-108056 is likely observed in a partially neutral IGM. At , the IGM damping wing absorption will attenuate Ly most strongly in systems with low velocity offsets. Focusing our UV metal line follow-up on galaxies with known Ly detections should bias us toward galaxies with significant transmission through the surrounding IGM. In principle, this should cause us to select the subset of Ly emitters with large velocity offsets. The fact that we find little to no velocity offset for GN-108036, one of the few known Ly emitters at , might reflect the absence of large velocity offsets in the reionization era.
If Ly velocity offsets as small as A383-5.2 and GN-108036 are common at , the IGM evolution required to reproduce the downturn in the Ly fraction would be less rapid than previous estimates using large Ly velocity offsets , providing a more physically reasonable reionisation history (see Robertson et al. 2010, 2013; Mesinger et al. 2014). As the number of bright galaxies with Ly detections increases, it will be feasible to assemble a moderate sample of galaxies with Ly and UV metal line detections, providing the first measurement of the distribution of Ly velocity offsets in reionisation-era galaxies and thereby removing one of the key systematic uncertainties in mapping Ly evolution to a reionisation history.

6 Discussion and Summary
Considerable effort has been placed in spectroscopic study of galaxies. Yet, in spite of significant allocations of telescope time to several research teams, few spectroscopic redshifts have been confirmed beyond due to the absence of Ly. Although the physical explanation for this suppression is of interest in its own right in terms of constraining the reionisation history, it is essential to locate lines other than Ly in distant sources for many reasons. Firstly, the Ly emitter fraction test is currently applied to a photometrically-selected sample. If no line is detected, there is an obvious ambiguity in interpretation between a suppressed Ly at the redshift of interest and a foreground object. Clearly securing the redshift from an additional line breaks this degeneracy. Secondly, as discussed in §5, the interpretation of the redshift-dependent Ly fraction in terms of the evolving neutral fraction depends on the velocity offset of the line with respect to the systemic redshift which, at , can only be determined with current facilities using rest-frame UV nebular lines. Finally, Stark et al (2014) demonstrate, via detailed modeling, how measures of rest-frame UV lines such as NIV], OIII], CIV, Si III] and CIII] can provide unique information on important physical properties of galaxies during the reionisation era, including the ionisation parameters, metallicities and star formation histories which remain degenerate when interpreting SEDs based on broad-band photometry alone.
In this paper we have demonstrated it is feasible to detect the CIII] 1908 Å doublet in star-forming galaxies. The two sources we discuss are very different and illustrate the challenges even with state-of-the-art near-infrared spectrographs on the largest ground-based telescopes. A363-5.2 is a gravitationally-lensed galaxy at a redshift 6.029. It is bright (), highly magnified (7.4) and a convincing CIII] 1909 detection has been secured in only a 3.5 hour exposure. The source is typical of the brightest sources that have been located in lensing surveys of foreground clusters (e.g. the CLASH program). GN-108036 is more typical of the bright sources found in deep blank field surveys. Although not fainter (), as it is unlensed, it is more luminous and even with a 4.2 hour exposure, the detected CIII] is much weaker.
The robust detection of CIII] in A383-5.2 has enabled us to measure a reduced velocity offset of Ly in a source as well as to break degeneracies of interpretation in the SED. Specifically, including the strength of CIII] in our modeling fits to the spectral energy distribution allows us to determine a low metallicity (log Z=), a large ionisation parameter (log U=) and a low C/O ratio. More importantly, however, we argue the tension between the strength of CIII] (which is sensitive to star formation on 10 Myr timescales) and the measured Balmer break and rest-frame UV continuum slope (indicative of a more mature population) can be reconciled if the star formation has been erratic with a recent burst of activity contributing significantly to the nebular spectrum. If this behavior is typical of star-forming galaxies, it may explain the prominent rest-frame optical nebular lines inferred in recent studies (e.g. Smit et al 2013).
As discussed in §1, the ultimate goal would be a redshift survey based on rest-frame UV lines other than Ly, particularly in securing more precise measures of the Ly fraction. However, we have considered it is prudent in the first instance to base our searches using those few targets for which Ly has already been detected. This may, admittedly, lead to some biases in interpretation if, for example, the sources have untypical Ly fluxes for some reason. As one progresses to higher redshift, the flux ratio of CIII] to Ly should increase since Ly is increasingly suppressed and CIII] is more prominent in metal-poor systems. Figure 6 gives no strong evidence of a shift in this direction compared to the distribution seen at lower redshift by Stark et al (2014) but the samples are small and uncertainties remain large.
Despite the observational challenges, our results confirm the feasibility of studying bright galaxies in the reionisation era through rest-frame UV lines other than Ly.
Acknowledgments
We thank Dawn Erb, Martin Haehnelt, Juna Kollmeier, Andrei Mesinger, and Alice Shapley for enlightening conversations. DPS acknowledges support from the National Science Foundation through the grant AST-1410155. JR acknowledges support from the European Research Council (ERC) starting grant CALENDS and the Marie Curie Career Integration Grant 294074. SC, JG and AW acknowledge support from the ERC via an Advanced Grant under grant agreement no. 321323 – NEOGAL. The results are partially based on observations made with ESO telescopes at the La Silla Paranal Observatory under programme 092.A-0630 and the W.M. Keck Observatory. This work was partially supported by a NASA Keck PI Data Award, administered by the NASA Exoplanet Science Institute. Data presented herein were obtained at the W. M. Keck Observatory from telescope time allocated to the National Aeronautics and Space Administration through the agency’s scientific partnership with the California Institute of Technology and the University of California. The Observatory was made possible by the generous financial support of the W. M. Keck Foundation. The authors acknowledge the very significant cultural role that the summit of Mauna Kea has always had within the indigenous Hawaiian community. We are most fortunate to have the opportunity to conduct observations from this mountain.
References
- Bayliss et al. (2013) Bayliss M. B., Rigby J. R., Sharon K., Wuyts E., Florian M., Gladders M. D., Johnson T., Oguri M., 2013, ArXiv e-prints
- Bolton & Haehnelt (2013) Bolton J. S., Haehnelt M. G., 2013, MNRAS, 429, 1695
- Bouwens et al. (2014) Bouwens R. J., Illingworth G. D., Oesch P. A., Trenti M., Labbe’ I., Bradley L., Carollo M., van Dokkum P. G., Gonzalez V., Holwerda B., Franx M., Spitler L., Smit R., Magee D., 2014, ArXiv e-prints
- Bradley et al. (2013) Bradley L. D., Zitrin A., Coe D., Bouwens R., Postman M., Balestra I., Grillo C., Monna A., Rosati P., Seitz S., Host O., Lemze D., Moustakas J., Moustakas L. A., Shu X., Zheng W., Broadhurst T., Carrasco M., Jouvel S., Koekemoer A., . Medezinski E., Meneghetti M., Nonino M., Smit R., Umetsu K., Bartelmann M., Benitez N., Donahue M., Ford H., Infante L., Jimenez-Teja Y., Kelson D., Lahav O., Maoz D., Melchior P., Merten J., Molino A., 2013, ArXiv e-prints
- Bruzual & Charlot (2003) Bruzual G., Charlot S., 2003, MNRAS, 344, 1000
- Chabrier (2003) Chabrier G., 2003, PASP, 115, 763
- Charlot & Fall (2000) Charlot S., Fall S. M., 2000, ApJ, 539, 718
- Charlot & Longhetti (2001) Charlot S., Longhetti M., 2001, MNRAS, 323, 887
- Christensen et al. (2012) Christensen L., Richard J., Hjorth J., Milvang-Jensen B., Laursen P., Limousin M., Dessauges-Zavadsky M., Grillo C., Ebeling H., 2012, MNRAS, 427, 1953
- Curtis-Lake et al. (2012) Curtis-Lake E., McLure R. J., Pearce H. J., Dunlop J. S., Cirasuolo M., Stark D. P., Almaini O., Bradshaw E. J., Chuter R., Foucaud S., Hartley W. G., 2012, MNRAS, 422, 1425
- da Cunha et al. (2008) da Cunha E., Charlot S., Elbaz D., 2008, MNRAS, 388, 1595
- Dijkstra et al. (2011) Dijkstra M., Mesinger A., Wyithe J. S. B., 2011, MNRAS, 414, 2139
- Dijkstra et al. (2014) Dijkstra M., Wyithe S., Haiman Z., Mesinger A., Pentericci L., 2014, MNRAS, 440, 3309
- Ellis et al. (2013) Ellis R. S., McLure R. J., Dunlop J. S., Robertson B. E., Ono Y., Schenker M. A., Koekemoer A., Bowler R. A. A., Ouchi M., Rogers A. B., Curtis-Lake E., Schneider E., Charlot S., Stark D. P., Furlanetto S. R., Cirasuolo M., 2013, ApJL, 763, L7
- Erb et al. (2010) Erb D. K., Pettini M., Shapley A. E., Steidel C. C., Law D. R., Reddy N. A., 2010, ApJ, 719, 1168
- Ferland et al. (2013) Ferland G. J., Porter R. L., van Hoof P. A. M., Williams R. J. R., Abel N. P., Lykins M. L., Shaw G., Henney W. J., Stancil P. C., 2013, Rev. Mexicana Astron. Astrofis., 49, 137
- Finkelstein et al. (2013) Finkelstein S. L., Papovich C., Dickinson M., Song M., Tilvi V., Koekemoer A. M., Finkelstein K. D., Mobasher B., Ferguson H. C., Giavalisco M., Reddy N., Ashby M. L. N., Dekel A., Fazio G. G., Fontana A., Grogin N. A., Huang J.-S., Kocevski D., Rafelski M., Weiner B. J., Willner S. P., 2013, Nature, 502, 524
- Hainline et al. (2009) Hainline K. N., Shapley A. E., Kornei K. A., Pettini M., Buckley-Geer E., Allam S. S., Tucker D. L., 2009, ApJ, 701, 52
- Hashimoto et al. (2013) Hashimoto T., Ouchi M., Shimasaku K., Ono Y., Nakajima K., Rauch M., Lee J., Okamura S., 2013, ApJ, 765, 70
- Iye et al. (2006) Iye M., Ota K., Kashikawa N., Furusawa H., Hashimoto T., Hattori T., Matsuda Y., Morokuma T., Ouchi M., Shimasaku K., 2006, Nature, 443, 186
- James et al. (2014) James B. L., Pettini M., Christensen L., Auger M. W., Becker G. D., King L. J., Quider A. M., Shapley A. E., Steidel C. C., 2014, MNRAS, 440, 1794
- Jensen et al. (2013) Jensen H., Laursen P., Mellema G., Iliev I. T., Sommer-Larsen J., Shapiro P. R., 2013, MNRAS, 428, 1366
- McLean et al. (2012) McLean I. S., Steidel C. C., Epps H. W., Konidaris N., Matthews K. Y., Adkins S., Aliado T., Brims G., Canfield J. M., Cromer J. L., Fucik J., Kulas K., Mace G., Magnone K., Rodriguez H., Rudie G., Trainor R., Wang E., Weber B., Weiss J., 2012, in Society of Photo-Optical Instrumentation Engineers (SPIE) Conference Series, Vol. 8446, Society of Photo-Optical Instrumentation Engineers (SPIE) Conference Series
- McLinden et al. (2011) McLinden E. M., Finkelstein S. L., Rhoads J. E., Malhotra S., Hibon P., Richardson M. L. A., Cresci G., Quirrenbach A., Pasquali A., Bian F., Fan X., Woodward C. E., 2011, ApJ, 730, 136
- McLure et al. (2013) McLure R. J., Dunlop J. S., Bowler R. A. A., Curtis-Lake E., Schenker M., Ellis R. S., Robertson B. E., Koekemoer A. M., Rogers A. B., Ono Y., Ouchi M., Charlot S., Wild V., Stark D. P., Furlanetto S. R., Cirasuolo M., Targett T. A., 2013, MNRAS, 432, 2696
- McQuinn et al. (2007) McQuinn M., Hernquist L., Zaldarriaga M., Dutta S., 2007, MNRAS, 381, 75
- Mesinger et al. (2014) Mesinger A., Aykutalp A., Vanzella E., Pentericci L., Ferrara A., Dijkstra M., 2014, ArXiv e-prints
- Mesinger & Furlanetto (2008) Mesinger A., Furlanetto S. R., 2008, MNRAS, 386, 1990
- Oke & Gunn (1983) Oke J. B., Gunn J. E., 1983, ApJ, 266, 713
- Ono et al. (2012) Ono Y., Ouchi M., Mobasher B., Dickinson M., Penner K., Shimasaku K., Weiner B. J., Kartaltepe J. S., Nakajima K., Nayyeri H., Stern D., Kashikawa N., Spinrad H., 2012, ApJ, 744, 83
- Ouchi et al. (2009) Ouchi M., Mobasher B., Shimasaku K., Ferguson H. C., Fall S. M., Ono Y., Kashikawa N., Morokuma T., Nakajima K., Okamura S., Dickinson M., Giavalisco M., Ohta K., 2009, ApJ, 706, 1136
- Ouchi et al. (2010) Ouchi M., Shimasaku K., Furusawa H., Saito T., Yoshida M., Akiyama M., Ono Y., Yamada T., Ota K., Kashikawa N., Iye M., Kodama T., Okamura S., Simpson C., Yoshida M., 2010, ApJ, 723, 869
- Pacifici et al. (2012) Pacifici C., Charlot S., Blaizot J., Brinchmann J., 2012, MNRAS, 421, 2002
- Pentericci et al. (2011) Pentericci L., Fontana A., Vanzella E., Castellano M., Grazian A., Dijkstra M., Boutsia K., Cristiani S., Dickinson M., Giallongo E., Giavalisco M., Maiolino R., Moorwood A., Paris D., Santini P., 2011, ApJ, 743, 132
- Pentericci et al. (2014) Pentericci L., Vanzella E., Fontana A., Castellano M., Treu T., Mesinger A., Dijkstra M., Grazian A., Bradac M., Cristiani S., Galametz A., Giavalisco M., Giallongo E., Maiolino R., Paris D., Santini P., 2014, ArXiv e-prints
- Richard et al. (2011) Richard J., Kneib J.-P., Ebeling H., Stark D. P., Egami E., Fiedler A. K., 2011, MNRAS, 414, L31
- Robertson et al. (2010) Robertson B. E., Ellis R. S., Dunlop J. S., McLure R. J., Stark D. P., 2010, Nature, 468, 49
- Robertson et al. (2013) Robertson B. E., Furlanetto S. R., Schneider E., Charlot S., Ellis R. S., Stark D. P., McLure R. J., Dunlop J. S., Koekemoer A., Schenker M. A., Ouchi M., Ono Y., Curtis-Lake E., Rogers A. B., Bowler R. A. A., Cirasuolo M., 2013, ApJ, 768, 71
- Rodriguez Espinosa et al. (2014) Rodriguez Espinosa J. M., Gonzalez-Martin O., Castro Rodriguez N., Perez-Gonzalez P. G., Mas-Hesse J. M., Munoz-Tunon C., Cava A., Cardiel N., Cabrera Lavers A., Gallego J., Hernan Caballero A., Herrera Ruiz N., 2014, ArXiv e-prints
- Schenker et al. (2013a) Schenker M. A., Ellis R. S., Konidaris N. P., Stark D. P., 2013a, ApJ, 777, 67
- Schenker et al. (2014) —, 2014, ArXiv e-prints
- Schenker et al. (2013b) Schenker M. A., Robertson B. E., Ellis R. S., Ono Y., McLure R. J., Dunlop J. S., Koekemoer A., Bowler R. A. A., Ouchi M., Curtis-Lake E., Rogers A. B., Schneider E., Charlot S., Stark D. P., Furlanetto S. R., Cirasuolo M., 2013b, ApJ, 768, 196
- Schenker et al. (2012) Schenker M. A., Stark D. P., Ellis R. S., Robertson B. E., Dunlop J. S., McLure R. J., Kneib J.-P., Richard J., 2012, ApJ, 744, 179
- Shapley et al. (2003) Shapley A. E., Steidel C. C., Pettini M., Adelberger K. L., 2003, ApJ, 588, 65
- Smit et al. (2014) Smit R., Bouwens R. J., Labbé I., Zheng W., Bradley L., Donahue M., Lemze D., Moustakas J., Umetsu K., Zitrin A., Coe D., Postman M., Gonzalez V., Bartelmann M., Benítez N., Broadhurst T., Ford H., Grillo C., Infante L., Jimenez-Teja Y., Jouvel S., Kelson D. D., Lahav O., Maoz D., Medezinski E., Melchior P., Meneghetti M., Merten J., Molino A., Moustakas L. A., Nonino M., Rosati P., Seitz S., 2014, ApJ, 784, 58
- Sobacchi & Mesinger (2014) Sobacchi E., Mesinger A., 2014, MNRAS, 440, 1662
- Stark et al. (2010) Stark D. P., Ellis R. S., Chiu K., Ouchi M., Bunker A., 2010, MNRAS, 408, 1628
- Stark et al. (2011) Stark D. P., Ellis R. S., Ouchi M., 2011, ApJL, 728, L2
- Stark et al. (2014) Stark D. P., Richard J., Siana B., Charlot S., Freeman W. R., Gutkin J., Wofford A., Robertson B., Amanullah R., Watson D., Milvang-Jensen B., 2014, accepted in MNRAS, arxiv:1408.1420
- Steidel et al. (2010) Steidel C. C., Erb D. K., Shapley A. E., Pettini M., Reddy N., Bogosavljević M., Rudie G. C., Rakic O., 2010, ApJ, 717, 289
- Tapken et al. (2007) Tapken C., Appenzeller I., Noll S., Richling S., Heidt J., Meinköhn E., Mehlert D., 2007, A&A, 467, 63
- Tilvi et al. (2014) Tilvi V., Papovich C., Finkelstein S. L., Long J., Song M., Dickinson M., Ferguson H., Koekemoer A. M., Giavalisco M., Mobasher B., 2014, ArXiv e-prints
- Treu et al. (2013) Treu T., Schmidt K. B., Trenti M., Bradley L. D., Stiavelli M., 2013, ApJL, 775, L29
- Vanzella et al. (2014) Vanzella E., Fontana A., Pentericci L., Castellano M., Grazian A., Giavalisco M., Nonino M., Cristiani S., Zamorani G., Vignali C., 2014, ArXiv e-prints
- Vanzella et al. (2011) Vanzella E., Pentericci L., Fontana A., Grazian A., Castellano M., Boutsia K., Cristiani S., Dickinson M., Gallozzi S., Giallongo E., Giavalisco M., Maiolino R., Moorwood A., Paris D., Santini P., 2011, ApJL, 730, L35
- Vernet et al. (2011) Vernet J., Dekker H., D’Odorico S., Kaper L., Kjaergaard P., Hammer F., Randich S., Zerbi F., Groot P. J., Hjorth J., Guinouard I., Navarro R., Adolfse T., Albers P. W., Amans J.-P., Andersen J. J., Andersen M. I., Binetruy P., Bristow P., Castillo R., Chemla F., Christensen L., Conconi P., Conzelmann R., Dam J., de Caprio V., de Ugarte Postigo A., Delabre B., di Marcantonio P., Downing M., Elswijk E., Finger G., Fischer G., Flores H., François P., Goldoni P., Guglielmi L., Haigron R., Hanenburg H., Hendriks I., Horrobin M., Horville D., Jessen N. C., Kerber F., Kern L., Kiekebusch M., Kleszcz P., Klougart J., Kragt J., Larsen H. H., Lizon J.-L., Lucuix C., Mainieri V., Manuputy R., Martayan C., Mason E., Mazzoleni R., Michaelsen N., Modigliani A., Moehler S., Møller P., Norup Sørensen A., Nørregaard P., Péroux C., Patat F., Pena E., Pragt J., Reinero C., Rigal F., Riva M., Roelfsema R., Royer F., Sacco G., Santin P., Schoenmaker T., Spano P., Sweers E., Ter Horst R., Tintori M., Tromp N., van Dael P., van der Vliet H., Venema L., Vidali M., Vinther J., Vola P., Winters R., Wistisen D., Wulterkens G., Zacchei A., 2011, A&A, 536, A105
- Zitrin et al. (2012) Zitrin A., Moustakas J., Bradley L., Coe D., Moustakas L. A., Postman M., Shu X., Zheng W., Benítez N., Bouwens R., Broadhurst T., Ford H., Host O., Jouvel S., Koekemoer A., Meneghetti M., Rosati P., Donahue M., Grillo C., Kelson D., Lemze D., Medezinski E., Molino A., Nonino M., Ogaz S., 2012, ApJL, 747, L9