Optical investigation of thermoelectric topological crystalline insulator Pb0.77Sn0.23Se
Abstract
Pb0.77Sn0.23Se is a novel alloy of two promising thermoelectric materials PbSe and SnSe that exhibits a temperature dependent band inversion below 300 K. Recent work has shown that this band inversion also coincides with a trivial to nontrivial topological phase transition. To understand how the properties critical to thermoelectric efficiency are affected by the band inversion, we measured the broadband optical response of Pb0.77Sn0.23Se as a function of temperature. We find clear optical evidence of the band inversion at K, and use the extended Drude model to accurately determine a dependence of the bulk carrier lifetime, associated with electron-acoustic phonon scattering. Due to the high bulk carrier doping level, no discriminating signatures of the topological surface states are found, although their presence cannot be excluded from our data.
I Introduction
Thermoelectrics are a subject of great interest to industry for their many applications as macro and micro-scale Peltier coolers, their waste-heat energy recycling potential (heat-to-electricity conversion) in industrial and consumer products, and their application as highly sensitive compact and robust sensors.Zebarjadi et al. (2012); Riffat and Ma (2003); Snyder and Toberer (2008); DiSalvo (1999); Heremans Font (2006) An academic interest has also persisted as the optimization of thermoelectric efficiency offers an intriguing challenge in which ostensibly mutually exclusive physical properties must be combined in one material for the greatest performance. This is illustrated by the figure of merit , where , , and are the Seebeck coefficient, the DC conductivity, and the thermal conductivity, respectively. For high thermoelectric efficiency, and must therefore be simultaneously enhanced, while is deliberately suppressed. This is a nontrivial task, considering the intimate link between the parameters that define . For example, both and depend on the carrier lifetime , while both and are a function of the band dispersion. Hence, the improvement of each individual quantity could result in an overall decrease of , thus making experimental techniques that can disentangle the common limitations of each quantity highly desirable.
Currently, the primary methods of studying thermoelectrics are by DC transport, optics, thermopower experiments and neutron scattering,Liang et al. (2013); Delaire et al. (2011); Dixon and Hoff (1971); Strauss (1967); Baleva et al. (1990); Gibbs et al. (2013a); Ekuma et al. (2012); Zhao et al. (2014a); Ferreira et al. (1999); Gibbs et al. (2013b) where the standard Drude model is often employed to extract temperature dependent information about carrier lifetimes. A major shortcoming of the Drude model, however, is the assumption that the carrier lifetime is frequency independent. When analyzing optical data, this often results in poor quality Drude fits, and carrier scattering rates with large uncertainties. A solution to this shortcoming is the application of the extended Drude analysis to a sample’s optical response.Qazilbash et al. (2009) While commonplace in the optical investigation of strongly correlated systems,Basov and Timusk (2005); Qazilbash et al. (2009); Basov et al. (2011); Nagel et al. (2012); Hwang et al. (2007) the extended Drude model offers some benefits previously unexplored in the context of thermoelectrics. Using this approach grants access not only to the temperature dependence of the carrier lifetime, but also to its frequency dependence, shedding light on the various scattering mechanisms that govern and . Moreover, with both high temperature and energy resolution,Mirzaei et al. (2013) broadband (far infrared through visible) optical spectroscopy provides direct access to the free carrier plasma frequency and band mass, both affecting and , as well as spectral weight transfers and band transitions, useful for studying band gaps and band inversions.
To illustrate the versatility of this approach we’ve performed our measurements on Pb0.77Sn0.23Se, a compound combining the thermoelectric characteristics of its thoroughly studied binary constituents PbSe and SnSeShukla et al. (2007); Ekuma et al. (2012); Gibbs et al. (2013a); Baleva et al. (1990); Strauss (1967); Zhao et al. (2014b); Anand et al. (2014) However, unlike its constituents, previous works on Pb0.77Sn0.23Se crystals have shown evidence of a temperature dependent band inversion, although neither the exact transition temperature, nor the temperature dependence of the gap has been identified conclusively. This is largely a result of limited energy and temperature resolution of the experimental probes that were used, with various reports ranging between 80 K and 200 K. Dixon and Hoff (1971); Dziawa et al. (2012); Wojek et al. (2013); Strauss (1967); Liang et al. (2013); Xi et al. (2014) Hence, broadband optical spectroscopy provides a unique opportunity to study, in a very controlled manner, how carrier dynamics change throughout the inversion. Moreover, many traditional thermoelectric probes, such as transport and Seebeck measurements, rely on band structure models to extract the scattering rate. Such band structure assumptions are severely complicated by the band inversion, further motivating the investigation of Pb0.77Sn0.23Se by optical spectroscopy as features of the band inversion and the carrier lifetime can be measured independently in a single experiment. This discriminating quality becomes even more evident by considering previous transport studies of the Pb1-xSnxSe system. While Pb1-xSnxSe alloys have been studied for 50 years,Butler et al. (1966) only specially prepared low-carrier extrinsic p-type Pb0.77Sn0.23Se was found to show abrupt changes in the DC transport properties across the band inversion.Dixon and Hoff (1971) Interestingly, as-grown n-type crystals showed no clear signatures of the band inversion at all. A recent paper by Liang et al. highlighted this peculiarity and was the first to show evidence of the band inversion in n-type Pb0.77Sn0.23Se, employing Nernst and thermopower experiments.Liang et al. (2013) Particularly for device applications, a thorough understanding of the electronic properties of both n and p-type crystals is pivotal.Anand et al. (2014)
The temperature dependent band inversion of Pb0.77Sn0.23Se has also received significant attention from the topological insulator community. It was recently shown that while PbSe is a trivial insulator, SnSe is a topological crystalline insulator (TCI); a state of matter in which crystal point group symmetry protects the persistence of gapless surface states with a spin polarized Dirac dispersion.Fu (2011); Xu et al. (2012); Dziawa et al. (2012); Xi et al. (2014) Interestingly, in Pb0.77Sn0.23Se we have the unique opportunity to tune between topological and trivial phases by temperature, rather than doping, thus negating the effects of disorder. Moreover, since it is challenging to perform ARPES and STM (the primary methods of studying surface states) at various temperatures, temperature dependent broadband spectroscopy makes a great tool for the investigation of surface states in topological (crystalline) insulators.Reijnders et al. (2014); Valdés Aguilar et al. (2012); Jenkins et al. (2013); Di Pietro et al. (2013); Chapler et al. (2014); Wu et al. (2013); Li and Carbotte (2013); Xi et al. (2013); Tran et al. (2014); Xi et al. (2014); Anand et al. (2014) We note that since band gaps are typically tuned by electron-phonon coupling and anharmonicity, the concurrent band inversion and topological phase transition hints at a more subtle process. Hence, Pb0.77Sn0.23Se can reveal new insights into how anharmonicity, electron-phonon coupling and topology all interplay.
In the present work, we measure the temperature dependent broadband reflectance of Pb0.77Sn0.23Se between 5 K - 292 K, and extract its optical conductivity and dielectric function between 6 meV - 6 eV. Subsequent extended Drude analysis reveals the frequency dependent free carrier scattering rate, and is used for a precise determination of the dominant temperature dependent scattering mechanism. We find clear optical evidence of the band inversion temperature at K, by studying the free carrier plasma frequency and direct optical band gap transitions. Interestingly, the temperature dependent free carrier scattering rate shows no signatures of the band inversion, and follows behaviour in accordance with electron-acoustic phonon scattering. Finally, we find that the Fermi level lies deep in the conduction band ( meV), obscuring the observation of surface states,Reijnders et al. (2014); Di Pietro et al. (2012); LaForge et al. (2010); Akrap et al. (2012) and causing the Seebeck coefficient and power factor to be insensitive to the band inversion.
II Experiment
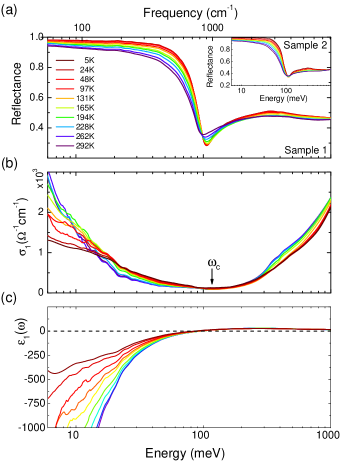
Pb0.77Sn0.23Se samples were grown at Princeton University.Liang et al. (2013) Prior to the reflectance measurements, samples were freshly cleaved with a razor blade to produce a lustrous surface. Cleaving by tape was also attempted, but proved unsuccessful in producing high quality surfaces. Temperature dependent reflectance measurements were performed in near-normal geometry between 6 meV - 1.5 eV, using a modified Bruker VERTEX 80v and ARS continuous flow cryostat, described in detail elsewhereReijnders et al. (2014) (Fig. 1a). Reflectance data below 12 meV were corroborated by repeating the measurements using synchrotron radiation and a custom designed sample chamber with a closed cycle Cryomech cryostat at the AILES Beamline of the SOLEIL synchrotron in France. All infrared data were complemented by partially overlapping room temperature ellipsometry measurements between 0.75 meV - 6 eV.
Using RefFit, a simultaneous variational dielectric fit (VDF) of Reflectance and ellipsometry data yielded all Kramers-Kronig consistent optical constants. All measurements were performed on two different crystals from the same sample batch, showing excellent qualitative resemblance (see inset Fig. 1a for the reflectance of sample 2). Hence, data from only one crystal are discussed.
III Results and Analysis
Fig. 1b shows the real part of the optical conductivity of Pb0.77Sn0.23Se in the far and mid infrared. The spectra are dominated by a distinct Drude peak below 125 meV, associated with free carrier conductivity, and separated by a cut-off frequency from the interband transitions above 125 meV.
The simplest approach to understanding the spectral range below is to apply the semi-classical Drude model, in which the complex dielectric function for the free carrier response is given by
| (1) |
where is the bare plasma frequency, is the transport lifetime, and captures all contributions to the dielectric function other than the Drude conductivity (i.e. interband transitions and polarizability of the static background). The bare plasma frequency is defined as , where is the carrier density and is the band mass.
An immediate consequence of this model is the large, low frequency negative contribution to the real part of the dielectric function () due to the free carrier response. Indeed from eq. 1 it can be seen that in the limit the zero-crossing of corresponds to the screened plasma frequency , which is related to the bare plasma frequency through . Hence, we expect to observe this zero-crossing in , which can be seen directly in 1c. The temperature dependence of both and are discussed next.
Before analyzing the spectra in detail, it is useful to consider what we expect to observe as a result of the band inversion. For compounds in which the chemical potential is located in the bulk gap, a distinct signature of a band inversion would be the spectral weight redistribution from interband transitions to the Drude conductivity. As the gap closes, the onset frequency of the interband transitions (roughly in Fig. 1c) moves to lower energy, until it merges with the Drude when the gap size reduces to zero. However, since stoichiometric Pb0.77Sn0.23Se is naturally n-type (chemical potential in the conduction band, shown in Fig. 2a), we do not expect to observe such obvious behaviour, and therefore perform a more sophisticated analysis to observe the band inversion.
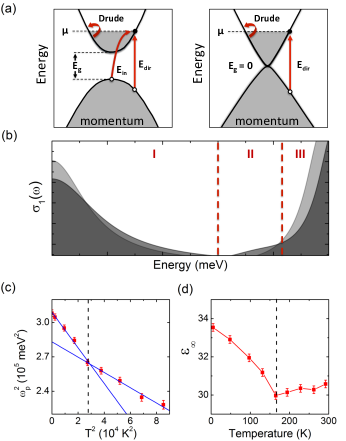
Fig. 2b illustrates how the band inversion could be deduced from signatures in . Region I is dominated by free carrier behaviour, described by eqn. 1. Hence, as the band dispersion transforms across the band inversion (Fig. 2a), changes in both and can result in an unusual temperature dependence of the plasma frequency (where spectral weight in ). One might also expect the inversion driven changes in the electronic structure to be reflected in the carrier lifetime. This can be seen from the width of the Lorentzian features (centred at 0), while deviations from the Lorentzian lineshape indicate an energy dependent lifetime. Region III can be used to extract the magnitude of the direct gap transitions shown in Fig. 2a. With the chemical potential () in the conduction band, the smallest allowed is offset from the conduction band minimum. Hence, changes in the band dispersion as well as are likely to affect , resulting in a shift of the interband transition onset in , as shown in Fig. 2b. Since is a measure of the spectral weight in above the free carriers, this quantity too should reveal signatures of the band inversion, similar to . Finally, below , region II is sensitive to temperature dependent changes in indirect gap transitions , where , as well as impurity scattering responsible for an extended onset (known as an Urbach tailGrein and John (1989)).
III.1 Bulk plasma frequency and
The spectral weight of the Drude feature (area under ) is a direct measure of the bare plasma frequency squared, , and was determined by integrating up to a cut-off point using
| (2) |
where separates the Drude contribution to from the interband transitions (as indicated in Fig. 1b).Hwang et al. (2007) The bare plasma frequency was then used to extract from the zero-crossing in . We note that an alternative method to find (which does not rely on the zero-crossing and is described elsewhereHwang et al. (2007)) was also used, and resulted in similar temperature dependent values differing only by a constant offset of a few percent.
The temperature dependence of and are shown in Fig. 2c and 2d, respectively. Starting with , we find a reduction as temperature increases, with a distinct discontinuity in the trend around 160 K. In general, a temperature dependent reduction in is an expected result that can be understood as follows. While semi-classically we have , quantum mechanically the squared plasma frequency calculated using eqn. 2 corresponds to an integration of the density of states () multiplied by the Fermi function (), so that .Benfatto et al. (2005); Carbone et al. (2006) Evaluating this integral using the Sommerfeld expansion yields a temperature independent term equal to at 0 K, and a negative term as a result of thermal smearing of the Fermi function. Hence, the temperature dependence of the squared plasma frequency is expected to follow
| (3) |
where depends on at the Fermi energy.Benfatto et al. (2005); Ortolani et al. (2005); Carbone et al. (2006) Interestingly, while a linear decline in vs is expected, Fig. 2c shows two distinct regimes in its temperature dependence below and above K. Since is a function of the density of states, this is a clear signature of an abrupt change in the band dispersion, associated with the band inversion. Indeed, this critical temperature falls within the 80 K - 200 K temperature range over which the band inversion was previously observed.Dixon and Hoff (1971); Dziawa et al. (2012); Wojek et al. (2013); Gyenis et al. (2013); Strauss (1967); Liang et al. (2013) This also provides a first indication that despite the Fermi level of n-type Pb0.77Sn0.23Se not being in the gap, discontinuities in its optical properties are a useful probe in the exact determination of its band inversion temperature.
Besides clear signatures of the band inversion in , we also expect to see a change in at K. Since is a measure of the spectral weight of all interband transitions, it is sensitive to temperature dependent changes in the band structure.Kuzmenko et al. (2007) This is confirmed by (Fig. 2d), revealing a clear change in the temperature dependence around 160 K, and will be discussed in greater in section III.3.
III.2 Surface States
Besides the Seebeck sensitivity to the band inversion at K, this critical temperature is also relevant to the topological phase of Pb0.77Sn0.23Se. Previous studies have shown how the band inversion is accompanied by a topological phase transition, where at low temperature topologically protected surface states persist in the bulk band gap.Fu (2011); Dziawa et al. (2012); Wojek et al. (2013); Gyenis et al. (2013); Okada et al. (2013); Liang et al. (2013) In our optical data below 160 K (Fig.1a) we see no evidence of Dirac surface states, such as previously observed in topological insulators Bi2Te2Se, Bi2Se3, and (Bi,Sb)2Te3Reijnders et al. (2014); Valdés Aguilar et al. (2012); Jenkins et al. (2013); Di Pietro et al. (2013); Chapler et al. (2014); Wu et al. (2013) This is not surprising since we find a bulk chemical potential of meV above the conduction band minimum at 5 K (shown later), consistent with previous studies of Pb1-xSnxSe with similar stoichiometryDziawa et al. (2012); Gyenis et al. (2013); Liang et al. (2013); Wojek et al. (2013) Such a high bulk causes bulk conductance to dominate the optical properties, which can by understood by considering how the measured reflectance relates to the complex dielectric function, as . From Fig. 1c and eqn. 1 it is clear that for all frequencies , resulting in over the full far infrared (FIR) range for most temperatures. Such high FIR reflectance even above the topological phase transitions obscures discriminating surface conductance signatures from the bulk conductivity in . Moreover, with the Fermi level so high in the conduction band, mixing of the surface and bulk bands also blurs other distinguishing features such as the bulk vs surface carrier lifetime. However, to ensure we did not overlook surface state signatures in our reflectance data, we used the Boltzmann transport equation to estimate their expected effect on the measured reflectance. Indeed, the surface state signatures are far below our detection sensitivity, as described in the Appendix, and crystals with a lower bulk carrier concentration are required for further optical investigations of the topological crystalline surface state properties of Pb0.77Sn0.23Se.
III.3 Interband transitions
To study how the bulk electronic structure is affected by the band inversion, we turn to the band gap transitions that are visible above in Fig. 1b. With ARPES measurements showing in the conduction band for crystals with identical stoichiometry,Dziawa et al. (2012); Wojek et al. (2013); Gyenis et al. (2013) the smallest allowed direct gap transition exceeds the direct bandgap (and thus takes place away from the Brillouin Zone centre), as illustrated in Fig. 2a. This effect is known as the Burstein-Moss shift.Yu and Cardona (2010); Gibbs et al. (2013a) Assuming a parabolic dispersion for both the conduction and valence band, the energy of this transition can be estimated. By adding to the direct band gap energy , and to the energy of the valence band electron with respect to valence band maximum of , the total transition energy at zero energy is given by
| (4) |
The magnitude of can be obtained from a linear fit of the squared absorption coefficient, where , as shown in Fig. 3a.Yu and Cardona (2010) The temperature dependence of is shown in Fig. 3b, where a clear maximum of meV is observed around 160 K. A previous study of the doping dependent band inversion in the Pb1-xSnxTe system also found a change in sign of as the bands invert.Ferreira et al. (1999) Interestingly, for composition Pb0.44Sn0.56Te, in which a temperature dependent inversion takes place, a minimum in is observed at the inversion temperature, in contrast to our maximum. Since the direct gap is zero at K, eqn. 4 suggests that this maximum is either due to an increase in , or a change in across the transition. Both scenarios are plausible, and require further study specifically addressing the temperature dependent band mass and .
We find a minimum direct transition of 280 meV at 5 K, which is larger than the low temperature direct transition of 200-250 meV shown by previous ARPES results.Dziawa et al. (2012); Wojek et al. (2013); Gyenis et al. (2013) This difference is expected considering our larger carrier density compared to previous reports, as we show later in section DC Transport. We also note that the sensitivity to surface states in ARPES conceals bulk signatures, complicating the estimation of bulk transition energies.
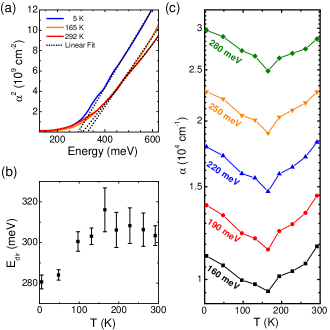
We now consider the spectral weight below the direct transition energy . This is often explained as an Urbach tail, which results from disorder in the crystal, and has an exponential energy dependence that changes monotonically with temperature.Grein and John (1989); Gibbs et al. (2013a) While Fig. 3a does show exponential behaviour below ( meV), a closer look at at various frequencies in Fig. 3c reveals atypical Urbach behavior. Instead of a monotonic temperature dependent change of the exponential behaviour, a distinct minimum is observed at the 160 K band inversion temperature, while at both lower and higher temperatures the spectral weight in the absorption coefficient increases. Although it is not surprising that transitions below the direct gap are sensitive to the band inversion, the exact details of their temperature dependence are not clear and require future theory/experiment. Nonetheless, this shows that the absorption/optical conductivity alone could be used to detect the transition.
III.4 Extended Drude analysis and scattering rate
To study the bulk carrier lifetime in Pb0.77Sn0.23Se, we now turn to the extended Drude model. From eqn. 1, it can be seen that the free carrier response in the standard Drude model is fully defined by , , and , where is the static transport lifetime resulting from a sum of all scattering processes according to Matthiessen’s rule (including impurity, electron-phonon and electron-electron scattering).Singleton (2010) While the Drude model is frequently used to study scattering mechanisms that can be distinguished by their temperature dependence, the temperature dependent band inversion in Pb0.77Sn0.23Se severely complicates such analysis. Moreover, the standard Drude model does not consider the energy dependence of the lifetime . Since the carrier lifetime is an important parameter for thermoelectric efficiencyJonson and Mahan (1980) we turn to the extended Drude model, in which the lifetime has an energy dependence given byQazilbash et al. (2009)
| (5) |
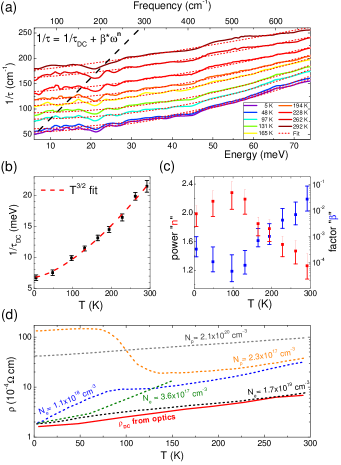
Fig. 4 shows the frequency dependent scattering rate obtained using eqn. 5. The black line shows where , below which the quasiparticle transport is considered to be coherent.Qazilbash et al. (2009) To study the nature of the dominant scattering mechanism, the data were fitted (red dotted lines in Fig. 4a) using the empirical relation
| (6) |
where . Here, accounts for impurity scattering, and and are constants that depends on material properties. When , and for certain values of , eqn. 6 resembles the single-particle scattering rate within Fermi Liquid theory, in which electron-electron scattering dominates the transport properties. Nagel et al. (2012)
Fig. 4b shows , obtained from the fits with eqn. 6. As the temperature is raised, behavior is observed (dashed red line), associated with electron-acoustic phonon scattering in semiconductors.Yu and Cardona (2010); Singleton (2010) This is consistent with most good thermoelectrics, in which electron-acoustic phonon scattering dominates the transport properties.Pei et al. (2011); Delaire et al. (2011); Wang et al. (2011); Ravich et al. (1971) Perhaps somewhat unexpected, however, is that the band inversion appears to have no bearing on .
This is contrasted by recent work by L. Wu et al.,Wu et al. (2013) in which the scattering rate of carriers in (Bi1-xInx)2Se3 was found to diverge going across the topological phase transition as a function of doping.
We note that since we are most sensitive to bulk carriers (with high in the conduction band) we don’t expect to see such a divergence, but it is worth emphasizing that more resistive Pb1-xSnxSe samples (in which the surface contributions are enhanced) may exhibit similar behaviour. For such samples, the frequency dependent scattering rate may also serve as a novel analytical technique to discriminate surface states from the bulk. Since surface states are protected from backscattering, their lifetimes are expected to exceed the bulk carrier lifetime. This could result in distinct surface and bulk scattering contributions in , for which we see no evidence in our samples. From fitting , we also find a constant meV, attributed to impurity scattering. We note that in metals and degenerate semiconductors such as as-grown Pb0.77Sn0.23Se, the electronic impurity scattering rate is roughly equal to the thermal impurity scattering lifetime .Singleton (2010)
Fig. 4c shows the temperature dependence of fitting parameters and . Since we were only able to obtain reliable data over a limited range spanning just one decade in energy (as seen in Fig. 4a), we hesitate to attribute much physical meaning to either parameter. Additional measurements at lower frequencies and temperatures beyond the scope of this work, or detailed studies by alternative probes such as high resolution temperature dependent ARPES could offer greater insights. Nevertheless, a considerable discontinuity in both and at 160 K, which does not fall within our error bars, does suggest that the frequency dependent scattering rate is tied to the band inversion. Moreover, with normally associated with Fermi liquid type electron-electron dominated scattering,Nagel et al. (2012) this high value of is quite surprising considering the relatively high temperatures and frequencies up to which this behavior persists, making it an interesting starting point for followup studies.
III.5 DC Transport
For comparison with previous transport studies of Pb0.77Sn0.23Se, we calculate its DC conductivity using and find cm-1 at 5 K. This low temperature value is in good agreement with previous transport results of n-type samples with identical stoichiometry ( cm-1 by Dixon et al.Dixon and Hoff (1971) and cm-1 by Liang et al.Liang et al. (2013)). A comparison of the resistivity with previously published data is shown in Fig. 4d, where the dashed lines are digitized data from Liang et al.Liang et al. (2013) (green) and Dixon et al.Dixon and Hoff (1971) (all other colors). We note that all n-type crystals increase in resistance with temperature, typical for metals and degenerate semiconductors. Only the resistivity of a low carrier p-type sample measured by Dixon et al.Dixon and Hoff (1971) shows an anomaly between 75 K and 200 K, possibly associated with the band inversion temperature, while none of the n-type curves reveal such signatures. This further illustrates the utility of optical spectroscopy, which can simultaneously determine and to find , while also measuring EF (via direct transitions) and the inversion temperature.
A possible explanation for the difference between n-type and p-type resistivity behavior is the asymmetry of the conduction and valance band, which can be tested by comparing their respective band masses. Using the carrier density of cm-3 (from the resistivity curve most similar to our our results), we find a mobility of cm2 V-1 s-1, and a band mass of me, using . This band mass is smaller than the value of 0.1me found by Dixon et al. for p-type Pb0.77Sn0.23Se, thus confirming the asymmetry between conduction and valence band. Using eqn. 4 we can now estimate the value of (), using the low temperature direct gap value of E meV, consistent with previous studies and calculations.Strauss (1967); Dziawa et al. (2012); Wojek et al. (2013) We find a value for of meV. To further corroborate this value, we derive an expression for EF using the parabolic band approximation. Starting with E, and substituting the 3D carrier density , we get
| (7) |
where and are the bulk spin and valley degeneracy, respectively.Dziawa et al. (2012); Liang et al. (2013) Substituting the plasma frequency in SI units into eqn. 7, where , we find an expression for EF in [eV] as a function of physical constants, in [rad/s] and in [m-3]:
| (8) |
Eqn. 8 yields a value for EF () of 126 meV at 5 K, which is consistent with our value of of meV obtained from the direct gap transitions (see section. III.3), and further confirms the metallic character of naturally doped n-type Pb0.77Sn0.23Se. As explained in Section III.2, this further confirms why surface states are not observed in the Reflectance spectra.
III.6 Power Factor
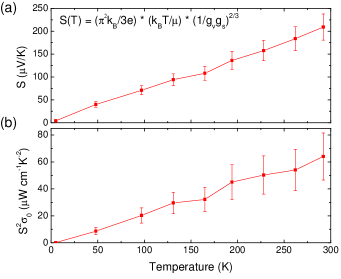
Finally, we relate our obtained values for and to the Seebeck coefficient and the power factor . In the parabolic band approximation, the Seebeck coefficient is given bySnyder and Toberer (2008) (where is the conduction of valance band mass), which can be expressed as a function of (using eqn. 7) as
| (9) |
Since is located high in the conduction band, the direct gap transitions are likely only minimally sensitive to changes in the true band gap (and thus ) as a function of temperature. This is illustrated in the left and right panel in Fig. 2a, showing a similar band dispersion for high despite a dramatic change in the band gap. Hence, we can estimate the maximum change in by attributing the temperature dependence of (see eqn. 4) entirely to changes in . The result of this estimation, after substituting for in eqn. 9, is plotted in Fig. 5a, while Fig. 5b shows the associated power factor . It is clear that neither nor show distinct signatures of the band inversion at K. These results suggests that there is room for optimization of the figure of merit in Pb1-xSnxSe compounds where is located deep in the conduction band. Further doping to alter the lattice and suppress phonon contributions will likely only affect the electronic response minimally, as illustrated by its insensitivity to the band inversion and the unaffected power factor.
IV Conclusion
In conclusion, we have performed broadband optical spectroscopy experiments on as-grown n-type Pb0.77Sn0.23Se and extracted its optical constants over a temperature range between 5 K and 293 K. By studying the plasma frequency and band gap transitions, we find clear signatures of the temperature dependent band inversion at K, despite the chemical potential being far in the conduction band. We note that since temperature is an easily controllable variable in optical spectroscopy, in principle this could be used to optically determine band inversion temperatures of conductive samples with extremely high precision. While this band inversion is also associated with a topological phase transition,Fu (2011); Dziawa et al. (2012); Wojek et al. (2013); Gyenis et al. (2013); Okada et al. (2013); Liang et al. (2013); Xi et al. (2014) we do not see any signatures of surface states, and thus don’t comment on the topology of the band structure on either side of the band inversion. This is an expected result, however, as optical modelling suggests that the highly conductive bulk carriers dominate the properties of as-grown Pb0.77Sn0.23Se.
By performing extended Drude analysis, we accurately determine the temperature dependent scattering rate, and find that it follows behaviour (associated with electron-acoustic phonon interactions) typical for good thermoelectrics,Pei et al. (2011) superimposed on a constant impurity scattering background with meV. The frequency dependence of the scattering rate shows no evidence of different scattering channels below and above the band inversion, but data over a greater energy and temperature range are required for more conclusive results. Moreover, neither the DC resistivity, Seebeck coefficient, or the power factor show any evidence of the band inversion. This result confirms earlier transport studies on similar compounds, Shukla et al. (2007); Ekuma et al. (2012); Gibbs et al. (2013a); Baleva et al. (1990); Strauss (1967); Zhao et al. (2014b); Butler et al. (1966) and emphasizes the utility of optical spectroscopy in the study of thermoelectrics and/or band inversions.
For application of Pb0.77Sn0.23Se as either a topological crystalline insulator or thermoelectric, the high electrical conductivity of bulk states is a major prohibitive factor. Moreover, some of the fundamental physics governing the electronic, thermal, and topological properties are difficult to probe due to the high chemical potential in as-grown Pb0.77Sn0.23Se. Hence, future studies on samples in the Pb1-xSnxSe series, in which the carrier density has been reduced, could lead to new insights into the interplay of phonons, thermal and electronic bulk lifetimes, and the optical and electronic properties of inversion symmetry protected topological surface states.
A reduction of the chemical potential would also enhance the sensitivity of the Seebeck coefficient to the band inversion, which could potentially result in a dramatic enhancement of the figure of merit around the band inversion. Moreover, alternative stoichiometries also offer an interesting avenue, as previous measurements suggest that the band inversion in Pb1-xSnxSe could be pushed to higher temperatures -relevant to many thermoelectric applications- by increasing the Sn content.Dziawa et al. (2012); Strauss (1967); Dixon and Hoff (1971) Hence, by optimizing Se doping, an ideal Pb1-xSnxSe stoichiometry can be determined, in which peaks around a desired temperature range. Indeed, such doping studies would also allow for the study of the high temperature interplay between the topologically nontrivial phase and thermoelectric efficiency, which is a direction currently unexplored.
With both thermoelectrics and topological (crystalline) insulators offering numerous appealing applications in industry, while presenting nontrivial physical characterization and optimization challenges, a better understanding of fundamental physics governing the figure of merit and the isolation of surface conductance are both of practical and fundamental interest. The Pb1-xSnxSe and Pb1-xSnxTe series offer many exciting opportunities in this pursuit, particularly through optical investigations, by combining several novel physical phenomena into a single temperature tuneable system.
V Acknowledgements
We acknowledge Young-June Kim for use of an ellipsometer, as well as Luke Sandilands for very helpful discussions. This work has been partially funded by the Ontario Research Fund, the Natural Sciences and Engineering Research council of Canada, Canada Foundation for Innovation, and the Prins Bernhard Cultuurfonds. The crystal growth at Princeton University was supported by grant N6601-11-1-4110.
We also acknowledge the recent optical and Hall-effect study of Pb0.77Sn0.23Se by Anand et al.,Anand et al. (2014) which was performed simultaneously, though independently. This study explores the temperature-driven band inversion of p-type Pb0.77Sn0.23Se, which is found to occur around 100 K.
References
- Zebarjadi et al. (2012) M. Zebarjadi, K. Esfarjani, M. S. Dresselhaus, Z. F. Ren, and G. Chen, Energy & Environmental Science 5, 5147 (2012).
- Riffat and Ma (2003) S. B. Riffat and X. Ma, Applied Thermal Engineering 23, 913 (2003).
- Snyder and Toberer (2008) G. J. Snyder and E. S. Toberer, Nature Materials 7, 105 (2008).
- DiSalvo (1999) F. J. DiSalvo, Science 285, 703 (1999).
- Heremans Font (2006) J. P. Heremans Font, Acta Physica Polonica A 108, 609 (2006).
- Liang et al. (2013) T. Liang, Q. Gibson, J. Xiong, M. Hirschberger, S. P. Koduvayur, R. J. Cava, and N. P. Ong, Nature Communications 4, 2696 (2013).
- Delaire et al. (2011) O. Delaire, J. Ma, K. Marty, A. F. May, M. A. McGuire, M.-H. Du, D. J. Singh, A. Podlesnyak, G. Ehlers, M. D. Lumsden, and B. C. Sales, Nature Materials 10, 614 (2011).
- Dixon and Hoff (1971) J. R. Dixon and G. F. Hoff, Physical Review B 3, 4299 (1971).
- Strauss (1967) A. J. Strauss, Physical Review 157, 608 (1967).
- Baleva et al. (1990) M. Baleva, T. Georgiev, and G. Lashkarev, Journal of Physics: Condensed Matter 2, 2935 (1990).
- Gibbs et al. (2013a) Z. M. Gibbs, A. LaLonde, and G. J. Snyder, New Journal of Physics 15, 075020 (2013a).
- Ekuma et al. (2012) C. E. Ekuma, D. J. Singh, J. Moreno, and M. Jarrell, Physical Review B 85, 085205 (2012).
- Zhao et al. (2014a) J. Zhao, C. D. Malliakas, D. Bugaris, N. Appathurai, V. Karlapati, D. Y. Chung, M. G. Kanatzidis, and U. Chatterjee, arXiv (2014a), 1404.1807v1 .
- Ferreira et al. (1999) S. O. Ferreira, E. Abramof, P. Motisuke, P. H. O. Rappl, H. Closs, A. Y. Ueta, C. Boschetti, and I. N. Bandeira, Brazilian Journal of Physics 29, 771 (1999).
- Gibbs et al. (2013b) Z. M. Gibbs, H. Kim, H. Wang, R. L. White, F. Drymiotis, M. Kaviany, and G. Jeffrey Snyder, Applied Physics Letters 103, 2109 (2013b).
- Qazilbash et al. (2009) M. M. Qazilbash, J. J. Hamlin, R. E. Baumbach, L. Zhang, D. J. Singh, M. B. Maple, and D. N. Basov, Nature Physics 5, 647 (2009).
- Basov and Timusk (2005) D. N. Basov and T. Timusk, Reviews of Modern Physics 77, 721 (2005).
- Basov et al. (2011) D. Basov, R. Averitt, D. van der Marel, M. Dressel, and K. Haule, Reviews of Modern Physics 83, 471 (2011).
- Nagel et al. (2012) U. Nagel, T. Uleksin, T. Room, R. P. S. M. Lobo, P. Lejay, C. C. Homes, J. S. Hall, A. W. Kinross, S. K. Purdy, T. Munsie, T. J. Williams, G. M. Luke, and T. Timusk, Proceedings of the National Academy of Sciences 109, 19161 (2012).
- Hwang et al. (2007) J. Hwang, T. Timusk, and G. D. Gu, Journal of Physics: Condensed Matter 19, 5208 (2007).
- Mirzaei et al. (2013) S. I. Mirzaei, D. Stricker, J. N. Hancock, C. Berthod, A. Georges, E. Van Heumen, M. K. Chan, X. Zhao, Y. Li, M. Greven, and D. van der Marel, Proceedings of the National Academy of Sciences 110, 5774 (2013).
- Shukla et al. (2007) R. K. Shukla, S. K. Shukla, V. K. Pandey, and P. Awasthi, Physics and Chemistry of Liquids 45, 169 (2007).
- Zhao et al. (2014b) L.-D. Zhao, S.-H. Lo, Y. Zhang, H. Sun, G. Tan, C. Uher, C. Wolverton, V. P. Dravid, and M. G. Kanatzidis, Nature 508, 373 (2014b).
- Anand et al. (2014) N. Anand, S. Buvaev, A. F. Hebard, D. B. Tanner, Z. Chen, Z. Li, K. Choudhary, A. B. Sinnott, G. Gu, and C. Martin, arXiv , 1407.5726 (2014).
- Dziawa et al. (2012) P. Dziawa, B. J. Kowalski, K. Dybko, R. Buczko, A. Szczerbakow, M. Szot, E. Łusakowska, T. Balasubramanian, B. M. Wojek, M. H. Berntsen, O. Tjernberg, and T. Story, Nature Materials 11, 1023 (2012).
- Wojek et al. (2013) B. M. Wojek, R. Buczko, S. Safaei, P. Dziawa, B. J. Kowalski, M. H. Berntsen, T. Balasubramanian, M. Leandersson, A. Szczerbakow, and P. Kacman, Physical Review B 87, 115106 (2013).
- Xi et al. (2014) X. Xi, X.-G. He, F. Guan, Z. Liu, R. D. Zhong, J. A. Schneeloch, T. S. Liu, G. D. Gu, D. Xu, Z. Chen, X. G. Hong, W. Ku, and G. L. Carr, arXiv , 1406.1726 (2014).
- Butler et al. (1966) J. F. Butler, A. R. Calawa, and T. C. Harman, Applied Physics Letters 9, 427 (1966).
- Fu (2011) L. Fu, Physical Review Letters 106, 106802 (2011).
- Xu et al. (2012) S.-Y. Xu, C. Liu, N. Alidoust, M. Neupane, D. Qian, I. Belopolski, J. D. Denlinger, Y. J. Wang, H. Lin, and L. A. Wray, Nature Communications 3, 1192 (2012).
- Reijnders et al. (2014) A. Reijnders, Y. Tian, L. J. Sandilands, G. Pohl, I. D. Kivlichan, S. Y. Frank Zhao, S. Jia, M. E. Charles, R. J. Cava, N. Alidoust, S. Xu, M. Neupane, M. Z. Hasan, X. Wang, S. W. Cheong, and K. S. Burch, Physical Review B 89, 075138 (2014).
- Valdés Aguilar et al. (2012) R. Valdés Aguilar, A. V. Stier, W. Liu, L. S. Bilbro, D. K. George, N. Bansal, L. Wu, J. Černe, A. G. Markelz, S. Oh, and N. P. Armitage, Physical Review Letters 108, 87403 (2012).
- Jenkins et al. (2013) G. S. Jenkins, D. C. Schmadel, A. B. Sushkov, and H. D. Drew, Physical Review B 87, 155126 (2013).
- Di Pietro et al. (2013) P. Di Pietro, M. Ortolani, O. Limaj, A. Di Gaspare, V. Giliberti, F. giorgianni, M. brahlek, N. bansal, N. koirala, S. Oh, P. Calvani, and S. lupi, Nature 8, 556 (2013).
- Chapler et al. (2014) B. C. Chapler, M. Liu, K. Post, H. Stinson, M. Goldflam, A. Richardella, J. Lee, A. Reijnders, K. Burch, N. Samarth, and D. Basov, (unpublished) (2014).
- Wu et al. (2013) L. Wu, M. Brahlek, R. V. Aguilar, A. V. Stier, C. M. Morris, Y. Lubashevsky, L. S. Bilbro, N. Bansal, S. Oh, and N. P. Armitage, Nature Physics 9, 410 (2013).
- Li and Carbotte (2013) Z. Li and J. P. Carbotte, Physical Review B 88, 45414 (2013).
- Xi et al. (2013) X. Xi, C. Ma, Z. Liu, Z. Chen, W. Ku, H. Berger, C. Martin, D. B. Tanner, and G. L. Carr, Physical Review Letters 111, 155701 (2013).
- Tran et al. (2014) M. K. Tran, J. Levallois, P. Lerch, J. Teyssier, A. B. Kuzmenko, G. Autès, O. V. Yazyev, A. Ubaldini, E. Giannini, D. van der Marel, and A. Akrap, Physical Review Letters 112, 047402 (2014).
- Di Pietro et al. (2012) P. Di Pietro, F. M. Vitucci, D. Nicoletti, L. Baldassarre, P. Calvani, R. Cava, Y. S. Hor, U. SCHADE, and S. lupi, Physical Review B 86, 045439 (2012).
- LaForge et al. (2010) A. D. LaForge, A. Frenzel, B. C. Pursley, T. Lin, X. Liu, J. Shi, and D. N. Basov, Physical Review B 81 (2010).
- Akrap et al. (2012) A. Akrap, M. Tran, A. Ubaldini, J. Teyssier, E. Giannini, D. van der Marel, P. Lerch, and C. C. Homes, Physical Review B 86, 235207 (2012).
- Grein and John (1989) C. H. Grein and S. John, Physical Review B 39, 1140 (1989).
- Benfatto et al. (2005) L. Benfatto, S. Sharapov, N. Andrenacci, and H. Beck, Physical Review B 71, 104511 (2005).
- Carbone et al. (2006) F. Carbone, A. Kuzmenko, H. Molegraaf, E. van Heumen, E. Giannini, and D. van der Marel, Physical Review B 74, 024502 (2006).
- Ortolani et al. (2005) M. Ortolani, P. Calvani, and S. Lupi, Physical Review Letters 94, 67002 (2005).
- Gyenis et al. (2013) A. Gyenis, I. K. Drozdov, S. Nadj-Perge, O. B. Jeong, J. Seo, I. Pletikosic, T. Valla, G. D. Gu, and A. Yazdani, arXiv: 1306.0043 (2013).
- Kuzmenko et al. (2007) A. B. Kuzmenko, D. van der Marel, F. Carbone, and F. Marsiglio, New Journal of Physics 9, 229 (2007).
- Okada et al. (2013) Y. Okada, M. Serbyn, H. Lin, D. Walkup, W. Zhou, C. Dhital, M. Neupane, S. Xu, Y. J. Wang, R. Sankar, F. Chou, A. Bansil, M. Z. Hasan, S. D. Wilson, L. Fu, and V. Madhavan, Science , 2823 (2013).
- Yu and Cardona (2010) P. Y. Yu and M. Cardona, Fundamentals of Semiconductors, 4th ed. (Springer, 2010).
- Singleton (2010) J. Singleton, Band Theory and Electronic Properties of Solids (Oxford University Press, 2010).
- Jonson and Mahan (1980) M. Jonson and G. D. Mahan, Physical Review B 21, 4223 (1980).
- Pei et al. (2011) Y. Pei, X. Shi, A. LaLonde, H. Wang, L. Chen, and G. J. Snyder, Nature 473, 66 (2011).
- Wang et al. (2011) H. Wang, Y. Pei, A. D. LaLonde, and G. J. Snyder, Advanced Materials 23, 1366 (2011).
- Ravich et al. (1971) Y. I. Ravich, B. A. Efimova, and V. I. Tamarchenko, physica status solidi (b) 43, 11 (1971).
- Adam et al. (2007) S. Adam, E. H. Hwang, V. M. Galitski, and S. Das Sarma, in Proceedings of the National Academy of Sciences (2007) pp. 18392–18397.
- Liu et al. (2013) J. Liu, W. Duan, and L. Fu, Physical Review B 88, 241303 (2013).
Appendix A Expected optical signatures of TCI surface states in Pb0.77Sn0.23Se
To ensure we did not overlook surface state signatures in our reflectance data, we use the Boltzmann transport equation to estimate the expected effect of surface states on the measured reflectance. The 2D surface state plasma frequency can be approximated by , where and are the Fermi velocity and wavevector, and and are the spin and valley degeneracies.Reijnders et al. (2014); Chapler et al. (2014); Adam et al. (2007) Ignoring the parabolic correction for the Dirac states, we can use , and express in a convenient form with all SI units
| (10) |
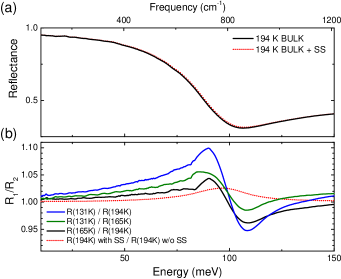
where is the speed of light and is the elementary charge. From previous ARPES measurements, we can estimate a surface Fermi level around 125 meV.Dziawa et al. (2012) At the risk of overestimating the surface contribution, we can account for sample-to-sample variations by considering an even higher surface state Fermi level of 200 meV. We also note that while and near the Dirac point, additional Dirac states with smaller wavevectors intersect the Fermi surface when the Fermi level crosses the bulk conduction band, thus doubling the surface bands, albeit with different wavevectors.Dziawa et al. (2012); Liang et al. (2013); Okada et al. (2013); Liu et al. (2013) For convenience, we account for these states by setting , resulting in a overestimated 2D plasma frequency of 0.34 meV cm1/2.
Fig. 6a shows the reflectance of Pb0.77Sn0.23Se at 192 K (the topologically trivial regime) as well as a model in which a surface state layer with meV cm1/2 was added to the 192 K Reflectance. To emphasize the minimal difference, Fig. 6b shows the ratio of both reflectance spectra (red dotted line). The same plot also shows the ratio of reflectance measurements at different temperatures above (black), below (green), and across (blue) the topological phase transition. It is clear that the sharpening bulk plasma edge has a far greater effect on the reflectance, than the surface states. Hence, discriminating surface state signatures are not within our measurement capabilities for samples with such high bulk carrier densities.