The SCUBA-2 Cosmology Legacy Survey: the submillimetre properties of Lyman break galaxies at z=3–5
Abstract
We present statistically significant detections at 850 m of the Lyman Break Galaxy (LBG) population at , and using data from the Submillimetre Common User Bolometer Array 2 (SCUBA–2) Cosmology Legacy Survey (S2CLS) in the United Kingdom Infrared Deep Sky Survey “Ultra Deep Survey” (UKIDSS-UDS) field. We employ a stacking technique to probe beneath the survey limit to measure the average 850 m flux density of LBGs at 3, 4, and 5 with typical ultraviolet luminosities of erg s-1 Hz-1. We measure 850m flux densities of (0.250.03), (0.410.06), and (0.880.23) mJy respectively, and find that they contribute at most 20 per cent to the cosmic far-infrared background at 850 m. Fitting an appropriate range of spectral energy distributions to the , 4, and 5 LBG stacked 24–850 m fluxes, we derive infrared (IR) luminosities of , 5.5, and 11.01011 L⊙ (corresponding to star formation rates of –200 M⊙ yr-1) respectively. We find that the evolution in the IR luminosity density of LBGs is broadly consistent with model predictions for the expected contribution of luminous IR galaxy (LIRG) to ultraluminous IR galaxy (ULIRG) type systems at these epochs. We also see a strong positive correlation between stellar mass and IR luminosity. Our data are consistent with the main sequence of star formation showing little or no evolution from to 5. We have also confirmed that, for a fixed mass, the reddest LBGs (UV slope ) are indeed redder due to dust extinction, with SFR(IR)/SFR(UV) increasing by approximately an order of magnitude over such that SFR(IR)/SFR(UV)20 for the reddest LBGs. Furthermore, the most massive LBGs also tend to have higher obscured-to-unobscured ratio, hinting at a variation in the obscuration properties across the mass range.
keywords:
galaxies: formation – galaxies: evolution – galaxies: high-redshift – galaxies: star formation – submillimetre: galaxies1 Introduction
Lyman Break Galaxies (LBGs) are currently the largest population of star-forming galaxies known to be at high redshift, , and as such have provided valuable insights into the mass assembly of galaxies during the first few Gyr of the Universe. From a practical standpoint, this has been due, in part, to the efficiency of the simple selection of LBGs in broad-band colours that span the eponymous “Lyman break” as it is redshifted through the optical bands at (Steidel & Hamilton, 1993). This has made it possible to identify large samples of LBGs, and from this we have learned that they are: massive (M⊙; Reddy et al. 2006; Rigopoulou et al. 2006; Verma et al. 2007; Stark et al. 2009; Magdis et al. 2008, 2010a), rapidly star-forming (10s–100 M⊙ yr-1; e.g. Shapley et al. 2001, 2005; Magdis et al. 2010b; Rigopoulou et al. 2010; Chapman & Casey 2009) and numerous ( Mpc-3; e.g. Reddy & Steidel 2009). As such, they have been interpreted as a phase in the formation of “typical” galaxies (e.g. Somerville, Primack & Faber 2001; Baugh et al. 2005) and are the progenitors of a reasonable fraction of massive () galaxies today.
Despite this progress, there are still a number of open questions surrounding the nature and properties of typical LBGs. Some LBGs have dust-corrected star formation rates (SFRs) of up to 100 M⊙ yr-1, which is enough to form present-day elliptical galaxies, and indeed LBGs at are attractive progenitors for the rather substantial population of passive red galaxies already in place by –3 (Stark et al. 2009; Kriek et al. 2006; van Dokkum et al. 2006). Thus LBGs should contribute a significant portion of the submm background at 850m at high redshifts (Adelberger & Steidel, 2000). However, determining their contribution to the submm background has been hampered by the large uncertainties that go hand-in-hand with deriving dust-corrected UV luminosities. The most reliable way of measuring their dust content and contribution to the submm background is directly through submillimetre (submm) observations, which will reveal any dust-obscured star formation activity.
Several attempts have been made to detect the rest-frame far-IR emission in LBGs, with mixed success. There are only a handful of individual submm detections of LBGs, including Westphal-MMD11 (Chapman et al., 2000) and Westphal-MM8 (Chapman & Casey, 2009), targetted as part of a sample of LBGs with high UV-derived SFRs, as well as a highly magnified gravitationally lensed LBG at (Baker et al., 2001). Two early SCUBA-based statistical studies of the submm flux of LBGs with high UV-derived SFRs (Chapman et al., 2000) and of “typical” canonically-selected LBGs (Webb et al., 2003) yielded no detection of the population, with an average below 1 mJy. On the other hand, Peacock et al. (2000) detected a mean flux of (0.20.04) mJy for starburst galaxies with UV-SFRs of 2 M⊙ yr-1, with the mean submm flux density increasing with UV-SFR. More recently with Herschel, several authors have revisited LBG stacking. Lee et al. (2012) find a marginal signal (–4 level) in a single-band (500 m) for a UV-bright subset of LBGs, and Rigopoulou et al. (2010) and Magdis et al. (2010b) have reported statistical detections of mid-IR-selected LBGs with Herschel, but this latter sample is clearly biased to the IR-brightest most massive and/or dustiest subset of LBGs (Huang et al. 2005; Rigopoulou et al. 2010; see also Oteo et al. 2013). As the available submm maps continue to increase in size and depth (e.g. Weiss et al. 2009), stacking is now able to sometimes yield successful statistical detections of specially chosen subsets of LBGs at (split by stellar mass and UV-estimated SFRs; Davies et al. 2013), which has helped to reliably constrain the far-IR luminosities, obscured SFRs, dust masses and dust temperatures in the most massive and UV-luminous LBGs. There have also been attempts to detect the dust emission in a handful of LBGs at (e.g. Stanway et al. 2010; Davies et al. 2012), although no detections were made, making it difficult to say anything conclusive. Thus, the far-IR emission from typical LBGs (i.e. those selected by the canonical UV/optical broadband colour criteria), hence their dust content and contribution to the submm background, as well as tracing their IR luminosity density as a function of redshift all remain open questions.
Here we present a statistical (stacking) analysis of LBGs at , 4 and 5 in the United Kingdom Infrared Deep Sky Survey “Ultra Deep Survey” (UKIDSS-UDS; Lawrence et al. 2007) field. The UDS has been mapped with the Herschel Spectral and Photometric Imaging Receiver (SPIRE) at 250, 350, and 500 m and at 850 m as part of the SCUBA–2 (Holland et al., 2013) Cosmology Legacy Survey (S2CLS; e.g. Geach et al. 2013). The 850m map is the largest submm map yet obtained at this depth ( mJy over 1 deg2, see §2.1). The availability of deep optical/near-infrared (OIR) imaging in this field, combined with the new wide-area deep 850 m map makes this an ideal resource to study the submm properties of LBGs, without biasing the analysis to the most massive and/or mid-IR or UV-brightest LBGs (e.g. Rigopoulou et al. 2010; Davies et al. 2013). The goal of this work is to measure the average submm flux density (which is a direct probe of obscured star formation) of LBGs selected at , and in order to estimate the bolometric luminosity of typical massive galaxies at these epochs and to assess the LBG contribution to the IR luminosity density to compare with models.
This paper is organized as follows. The data and LBG sample selections are described in Section 2. In Section 3 we present the main analysis and results of the LBG stacking in submm maps, including the LBG contribution to the submm background, LBG SEDs, and the evolution of the IR luminosity density of LBGs. In Section 4 we discuss the implications of the results and, finally, our conclusions are given in Section 5. Throughout the paper we assume cosmological parameters of , , and km s-1 Mpc-1 (Spergel et al., 2003).
2 The Data
2.1 Optical and near-infrared imaging
Our samples are based on the deep -band image from the United Kingdom Infrared Telescope (UKIRT) Infrared Deep Sky Survey (UKIDSS; Lawrence et al. 2007) Ultra Deep Survey (UDS111http://www.nottingham.ac.uk/astronomy/UDS/) data release 8 (DR8; Almaini et al., in preparation) and co-incident multi-wavelength data. The parent catalogue was extracted using sextractor (Bertin & Arnouts, 1996) on the deep -band image () and after merging the source lists from two independent extractions. The extraction parameters were designed to recover both point-like and extended low-surface-brightness objects (see Hartley et al. 2013 for further details). In addition to the three UKIDSS bands, the UDS has been mapped by the Canada-France-Hawaii Telescope (CFHT) Megacam band (; Foucaud et al., in preparation), by Subaru Suprime-cam in the optical (, , , and , 5- AB mags; Furusawa et al. 2008) and by the Spitzer InfraRed Array Camera (IRAC; Fazio et al. 2004) in channels 1 (3.6 m; 5- depth of 24.2 AB mags), and 2 (4.5 m; 5- depth of 24.0 AB mags) via the UDS Spitzer Legacy Program (SpUDS; PI:Dunlop). The overlap of all these data sets (after masking bad regions) is 0.62 deg2. In addition, available X-ray (Ueda et al., 2008) and radio (Simpson et al., 2006) data were employed to remove bright AGN. The matched multi-wavelength photometry was extracted using 3 arcsec apertures centred on the positions of the -band catalogue sources (see Simpson et al. 2012 for full details). Point spread function (PSF) photometry corrections were required and applied to three of the bands (the CFHT band and the two IRAC channels) in order to obtain correct colours (see Hartley et al. 2013 for details). We use this final matched multi-wavelength catalogue to perform our LBG selection.
2.1.1 Lyman Break Galaxy selection
The canonical LBG selection utilizes the UGR, or BVR, colour space, with “drop-outs” in the bluest band efficiently isolating galaxies at (Steidel et al., 1996). Since the selection requires detection in G and R, as the Lyman break is redshifted through the G or V band, the selection function falls off with redshift. The technique can be applied to higher redshift by simply moving the entire colour space to longer wavelengths. Ouchi et al. (2004) show how a similar selection in BRi, isolates LBGs at , and Viz, or Riz, extends the selection to .
We adopt the following colour selections for LBGs at (eq. 1), (eq. 2) and (eqs. 3 and 4):
| (1) |
| (2) |
| (3) |
| (4) |
For the selection, we require selection using either eq. 3 or eq. 4, slightly improving our yield (see Ouchi et al. 2004), and for all selections we also require that the source has not been identified as a possible star.
Eleven-band photometric (UBVRIzJHK[3.6][4.5]) redshifts have been estimated for all of the galaxies in the DR8 parent sample. The overview of these redshifts and how they are calculated is discussed in more detail in Hartley et al. (2013) and Mortlock et al. (2013). In summary, the photometric redshifts are computed using the eazy template fitting code, adopting the six default eazy spectral energy distribution (SED) templates (Brammer, van Dokkum & Coppi, 2008). In addition to this we further include a template which is the bluest eazy template, but with a small amount of Small Magellanic Cloud (SMC) like extinction added. Photometric redshifts are then computed from a maximum likelihood analysis. To test how accurate these photometric redshifts are, we compare the values we calculate to spectroscopic redshifts that are available in the UDS. A large fraction of these are from the UDSz, an European Southern Observatory (ESO) large spectroscopic survey (ID:180.A-0776; Almaini et al., in preparation) and also from previous published values (see Simpson et al. 2012 and references therein). We have in total about 1500 secure spectroscopic redshifts in the UDSz, and around 4000 redshifts from other sources, although this reduces to 2146 after the removal of active galactic nuclei (AGN). Excluding catastrophic outliers ( 0.15), we find an average (Hartley et al., 2013).
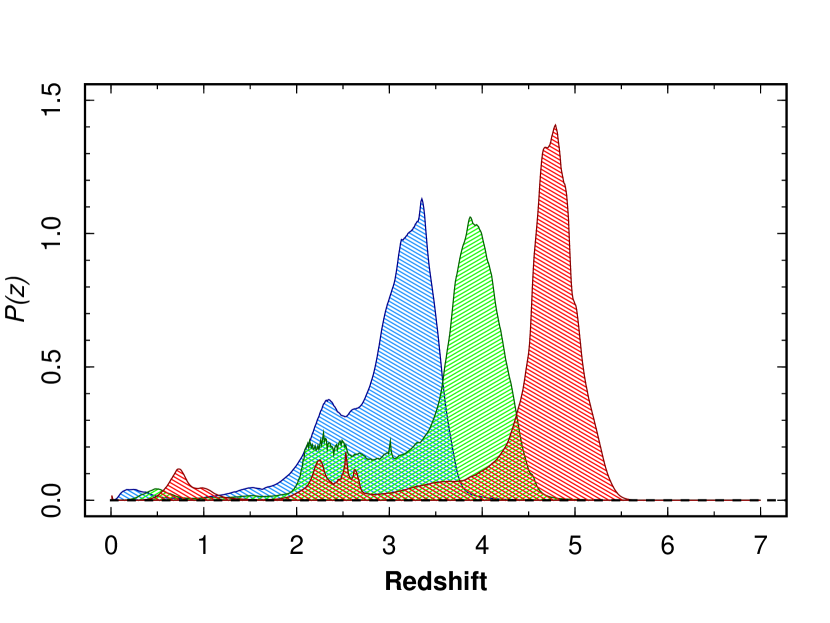
To further improve the LBG colour selections described above, we enforce a photometric redshift selection to eliminate any low-z interlopers (where is the solution with the minimum from the eazy fitting). The photo-z fitting procedure evaluates a probability density distribution, , for each galaxy, with the peak of that distribution representing the best estimate for the redshift. Apart from the criterion, we do not use the photometric redshifts further. However, we can make use of to investigate the efficacy of the colour selections described above. In Fig. 1 we show the (normalised) sum of the individual for the galaxies in the selections defined in equations 1–4. This clearly demonstrate the effectiveness of the colour selections, and also provides us with an estimate of the widths of the redshift distributions, reflecting both intrinsic spread (due to the “window” where the redshifted Lyman break can be identified in each case), and uncertainty in the photometric redshift estimates. The resulting LBG sample properties are summarized in Table 1.
An important point to note is that our LBG selection is predicated on a selected sample, that is the basis of the UKIDSS-UDS catalogue described above. As a result, we will not include, for example, LBGs with and , but these will be at the low stellar mass end of the distribution (, see § 3.5). As we explore in § 3.5, the average submm flux of LBGs is expected to be a function of mass, and so we treat the limit as a proxy mass limit for the galaxies in the sample. Note also that the optical limits in equations 1–4 result in a slight bias in UV luminosity selection with redshift. At we are sensitive to galaxies more luminous than mag, but only mag at . Therefore, when we examine trends with UV luminosity, we focus on the sample.
2.2 SCUBA–2 observations and map making
As part of the S2CLS campaign, observations of UKIDSS-UDS were conducted in Band 2/3 weather () between October 2011 and February 2013. The mapping centre of the UDS field is 2h 18m 00s, 05∘ 05′ 00′′, and a 3300 arcsec diameter PONG mapping pattern was used, resulting in a circular map that reaches a uniform depth over an area of 700 arcmin2. The total mapping time was 130 hr, split into 195 scans of 40 minutes each. Individual scans are reduced using the dynamic iterative map-maker (makemap) of the smurf package (Chapin et al., 2013). Geach et al. (2013) presented the reduction procedure for CLS data, but in summary, we apply the following steps.
-
1.
Raw data are flat-fielded using ramps bracketing every science observation, and the data are scaled to units of pW.
-
2.
The signal each bolometer records is then assumed to be a linear combination of: (a) a common mode signal dominated by atmospheric water and ambient thermal emission; (b) the astronomical signal (attenuated by atmospheric extinction, see Dempsey et al. 2013); and finally (c) a noise term (including -type correlations), taken to be the combination of any additional signal not accounted for by (a) and (b). The dynamic iterative map maker attempts to solve for these model components, refining the model until convergence is met, or an acceptable tolerance has been reached.
The reduction also includes the usual filtering steps of spike removal (10 deviations in a moving boxcar) and DC step corrections. Throughout the iterative map-making process, bad bolometers (those significantly deviating from the model) are flagged and do not contribute to the final map.
-
3.
Time streams are finally re-gridded into a map with 4 arcsec pixels, with each bolometer weighted according to its time-domain variance (which is also used to estimate the tolerance in the fit).
Maps made from individual scans are co-added in an optimal, noise-weighted manner, using the mosaic_jcmt_image recipe in the Picard environment (Jenness et al., 2008). Finally, to improve the detectability of faint point sources, we apply a beam-matched filter to improve their detectability using the Picard recipe scuba2_matched_filter. The average exposure time over the nominal 3300 arcsec mapping region in the co-added map is approximately 1.5 ksec per 4′′ pixel, and the r.m.s. noise value is 1.9 mJy. Due to the scanning strategy, there are data beyond the 3300 arcsec perimeter, but because these receive less total exposure, the noise increases accordingly. The LBG catalogues cover a 0.6 deg2 area within the central uniform noise region of the SCUBA-2 map.
An important component of our stacking analysis is to create a map with bright significantly-detected point sources near to an LBG (but not near enough to be associated) removed. For this, we run a peak-finding algorithm on the signal-to-noise ratio map down to a level of 3.5 , and this was done for each LBG-redshift sub-sample separately. Each time a peak is found within 8 arcsec (about half a SCUBA-2 beam), the flux of the contributing source is removed by subtracting a model point response function (PRF) at that position, scaled to the flux of the source. The peak-normalised model PRF is generated from the data by stacking the map at the positions of all 10 peaks. This residual map still contains astronomical signal, but with deemed LBG-unassociated submm 3.5 sources removed, so that we do not inadvertently bias our stacking results high by including flux from nearby unrelated positive beams. This procedure is virtually identical to the approach taken in the Webb et al. (2003) SCUBA LBG stacking analysis paper. The remaining 36 submm sources222We find 26, 9, and 1 candidate LBG-SMG counterparts for our LBG redshift sub-samples at , 4, and 5, respectively. may not be genuine LBG-SCUBA-2 associations (and in fact the calculated Poisson probabilities that they are chance coincidences are not particularly low), but because they could be genuine, we must not remove these sources from the map. These candidate LBG-SCUBA-2 associations will be evaluated using a rigorous multi-wavelength approach in Coppin et al. (in preparation).
3 Analysis & Results
3.1 Statistical results
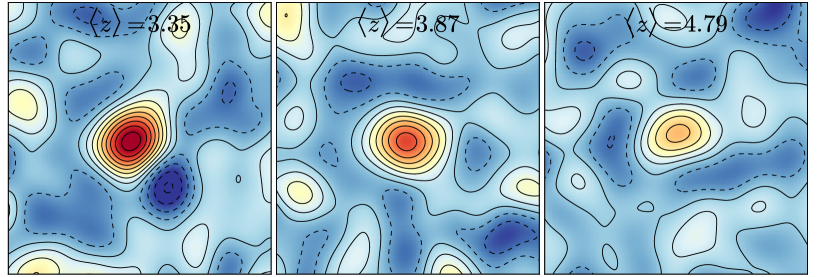
With the LBG samples defined, we measure the submm flux at each LBG position in the 850 m beam-convolved, 3.5 source subtracted flux map, weighted by the noise at the corresponding positions in the noise map. For visualisation, we simultaneously stack 8080 arcsec cut-outs, again applying a simple inverse variance weighting scheme, obtaining the weights from the noise maps (note that measuring the stacked flux directly from these images necessarily gives the same result). The stacked thumbnail images for each sample are shown in Fig. 2, indicating the detection of significant 850m emission from LBGs at , , and (see Table 1). We repeat the exercise above on the original flux map (i.e. including all 3.5 sources which had been removed) and list these results in Table 1. These stacked fluxes are statistically indistinguishable from the stacked fluxes calculated previously on the source-subtracted maps. As an additional check, we compare the radially averaged profiles of the stacks with the shape of the beam (empirically derived by stacking many high significance peaks in the detection image). The stacks are indistinguishable from the beam, and this indicates that if there is any significant contribution to the observed signals from large scale structure correlated with the LBGs, it is on scales below 100 kpc.
To verify the significance of our results, we have stacked at the same number of uniform random positions within the same map area and repeated this 10,000 times for each LBG redshift slice subset. We do not, however, remove any sources from the map; this should provide a conservative estimate of the likelihood of measuring the same (or greater) level of flux in the stack as observed for the LBGs simply by chance. In these random realisations, we never find a result as statistically significant as ours in the and 4 samples (the most significant stacked result we find at random in the 3 and 4 samples are at the 3.8 and 3.4 levels, respectively, occurring in each 0.02 per cent of the time), and less than 0.02 per cent of the time in the sample. Thus, in light of these simulations our statistical detections appear to be robust.
| 850 ma | 850 mb | 250 m | 350 m | 500 m | 24 m | ||
|---|---|---|---|---|---|---|---|
| (mJy) | (mJy) | (mJy) | (mJy) | (mJy) | (Jy) | ||
| 3.35 | 4201 | 0.2490.029 (8.5) | 0.2280.029 (7.8) | 0.7510.077 (9.8) | 0.9380.109 (8.6) | 0.6340.143 (4.4) | 9.50.9 (10.5) |
| 3.87 | 869 | 0.4110.064 (6.4) | 0.3880.064 (6.0) | 0.7830.177 (4.4) | 1.1160.163 (6.8) | 1.0240.164 (6.2) | 2.10.5 (4.2) |
| 4.79 | 68 | 0.8750.229 (3.8) | 0.8110.229 (3.5) | 2.0230.798 (2.5) | 2.3370.916 (2.6) | 2.0220.686 (2.9) | 4.02.0 (2.0) |
a Submm sources 3.5 and further than 8 arcsec
away from an LBG have been removed. We adopt this column for the SED fitting.
b No submm sources have been removed.
| SFRIR | SFRUV | |||
|---|---|---|---|---|
| (1011 L⊙) | (M⊙ yr-1) | (1029 erg s-1 Hz-1) | (M⊙ yr-1) | |
| 3.35 | 3.2 | 55 | 0.9 | 18 |
| 3.87 | 5.5 | 93 | 1.7 | 33 |
| 4.79 | 11.0 | 186 | 1.7 | 33 |
3.1.1 Assessing the level of bias in our statistical results
Our simple methodology implicity assumes that the galaxy population we have stacked is uncorrelated (i.e. the LBGs are not clustered). However, like most populations, LBGs are known to be clustered ( Mpc; Adelberger et al. 2005). We investigate the level of bias due to LBG clustering in our stacking results by following the formalism of Viero et al. (2013) for unbiased stacking of galaxy catalogues on Herschel maps (see also Kurczynski & Gawiser 2010 and Roseboom et al. 2010), which takes into account the presence of multiple sources in the same beam. In brief, we create a “hits” map () of the same size as the SCUBA-2 map for a given LBG catalogue, where each pixel in the map contains the integer number of sources that fall into it. The hits map is then convolved with the actual PRF of the instrument (note that a different result, yielding a non-negligible positive flux bias, occurs if the beam is wrongly assumed to be a simplistic Gaussian). The convolved hits map is then regressed against the 850 m flux map () to find the minimal flux residual , where is the average flux density of the LBG population. The method safely assumes that galaxies in different redshift slices are uncorrelated and we thus treat each of our LBG lists independently. The fitting routine yields minima at =(0.210.04), (0.390.07), and (0.860.26) mJy for , 4, and 5, respectively (with the error bars calculated from Monte Carlo simulations). These results are indistinguishable from the results in columns 3 and 4 of Table 1. It is reassuring that our statistical detections do not appear to be dominated by an upwards bias in flux introduced by potentially “double counting” flux for multiple sources falling in the same beam.
There is also the legitimate worry that LBGs are also correlated with some fainter (as yet undetected, and potentially numerous) population that contributes to the observed submm flux density, thus boosting our statistical detections (e.g. Chary & Pope 2010, Serjeant et al. 2010, and Kurczynski & Gawiser 2010). However, for the purposes of our analysis we would say this was flux associated with the LBG. Whether or not the emission is always physically within the LBG is beyond the scope of our current study.
3.2 The LBG contribution to the submm background at 850m
The contribution to the submm background from LBGs is still poorly constrained, however our data can finally address this question, since we now have a robust detection of the average 850 m flux density of LBGs at three epochs, at least those with ultraviolet luminosities of erg s-1 Hz-1, characteristic of galaxies in our sample (Table 2). Using our average stacked 850 m flux densities, we estimate surface brightness densities of 1700, 600, and 100 mJy deg-2 of LBGs at , 4, and 5, respectively. By comparison, the total background at 850 m inferred from COBE-FIRAS is 3.1– (Puget et al. 1996; Fixsen et al. 1998; Lagache, Puget & Dole 2005; Hauser & Dwek 2001). Summing these separate surface brightness densities together, we find that the LBGs in our , 4 and 5 samples comprise around 6–8 per cent of the submm background at 850 m (where the range of values simply reflects the uncertainty in the COBE-FIRAS result). However, the true contribution from LBG-like galaxies to the submm background will come from a wider range in redshift, not just from the rather narrow redshift slices we have sampled (see Fig. 1), and from sources falling out of our samples due to incompleteness. To determine the total (corrected) contribution from LBGs over , we assume that LBGs have a constant comoving number density (which is a reasonable assumption since the bright end of the luminosity function for LBGs shows little evolution over ; Reddy & Steidel 2009; Bouwens07; McLure et al. 2009). Starting with the sample (which is our most complete sub-sample of LBGs) we can integrate over the comoving volume element for this redshift range, scaling the LBG submm background contribution accordingly. We find that the total contribution to the submm background from LBGs over the redshift range is likely to be closer to 14–20 per cent. This result is consistent with Webb et al. (2003), who estimated an upper limit to the contribution to the submm background from of less than 20 per cent.
3.3 The bolometric luminosities and total SFRs of LBGs


In order to put LBGs in context with other IR-luminous galaxy populations we must determine some intrinsic properties, such as their IR luminosities and obscured and unobscured SFRs. Our approach is to make use of the full (rest-frame UV to submm) average spectral energy distributions (SEDs) of LBGs at each epoch, where the photometry are the average for the sample.
For the average rest-frame UV–near-IR SED of our LBGs, we find that the best fitting Bruzual (2007) model for LBGs selected at 24 m-selected from Magdis et al. (2010b) provides a reasonable model of the stellar emission in our non-IR selected sample. In Fig. 3 we show the average photometry of the three LBG samples, with the Magdis et al. (2010b) SED redshifted and scaled to the observed -band flux. The template SED provides an excellent description of the observed average photometry, with only a slight discrepancy in the UV emission at and , most likely due to increasing Ly forest absorption at . We use this template to calculate k-corrections in the UV–near-IR part of the SED.
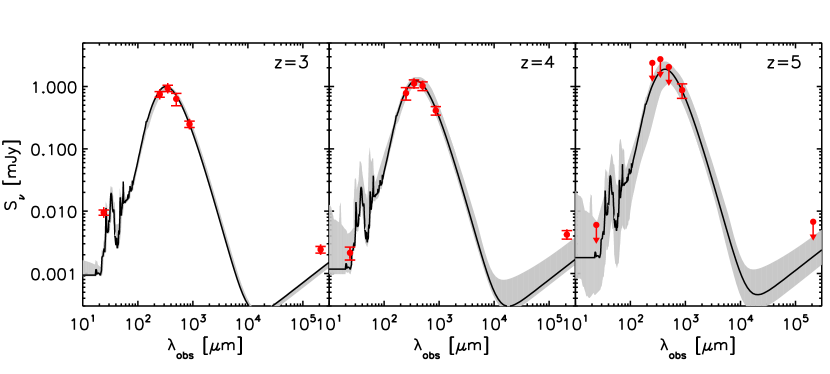
For the mid-IR-to-submm part of the SED we use the 185-SED template library constructed by Swinbank et al. (2014), which includes local galaxy templates from Chary & Elbaz (2001), Rieke et al. (2009), and Draine et al. (2007), as well as the SEDs from well studied high-redshift starburst galaxies SMMJ2135–0102 () and GN20 () from Ivison et al. (2010) and Carilli et al. (2011), respectively. We fit these templates to our observed far-IR stacked photometry of the LBGs using a minimisation approach, but allowing the redshift and normalisation of the templates to vary. To improve the constraints and accuracy of the SED fitting, we have also extracted stacked photometry for our LBG sub-samples based on Herschel SPIRE maps of the UDS at 250, 350, and 500 m from the Herschel Multi-tiered Extragalactic Survey (HerMES; Oliver et al. 2012). The Level 2 data products from the Herschel ESA archive were retrieved, aligned and co-added to produce maps. For the stacking, we use the raw map from Swinbank et al. (2014), which has had the mean flux of 1000 random positions subtracted, effectively removing any systematic contribution from the background or confusion. In addition, this map includes re-injected flux from any LBG identified in the 24 m catalogue used to make a deblended version of the map333The raw SPIRE maps, deblended model, catalogues and residual maps used for this analysis are available at http://astro.dur.ac.uk/ams/HSODeblend/UDS/ in Swinbank et al. (2014) (including 142, 15, and 2 in the , 4, and 5 samples, respectively). The stacked results are given in Table 1. We note that significant (i.e. -) detections in all three SPIRE bands are made at and , but not at . To provide a constraint on the Wien side of the spectrum, we have also stacked the LBGs in 24 m Multiband Imaging Photometer for Spitzer (MIPS; Rieke et al. 2004) imaging using a 13 arcsec aperture radius and apply the standard aperture corrections. This yields detections of the and 4 LBGs but not for LBG sample, and the results are tabulated in Table 1. Thus we use the stacked fluxes and errors from Table 1 for the and 4 samples in the SED fitting, but convert the SPIRE and MIPS fluxes of the sample to 3- upper limits. The best-fitting templates are shown in Fig. 4, along with the range of models which lie within 1- of the best fit that are used to calculate uncertainties on our SED-derived parameters.
We use the best-fitting SEDs to compute the basic properties and SFR. To calculate the values of our average LBG at , 4, and 5, we integrate under the best-fitting SEDs between 8 and 1000 m and tabulate the results in Table 2. We then calculate the corresponding star formation rate (SFR) for our average LBG (see Table 2) following Kennicutt (1998): . This relation assumes that the IR luminosity is predominantly powered by star formation (i.e. a negligible contribution from an AGN, which is assumed to be a good assumption in general for LBGs; e.g. Shapley et al. 2005; Huang et al. 2007; Rigopoulou et al. 2010) and comes from a starburst less than 100 Myr old, with a Salpeter (1955) initial mass function (IMF). We find that the best-fitting SED template for the sample has a dust temperature of K and the best-fitting SED template for the and 5 samples has K. For reference, we also fit the SPIRE+SCUBA-2 photometry using a simple modified blackbody assuming a dust emissivity index of (e.g. Blain et al. 2002) with the Wien side of the spectrum modified by a power law of the form . The derived dust temperatures from the SED template fitting are lower (by 5–25 per cent, with the percentage difference increasing with redshift) compared to the modified blackbody method, and the values from the modified blackbody fits are a factor of –3 times higher than the SED templates, demonstrating the additional systematic uncertainty involved in far-IR SED fitting that should be taken into account.
For each LBG redshift subset, we also perform median stacking444A median stack minimizes any bias due to a few number of radio-loud outliers of the LBG samples in the UDS Jansky Very Large Array (JVLA) 1.4 GHz data. The median stacked radio fluxes are S, and Jy, for our , 4, and 5 LBGs, respectively. The radio fluxes were obtained using the techniques described in Arumugam (in preparation). In brief, the fluxes were obtained using the JMFIT task within AIPS, where the width of the Gaussian fit to the stack was fixed to be the full width at half maximum (FWHM) of the corresponding stack at the positions of sources in a K-band catalogue. The whole K-band catalogue was used to provide a high S/N image from which the Gaussian parameters could be determined. This is used over the synthesised beam FWHM to account for bandwith smearing effects. The radio stacks are simply overplotted on the SEDs in Fig. 4 as detections (at and 4) or upper limits () using a nominal threshold. We note that the detected radio stacks at and 4 lie 1– higher than the best-fitting far-IR constrained SEDs would predict, hinting that either the radio emission in the template is not representative of –4 star-forming galaxies and/or that there is some AGN contribution to the radio fluxes of typical LBGs (although, only 3 per cent of LBGs show any AGN activity; Steidel et al. 2002; Laird et al. 2006).
Nevertheless, the LBGs appear to be of the LIRG-to-ULIRG class (1011–1012 L⊙), with corresponding SFRs of several tens to hundreds of M⊙ yr-1. These results are consistent with previous work within the photometric uncertainties and systematic errors involved in SED fitting, but our deep stacked fluxes have enabled us to provide physical constraints on the far-IR SEDs of canonically-selected “typical” LBGs for the first time, and are not limited to just the most massive or UV-brightest subsets (e.g. Lee et al. 2012; Davies et al. 2013).
3.4 The evolution of the IR luminosity density of LBGs
We have shown that LBGs contribute a non-negligible fraction of the submm background. Our stacking results provide a new suite of constraints for models of luminosity density and galaxy formation as they directly probe the far-IR density of the Universe from to 5 down to the LIRG level of energy output ( L⊙).
We can estimate the IR luminosity density of LBGs at , 4, and 5 by multiplying the LBG volume densities by the corresponding average LBG . To calculate the volume densities, we integrate the UV luminosity functions from Reddy & Steidel (2009), Bouwens et al. (2007), and McLure et al. (2009) for 3, 4, and 5, respectively, down to an absolute UV magnitude () of at each redshift. Our choice of UV luminosity limit is motivated by the limitation that is approaching the limiting optical depth of the survey, with the , and band sampling the rest-frame 1700Å emission at –. Integrating the luminosity function to a lower luminosity introduces uncertainty since we enter a regime where the infrared emission of low-(UV)-luminosity LBGs is not well measured, and therefore their contribution to the IR luminosity budget is uncertain. Limiting to ensures a reasonably conservative estimate of the LBGs’ contribution to the luminosity density, whilst sampling a representative proportion of the population, below the knee in the luminosity function. Obviously, integrating further down the UV luminosity function whilst applying the same canonical average , would result in a higher luminosity density, but it is likely that generally is falling with .
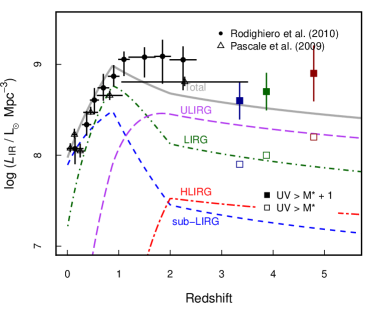
For LBGs with UV luminosities above , we find corresponding IR luminosity densities of , , and L⊙ Mpc-3 for , 4, and 5, respectively. In Fig. 5, we have compared our results alongside the models of the IR luminosity density from Béthermin et al. (2011) and other available measurements from the literature (Pascale et al. 2009; Rodighiero et al. 2010). Pascale et al. (2009) stacked 24 m-selected sources, limiting their study to –2, in the submm using BLAST data (Devlin et al., 2009). Here, using the efficient canonical LBG selection we are able to reliably extend the model constraints to and beyond for the first time. It appears that our measured IR luminosity densities for canonically-selected LBGs at –5 lie mildly high on average, but are broadly consistent with the Béthermin et al. (2011) model predictions of LIRGs at –4 and ULIRGs at . Obviously the derived luminosity density depends on our choice of luminosity limit when integrating the UV luminosity function, since in this calculation we are assuming a fixed average for all LBGs at each epoch. We have chosen to roughly match the depth of our catalogue, however we show the effect of integrating down to in Fig. 5, which bring the luminosity densities more in line with the predictions of Béthermin et al. (2011) for galaxies of this luminosity class. Interpreting these observations as a lower limit to the total infrared luminosity density at –, and assuming that the luminosity density peaks at –, our observations are consistent with little, or slow, evolution in the infrared luminosity density over –.
3.5 Variation of submm luminosity with stellar mass
Although the LBG approach is efficient at selecting relatively normal, massive galaxies at high-redshift, it is important to consider that the ‘LBG’ population is rather a broad demographic. By definition, the rest-frame ultraviolet/optical colours of LBGs are quite uniform, as enforced by the colour selection, but the lack of constraints on the observed near-infrared (and longer wavelength) properties results, not surprisingly, in a rather large range of (rest-frame) optical/near-IR colours in LBG samples (e.g. Rigopoulou et al. 2006). As pointed out in Davies et al. (2013), there could be a substantial variation in the average submm flux density within each of the LBG samples that we calculated in Section 3.1. This can be investigated directly by examining the individual submm flux densities of the LBGs. Unfortunately, the 1- scatter in the flux densities of individual sources in each LBG subset is similar to the map noise ( mJy), indicating that we do not have sufficient signal-to-noise to detect any real variation or intrinsic scatter in the submm properties of the bulk of the LBG population. Nevertheless, a reasonable expectation is that the far-IR luminosity could be a strong function of stellar mass (e.g. Davies et al. 2013), which we now investigate.
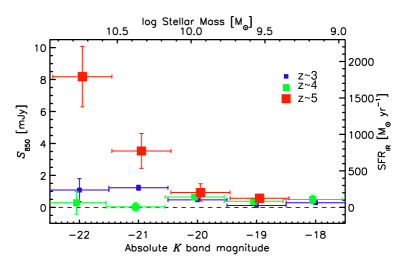
The UV/OIR SEDs described above provide a means of selecting LBGs within each redshift bin by stellar mass, thus allowing us to apply the appropriate k-correction to estimate the absolute rest-frame -band luminosity from the observed -band magnitude. Using UKIRT filters, the k-corrections are 2.6, 2.8, and 2.8 mag for , 4, and 5, respectively. Adopting as an empirical proxy for stellar mass (thus allowing us freedom in the interpretation by assuming different ), we repeat the stacking procedure in bins of . The results are shown in Fig. 6, which reveals a positive correlation between submm flux density and stellar mass at the highest redshifts, with the most massive LBGs at tending to be the most submm luminous on average. There is also a mild hint of evolution in the data – with the LBGs being more IR luminous than similarly massive LBGs at and 4 – albeit not at a very significant level (). On closer inspection, we find that the stacked submm flux result for the highest mass bin in the sample is dominated by a single submm source in the map at one of the LBG locations. We discuss this further in Section 4.
3.6 Comparison of submm-derived SFRs with UV-derived SFRs
For star-forming galaxies, we expect that the rest-frame UV continuum and the far-IR emission should be correlated if , since for a given dust covering fraction, the UV continuum emission should on average scale with the energy re-radiated in the far-IR. It also follows that the dust absorption should be correlated with UV reddening, and this has been seen for local starburst galaxies (Meurer, Heckman & Calzetti, 1999) and at higher redshifts from 1–3 (e.g. Reddy et al. 2006, 2012; Magdis et al. 2010a, b; Heinis et al. 2013). It is therefore difficult to distinguish between a galaxy with a truly high SFR and one with an intrinsically low SFR and large photometric errors. Correcting for dust attenuation using only optical data is inherently difficult and uncertain, given the degeneracy between the average age of the stellar population and affect of reddening, and thus the need for excellent sampling of the UVOIR spectral range. Submm observations provide a clean route to assessing the level of dust extinction, and hence the amount of star formation that is “obscured” from view in the optical.
Shapley et al. (2001) discuss that the more intrinsically luminous LBGs appear to be dustier, with redder colours (and should therefore be brighter in the submm). Chapman et al. (2000) reported that submm-bright LBGs tended to have extremely red colours compared to the average of the population. This was confirmed by Reddy et al. (2012) who showed using Herschel 100 and 160 m data that the reddest of their 146 LBGs at indeed contain more dust, finding remarkable agreement between the local and high-redshift UV attenuation curves (e.g. Meurer, Heckman & Calzetti 1999). With our large LBG catalogues and deep SCUBA-2 map, we can now explore these issues in more detail and with greater statistical significance. Here we focus on our largest LBG sample at since this is where we have sufficient S/N to split up the sample further. To estimate the rest-frame UV (1700Å) luminosities, we simply calculate the luminosity from the observed flux in the observed -band, with no k-correction. The associated UV-derived SFRs are obtained by employing the relation in Kennicutt (1998) to the absolute magnitudes of the LBGs (see Table 2).
In Fig. 7, we plot measured 850 m flux (as a proxy for obscured SFR) versus the UV-derived SFRs (uncorrected for dust) – this provides a measure of the amount of “dust-obscured” versus “unobscured” or “visible” star formation. We find an inverse correlation of submm flux with UV SFR, that is, the LBGs that are faintest in the UV are also the most submm bright on average. Are the faint UV population intrinsically the dustiest or is this simply a mass selection effect? To explore this, we split up our sample into three bins of equal mass width across our range of stellar mass: M⊙ (least massive); M⊙ (intermediate mass); and M⊙ (most massive). At a fixed mass, we again see that submm flux density increases with decreasing UV SFR, but now also that the average submm flux increases with the stellar mass.
What is the distribution of obscured-to-unobscured star formation in the LBGs? We can explore this by plotting the average ratio versus (observed) colour for the LBGs, using the same stellar mass binning as above (Fig. 7). This plot demonstrates that on average, LBGs have , but for the reddest () LBGs in all mass subsets the obscured-to-unobscured ratio is up to an order of magnitude larger than this, with . As Fig. 7 shows, for the populaton as a whole, the increase in is broadly in agreement with that expected if we assume an SMC-like extinction curve and assume that all of the optical exinction is caused by dust that is absorbing and re-emitting the UV radiation field. However, we also see evidence that there is a variation in the – trend with mass, with the most massive LBGs showing the highest for all colour bins. The combination of these two plots demonstrates that (a) at a fixed mass, we can relate optical reddening, as parameterised by the UV continuum slope , to dust-reprocessed emission in the observed submm, and (b) the most massive LBGs also tend to have higher obscured-to-unobscured () ratios (are more extinguised) on average than the less massive LBGs, hinting at different dust properties/geometries across the mass range. We discuss this further below.


4 Discussion: exploring the LIRG population at 3–5
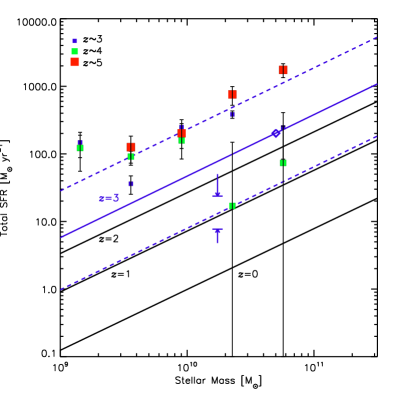
We detect a statistical signal in the submm for the LBG populations at , 4, and 5. These stacked fluxes tell us about the “average” submm properties of LBGs at each epoch, and the mean submm flux density tends to increase with redshift. A more careful analysis reveals that it appears to be a simple mass-selection effect – at higher redshifts lower-mass (and lower overall luminosity) objects drop out of the sample, mimicking the trend that LBGs increase in IR luminosity with redshift. When this is taken into account, by splitting our redshift sub-samples further into stellar mass bins, the data show no convincing evidence of strong redshift evolution in submm flux (as a proxy for bolometric luminosity) with absolute rest-frame -band flux (as a proxy for stellar mass). For comparison to the well-established “main sequence” of star-forming galaxies, which is seen to evolve with redshift, we plot our , 4, and 5 LBG total (unobscured+obscured) SFRs versus stellar mass in Fig. 8, alongside observed correlations from –3 (Noeske et al. 2007; Elbaz et al. 2007; Daddi et al. 2008; Magdis et al. 2010a). When plotted in this way, our data show that LBGs at , 4, and 5 indeed demonstrate a “main sequence” of star formation activity, with the most massive LBGs tending to have the highest overall SFRs, but again with the main sequence showing no (or little) further evolution in SFR for similarly massive LBGs from redshift 3 to 5.
Because we are not prone to dust obscuration effects in the submm (in contrast to the UV/OIR), we can place strong and definitive constraints on the submm background for the first time in this luminosity and redshift regime. We have estimated that LBGs at contribute 6–8 per cent of the 850 m background, which rises to 14–20 per cent once we have corrected for our narrow redshift slices across this range. To put this in perspective, the bright ( mJy) SMG555Here, we consider an SMG to be a galaxy with 1 mJy, since for the bulk of these sources, , which makes a natural dividing line between whether the submm or UV is more important energetically. population makes up 20–30% (e.g. Coppin et al. 2006; Weiss et al. 2009; Swinbank et al. 2014) of 850 m background, and the contribution from mJy SMGs peaks at per cent of the SFRD at (Wardlow et al., 2011). It was thought that if SMGs and LBGs are essentially the same population, but with LBGs just being fainter and more numerous, then LBGs could make up the rest of the “missing” submm background at 850 m (75–80 per cent; Adelberger & Steidel 2000). Our measurement shows that at LBGs with (dust-uncorrected) UV luminosities greater than contribute at most 20 per cent of the 850 m submm background, implying that the majority of the background is emitted at . Of course the remaining 50–60 per cent of the 850 m background, unaccounted for by SMGs and LBGs, could be feasibly contributed by star-forming galaxies at lower redshifts, e.g. BX/BMs at , or less UV/optically luminous “normal” galaxies (Smith et al. in preparation).
Now that we know the average 850 m flux of the LBG populations at different epochs, we can test this conjecture by looking at the amount of overlap of LBGs and SMGs in the 850 m number counts. Turning to the deepest and most tightly constrained 850 m number counts available from the cluster lensing fields of Zemcov et al. (2010), at our average detected stacked flux of mJy, we find that the surface density of 3 LBGs is per cent that of the detected SMGs. We find that the LBGs comprise increasingly smaller fractions of the SMG population as we probe to higher 850 m fluxes, namely per cent at mJy for the LBGs and per cent at mJy for the LBGs. It appears that we are finally starting to see a unifying link between the LBG and SMG populations, with LBGs becoming increasingly important contributors to the submm background as we probe down into the sub-mJy regime. Note that some classical SMGs are also LBGs, or at least have UV/optical properties consistent with LBGs (Chapman et al. 2005; Simpson et al. 2014), again indicating overlap between the populations. Further progress in unifying the SMG and LBG populations can be made by examining our candidate SMG-LBG counterparts, which will appear in a future paper.
We also find that the submm flux increases with LBG optical faintness and redness – that is to say, LBGs appear to be dustier and redder on average as they become more optically faint. This may seem at odds with Shapley et al. (2001), who claim that more intrinsically luminous LBGs appear to be dustier, with redder colours. But recall that our UV-SFRs have not been corrected for dust attenuation, so their intrinsic luminosities will be higher once the obscured SFRs (as measured in the submm) have been factored in. Submm flux can be taken as a proxy for the bolometric luminosity of an LBG666This is so because of an effect called the negative -correction, which applies for a galaxy of a given luminosity from 1–8 (Blain et al., 2002).. So in fact, we do see that the most bolometrically luminous LBGs (as traced in the submm) contain the most dust (by definition) and have redder optical colours on average, but these are not the most optically luminous LBGs. Surveys trying to detect LBGs in the submm individually should therefore focus on the optically faintest and/or reddest LBGs.
5 Conclusions
We have presented an 850 m stacking analysis of LBG samples at , 4, and 5, to measure the average rest-frame far-infrared (150–200 m) luminosity of “normal” galaxies in the first 1–2 Gyr after the Big Bang. We have several main findings:
-
1.
The average 850 m flux density of LBGs is 0.2–0.9 mJy at – (increasing with redshift), and they contribute up to 20 per cent of the submm background.
-
2.
Assuming reasonable templates for the broad (8–1000 m) infrared spectrum, the results imply that LBGs straddle the LIRG/ULIRG population, with – L⊙ (increasing with redshift). Our observed evolution of the IR luminosity density of LBGs is broadly consistent with model predictions.
-
3.
We see a positive correlation between submm flux density and stellar mass: the most massive LBGs at all three epochs are the brightest at 850 m. But we do not see evidence in our data for a continued strong evolution of the main sequence of star formation from –5.
-
4.
We have determined that for a fixed mass, the optically reddest LBGs are the most submm luminous (i.e. are the most dust-obscured, by definition), and that the average submm luminosity-to-UV luminosity ratio increases with mass.
These results provide an empirical baseline to motivate and guide future direct detection and mapping experiments with the Atacama Large Millimeter Array (ALMA). ALMA will achieve the sensitivities required to detect the dust continuum in typical individual LBGs in order to fully characterize these sources which are contributing to the submm background.
Acknowledgements
KEKC thanks the Science and Technology Facilities Council of the United Kingdom (STFC) and JEG thanks the Royal Society for a University Research Fellowship. JSD acknowledges the support of the European Research Council via the award of an Advanced Grant, the support of the Royal Society via a Wolfson Research Merit Award, and the contribution of the EC FP7 SPACE project ASTRODEEP (Ref.No: 312725). AK acknowledges support by the Collaborative Research Council 956, sub-project A1, funded by the Deutsche Forschungsgemeinschaft (DFG). We would like to thank Alexandra Pope for useful discussions regarding stacking of clustered populations and Martin Hardcastle for suggesting to perform the radio stack. This work is based on observations carried out with SCUBA-2 on the James Clerk Maxwell Telescope (JCMT). The James Clerk Maxwell Telescope is operated by the Joint Astronomy Centre on behalf of the STFC, the National Research Council of Canada, and (until 31 March 2013) the Netherlands Organisation for Scientific Research. Additional funds for the construction of SCUBA-2 were provided by the Canada Foundation for Innovation.
References
- Adelberger & Steidel (2000) Adelberger K.L., Steidel C.C., 2000, ApJ, 544, 218
- Adelberger et al. (2005) Adelberger K. L., Steidel C. C., Pettini M., Shapley A. E., Reddy N. A., Erb D. K., 2005, ApJ, 619, 697
- Baker et al. (2001) Baker A.J., Lutz D., Genzel R., Tacconi L.J., Lehnert M.D., 2001, A&A, 372, L37
- Baugh et al. (2005) Baugh C.M., Lacey C.G., Frenk C.S., Granato G.L., Silva L., Bressan A., Benson A.J., Cole S., 2005, MNRAS, 356, 1191
- Bertin & Arnouts (1996) Bertin E., Arnouts S., 1996, A&AS, 317, 393
- Béthermin et al. (2011) Béthermin M., Dole H., Lagache G., Le Borgne D., Penin A., 2011, A&A, 529, 4
- Blain et al. (2002) Blain A.W., Smail I., Ivison R.J., Frayer D.T., 2002, PhR, 369, 111
- Bouwens et al. (2007) Bouwens R.J., Illingworth G.D., Franx M., Ford H., 2007, ApJ, 670, 928
- Brammer, van Dokkum & Coppi (2008) Braammer G.B., van Dokkum P.G., Coppi P., 2008, ApJ, 686, 1503
- Bruzual (2007) Bruzual G., 2007, in ASP Conf. Ser. 374, From Stars to Galaxies: Building the Pieces to Build up the Universe, ed., A. Vallenari et al. (San Francisco, CA: ASP), 303
- Burgarella et al. (2013) Burgarella D., et al., ApJ, 734, L12
- Carilli et al. (2011) Carilli C.L., Hodge J., Walter F., Riechers D., Daddi E., Dannerbauer H., Morrison G.E., 2011, ApJ, 739, L33
- Chapin et al. (2013) Chapin E.L., Berry D.S., Gibb A.G., Jenness T., Scott D., Tilanus R.P.J., Economou F., Holland W.S., 2013, MNRAS, 430, 2545
- Chapman et al. (2000) Chapman S.C. et al., 2000, MNRAS, 319, 318
- Chapman et al. (2005) Chapman S.C., Blain A.W., Smail, I., Ivison R.J., 2005, ApJ, 622, 772
- Chapman & Casey (2009) Chapman S.C., Casey C.C., 2009, MNRAS, 398, 1615
- Chary & Elbaz (2001) Chary R., Elbaz D., 2001, ApJ, 556, 562
- Chary & Pope (2010) Chary R., Pope A., 2010, arXiv e-prints (1003.1731)
- Coppin et al. (2006) Coppin K.E.K. et al., 2006, MNRAS, 372, 1621
- Cowie et al. (1996) Cowie, L. et al. 1996, AJ, 112, 839
- Daddi et al. (2008) Daddi E., Dannerbauer H., Elbaz D., Dickinson M., Morrison G., Stern D., Ravindranath S., 2008, ApJ, 673, L21
- Davies et al. (2012) Davies L.J.M., Bremer M.N., Stanway E.R., Mannering E., Lehnert M.D., Omont A., 2012, MNRAS, 425, 153
- Davies et al. (2013) Davies L.J.M., Bremer M.N., Stanway E.R., Lehnert M.D., 2013, MNRAS, 433, 2588
- Dempsey et al. (2013) Dempsey J.T. et al., 2013, MNRAS, 430, 2534
- Devlin et al. (2009) Devlin M. J. et al., 2009, Nat., 458, 737
- Draine et al. (2007) Draine B.T. et al., 2007, ApJ, 663, 866
- Elbaz et al. (2007) Elbaz D., et al., 2007, A&A, 468, 33
- Fazio et al. (2004) Fazio G. G. et al., 2004, ApJS, 154, 10
- Fixsen et al. (1998) Fixsen D.J., Dwek E., Mather J.C., Bennel C.L., Shafer R.A., 1998, ApJ, 508, 123
- Furusawa et al. (2008) Furusawa H. et al., 2008, ApJS, 176, 1
- Geach et al. (2013) Geach J.E. et al., 2013, MNRAS, 432, 53
- Hartley et al. (2013) Hartley W.G. et al., 2013, MNRAS, 431, 3045
- Hauser & Dwek (2001) Hauser M.G. & Dwek, E., ARA&A, 2001, 39, 249 S. et al., 2013, MNRAS, 429, 1113
- Heinis et al. (2013) Heinis S. et al., 2013, MNRAS, 429, 1113
- Holland et al. (2013) Holland W.S. et al., 2013, MNRAS, 430, 2513
- Huang et al. (2005) Huang J.-S. et al., 2005, ApJ, 634, 137
- Huang et al. (2007) Huang J.-S. et al., 2007, ApJ, 660, L69
- Ivison et al. (2010) Ivison R.J. et al., 2010, A&A, 518, L35
- Jenness et al. (2008) Jenness T., Cavanagh B., Economou F., Berry D.S., 2008, ASPC, 394, 565
- Kennicutt (1998) Kennicutt R.C. Jr., 1998, ARA&A, 36, 189
- Knudsen et al. (2008) Knudsen K.K., van der Werf P.P., Kneib J.-P., 2008, MNRAS, 384, 1611
- Kriek et al. (2006) Kriek M. et al., 2006, ApJ, 645, 44
- Kurczynski & Gawiser (2010) Kurczynski P., Gawiser E., 2010, AJ, 139, 1592
- Lagache, Puget & Dole (2005) Lagache G., Puget J.-L., Dole H., 2005, ARA&A, 43, 727
- Laird et al. (2006) Laird E.S., Nandra K., Hobbs A., Steidel C.C., 2006, MNRAS, 373, 217
- Lawrence et al. (2007) Lawrence A. et al., 2007, MNRAS, 379, 1599
- Lee et al. (2012) Lee K., Alberts S., Atlee D., Dey A., Pope A., Jannuzi B.T., Reddy N., Brown M.J.I., 2012, ApJL, 758, L31
- Noeske et al. (2007) Noeske K.G., et al., 2007, ApJ, 660, L43
- Magdis et al. (2008) Magdis G.E., Rigopoulou D., Huang, J.-S., Fazio G.G., Willner S.P., Ashby M.L.N., 2008, MNRAS, 386, 11
- Magdis et al. (2010a) Magdis G.E., Rigopoulou D., Huang J.-S., Fazio G.G., 2010a, MNRAS, 401, 1521
- Magdis et al. (2010b) Magdis G.E., et al., 2010b, ApJ, 720, L185
- McLure et al. (2009) McLure R.J., Cirasuolo M., Dunlop J.S., Foucaud S., Almaini O., 2009, MNRAS, 395, 2196
- Meurer, Heckman & Calzetti (1999) Meurer G. R., Heckman T. M., Calzetti D., 1999, ApJ, 521, 6
- Mortlock et al. (2013) Mortlock A. et al., 2013, MNRAS, 433, 1185
- Oliver et al. (2012) Oliver S.J., et al., 2012, MNRAS, 424, 1614
- Oteo et al. (2013) Oteo I. et al., 2013, A&A, 554, L3
- Ouchi et al. (2004) Ouchi M., et al., 2004, ApJ, 611, 660
- Pascale et al. (2009) Pascale E. et al., 2009, ApJ, 707, 1740
- Peacock et al. (2000) Peacock J. et al., 2000, MNRAS, 318, 535
- Puget et al. (1996) Puget J.L., Abergel A., Bernard J.P., Boulanger F., Burton W.B., Desert F.X., Hatmann D., 1996, A&A, 308, L5
- Reddy et al. (2006) Reddy N.A. et al., 2006, ApJ, 644, 792
- Reddy & Steidel (2009) Reddy N.A. & Steidel C.C., 2009, ApJ, 692, 778
- Reddy et al. (2012) Reddy N.A. et al., 2012, ApJ, 744, 154
- Rieke et al. (2004) Rieke G. H. et al., 2004, ApJS, 154, 25
- Rieke et al. (2009) Rieke G.H., Alonso-Herrero A., Weiner B.J., Pérez-González P.G., Blaylock M., Donley J.L., Marcillac D., 2009, ApJ, 518, L25
- Rigopoulou et al. (2006) Rigopoulou D. et al., 2006, ApJ, 648, 81
- Rigopoulou et al. (2010) Rigopoulou D. et al., 2010, MNRAS, 409, L7
- Rodighiero et al. (2010) Rodighiero G. et al., 2010, A&A 515, A8
- Roseboom et al. (2010) Roseboom I.G. et al., 2010, MNRAS, 409, 48
- Salpeter (1955) Salpeter E.E., 1955, ApJ, 121, 161
- Serjeant et al. (2010) Serjeant S. et al., 2010, A&A, 518, L7
- Shapley et al. (2001) Shapley A.E., Steidel C.C., Adelberger K.L., Dickinson M., Giavalisco M., Pettini M., 2001, ApJ, 562, 95
- Shapley et al. (2005) Shapley A.E., Steidel C.C., Erb D.K., Reddy N.A., Adelberger K.L., Pettini M., Barmby P., Huang J., 2005, ApJ, 626, 698
- Simpson et al. (2006) Simpson C.J. et al., 2006, MNRAS, 372, 741
- Simpson et al. (2012) Simpson C.J. et al., 2012, MNRAS, 421, 3060
- Simpson et al. (2014) Simpson J.M. et al., 2014, ApJ, 788, 125
- Somerville, Primack & Faber (2001) Somerville R.S., Primack J.R., Faber S.M., 2001, MNRAS, 320, 504
- Spergel et al. (2003) Spergel D.N. et al., 2003, ApJS, 148, 175
- Stanway et al. (2010) Stanway E.R., Bremer M.N., Davies L.J.M., Lehnert M.D., 2010, MNRAS, 407, L94
- Stark et al. (2009) Stark D.P., Ellis R.S., Bunker A., Bundy K., Targett T., Benson A., Lacy M., 2009, ApJ, 697, 1493
- Steidel & Hamilton (1993) Steidel C.C. & Hamilton D., 1993, AJ, 105, 2017
- Steidel et al. (1996) Steidel C.C., Giavalisco M., Pettini M., Dickinson M., Adelberger K.L., 1996, ApJ, 462, L17
- Steidel et al. (1999) Steidel C.C., Adelberger K.L., Giavalisco M., Dickinson M., Pettini M., 1999, ApJ, 519, 1
- Steidel et al. (2002) Steidel C.C., M.P. Hunt, Shapley A.E., Adelberger K.L., Pettini M., Dickinson M., Giavalisco M., 2002, ApJ, 576, 653
- Swinbank et al. (2014) Swinbank A.M. et al., 2014, MNRAS, 438, 1267
- Ueda et al. (2008) Ueda et al., 2008, ApJS, 179, 124
- van Dokkum et al. (2006) van Dokkum P.G. et al., 2006, ApJ, 638, L59
- Verma et al. (2007) Verma A., Lehnert M.D., Förster Schreiber N.M., Bremer M.N., Douglas L., 2007, MNRAS, 377, 1024
- Viero et al. (2013) Viero M.P. et al., 2013, ApJ, 779, 32
- Wardlow et al. (2011) Wardlow J.L. et al., 2011, MNRAS, 415, 1479
- Webb et al. (2003) Webb T.M.A. et al., 2003, ApJ, 582, 6
- Weiss et al. (2009) Weiss A. et al., 2009, ApJ, 707, 1201
- Zemcov et al. (2010) Zemcov M., Blain A., Halpern M., Levenson L., 2010, ApJ, 721, 424