Analysis of Yelp Reviews
Abstract
In the era of Big Data and Social Computing, the role of customer reviews and ratings can be instrumental in predicting the success and sustainability of businesses. In this paper, we show that, despite the apparent subjectivity of user ratings, there are also external, or objective factors which help to determine the outcome of a business’s reviews. The current model for social business review sites, such as Yelp, allows data (reviews, ratings) to be compiled concurrently, which introduces a bias to participants (Yelp Users). Our work examines Yelp Reviews for businesses in and around college towns. We demonstrate that an Observer Effect causes data to behave cyclically: rising and falling as momentum (quantified in user ratings) shifts for businesses.
1 Introduction
Social networks undoubtedly play an important role in influencing which businesses consumers spend their money at. Consumers consult various sites for reviews before making decisions, such as consumer reports, Zagat Review, and other review sites, before making a choice where to spend their money. Since the advent of Web 2.0—and various social sites, forums, etc —getting reviews and feedback has become much easier. It follows, with this recent technology, consumers face a new problem in the form of reliability and trustworthiness of reviews. There exists the real possibility that businesses could manipulate ratings and reviews—directly and/or indirectly—causing the information that consumers rely on for good advice, to be misleading.
Another aspect of this problem comes in the form of Scholarly papers, and their ratings: either by citation counts and/or reviews. There also exists the pontial for abuse of this rating system among papers [1], [3],[4] and [2], however, this is restricted to a small academic community. Book and movie ratings are largely still done by established institutions, and thus the impact of online ratings and reviews is minimized when compared to the previous two examples [5][6]. This is exemplified by various well-established entities, such as the Oprah Book Club and the New York Times, which have an enormous amount of influence in the area of book and film reviews. Moreover, most online purchases of books are deliberate, or premeditated, when compared to “spur of the moment” decisions for dining choices in a college town. There have been a number of scholarly papers written extolling the virtues of on-line publication and reviews; and there are an equal number of scholarly papers extolling the virtues of traditional publications, and condeming the biased peer reviews. The arguments for traditional publication include that peer reviews cannot be replaced by blogs, twitter or anything else - because of the slow, deliberative process that emphasizes thoughtful scholarship behind traditional publication in journals.[8]
Restaurants (especially in a college town) generally have a very short life span. Unless the restaurant is a chain, almost half of restaurant businesses may not last for more than 4 years [9]. This scenario is also typical of many small businesses [10]. According to BBC news [11], only 74 companies of the S&P 500 companies survived for more than 40 years. With so much uncertainty in college towns, it is often difficult to for a family business to continue past one generation. Liua et al[12] analyzes fast-food restaurant franchise data as an example for Data mining on a time series. Their work examines the impact of periodic behavior on their model.
There have been a series of articles and papers on Yelp http://www.yelp.com) Reviews. Luca[13] presents two findings: (1) That a one star increase in Yelp rating increases the revenue by 5 to 9 percent. (2) Chain Restaurant market has decreased as a result of Yelp penetration. Blanding[14] applauds features in Yelp in which reviewers have public profiles (as in Amazon, but not in Trip Advisor http://www.tripadvisor.com). However, according to [13], Trip Advisor provides more extensive options for sorting and categorizing reviews. A New York times blog [15] cites that 2.5% of all users in March 2008 went to Yelp (http://www.yelp.com) and the traffic has quadrupled since 2007. According to Alexa (http://ww.alexa.com) Yelp is ranked 27th in US, and ranked 132 globally as of June 19, 2014. According to Google Trends http://www.google.com/trends/, interest in Yelp peaked in 2011, and as of May 2014, has an overall interest of 59. Yelp provides a level playing field for small restaurants, which may not be able to afford paying mass advertisement. To improve the trustworthiness of the reviews, Yelp has introduced a Review Filter system [16]. They employ an algorithmic filter mechanism, whose purpose is to protect consumers and business owners from fake, shill and malicious reviews.
In this paper we analyze the data that was supplied for twenty campus restaurant locations over a period of 7 years. We provide a simple spring (device) like model to explain the behavior of Yelp ratings from 2005 to 2011. We provide an experimental validation by taking five different restaurant locations around geographically diverse college campuses. Lastly, we explain how our model fist with the ratings that were given in Yelp reviews.
2 Model and Data
As previously stated, the Yelp Academic Dataset provides users reviews for 7 years from 2005 to 2011 for a select set of university campuses and neighborhood restaurants. The universities include:
-
1.
Brown University
-
2.
California Institute of Technology
-
3.
California Polytechnic State University
-
4.
Carnegie Mellon University
-
5.
Columbia University
-
6.
Cornell University
-
7.
Georgia Institute of Technology
-
8.
Harvard University
-
9.
Harvey Mudd College
-
10.
Massachusetts Institute of Technology
-
11.
Princeton University
-
12.
Purdue University
-
13.
Rensselaer Polytechnic Institute
-
14.
Rice University
-
15.
Stanford University
-
16.
University of California - Los Angeles
-
17.
University of California - San Diego
-
18.
University of California at Berkeley
-
19.
University of Illinois - Urbana-Champaign
-
20.
University of Maryland - College Park
-
21.
University of Massachusetts - Amherst
-
22.
University of Michigan - Ann Arbor
-
23.
University of North Carolina - Chapel Hill
-
24.
University of Pennsylvania
-
25.
University of Southern California
-
26.
University of Texas - Austin
-
27.
University of Washington
-
28.
University of Waterloo
-
29.
University of Wisconsin - Madison
-
30.
Virginia Tech
In this paper first we examine how ratings influence the quality of restaurants, and the cyclical nature of this behavior. We assume that to produce quality food, one has to continue to invest money on production, service and advertisement. However once the service is established and good ratings are obtained, continued investment on the components that contribute to the quality may drop. This results in a lower rating resulting in investment, and thereby improving the quality.
We use a differential equation to model the ratings/quality of restaurants over a period of time. The solution to the linear second order differential equation describes the various features that we have observed in reviews over the years. The collective reviews converge on a stable value (number), and individual restaurant reviews tend to demonstrate periodic behavior. The right hand side is a demand (or the number of users) to the restaurant, and we use three constants to model damping, average number of customers and the resilience of the restaurant.
A linear second order differential equation with appropriate initial conditions describes the motion of a spring. is the unit stretched from normal length, is the spring constant, is the mass, the damping factor and is a forcing function. In this research we use a similar model to explore the relationship between the services or the food quality, denoted by ,of a restaurant (We assume a relationship between and the ratings ). The pull or, increase in the number of the customers, puts a strain on the restaurant, just as it would a physical spring. In springs, one uses Newton’s second law of motion to arrive at the second order differential equation. In restaurants, one can use the law of conservation of the number of customers in the above function. The variable in restaurants, represents the change in ratings (result of change in service/quality). The solution of this second order differential equation is either convergent, oscillatory or divergent depending upon the values of and .
In the case of restaurants, we know the solution, i.e., the rating, can never diverge (as the maximum rating is 5 and the minimum rating is 1). We predict that the individual restaurant reviews will be periodic: that the damping factor will be very small.
For example, the solution to the differential equation, for values of to be 1 and to be 10, and to be 5, demonstrates periodic behavior. Since each individual restaurant has shows periodic behavior, we expect that the cumulative reviews will converge. We provide only a qualitative evidence and not a quantitative evidence (by finding appropriate values for the parameters of the differential equation and initial conditions).
However, there is an additional factor that complicates. Even though each restaurant service/rating may be modeled as a second order differential equations, these equations are coupled. This is the result of a free flow of capital, i.e., chefs, among these restaurants. In our framework, we assume that these differential equations are uncoupled.
If there are larger number of reviews/ratings for a few restaurants, we expect that the number of ratings follow a power law. This is similar to the power law feature in many social sciences networks [17],[18]. We plot the number of reviews/ratings in log-log scale to illustrate the powerlaw.
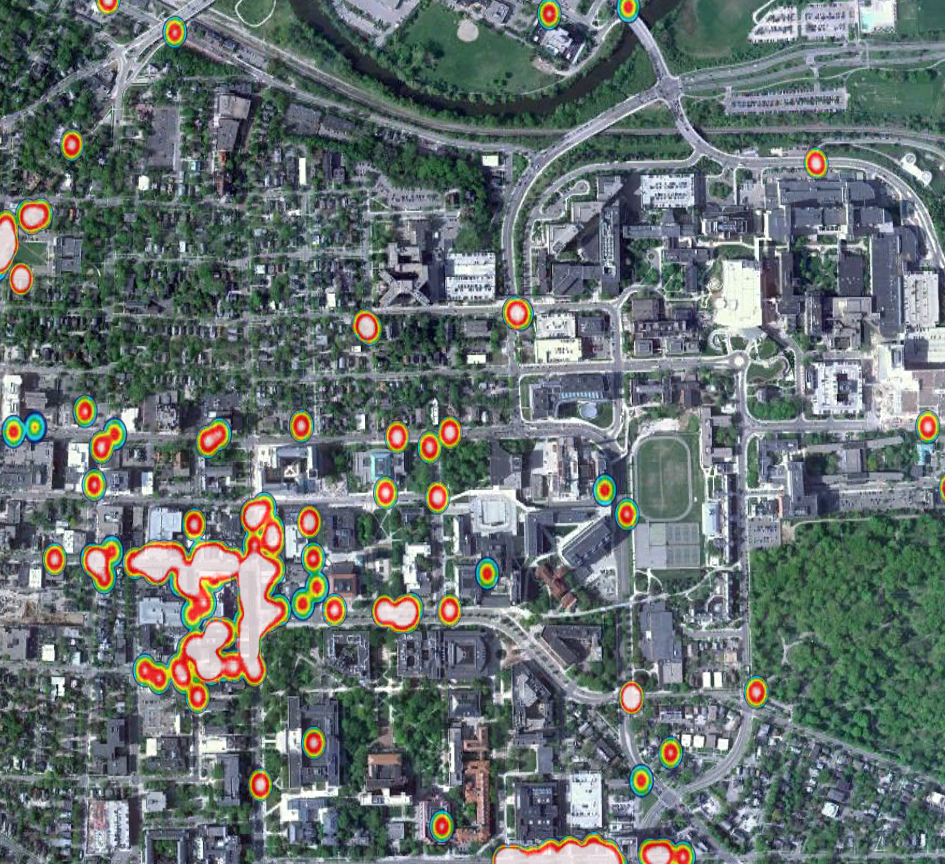
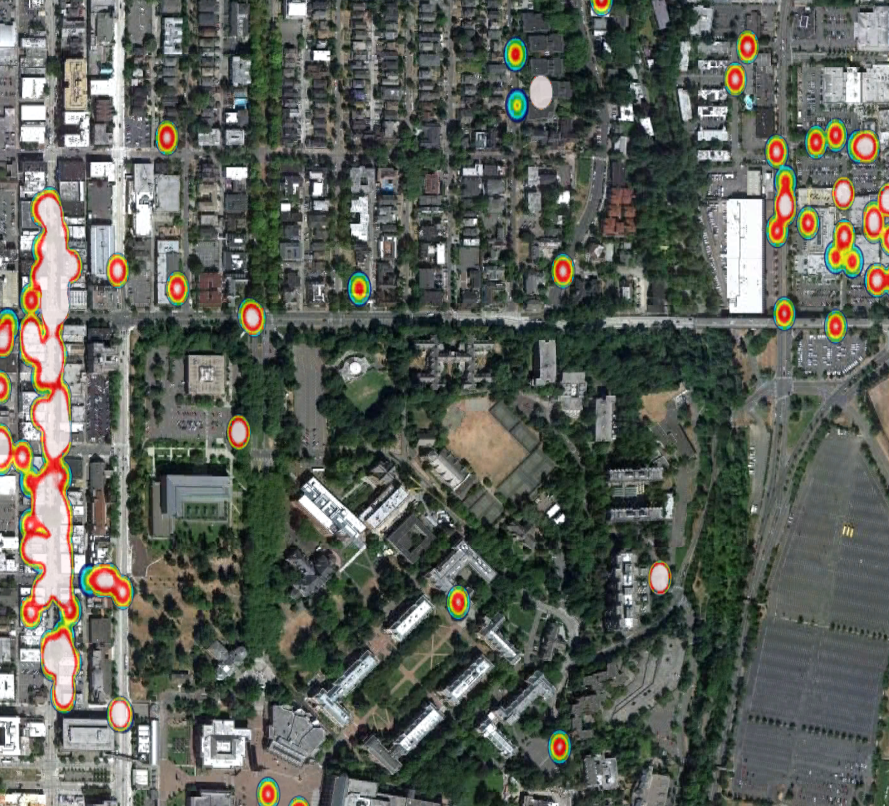
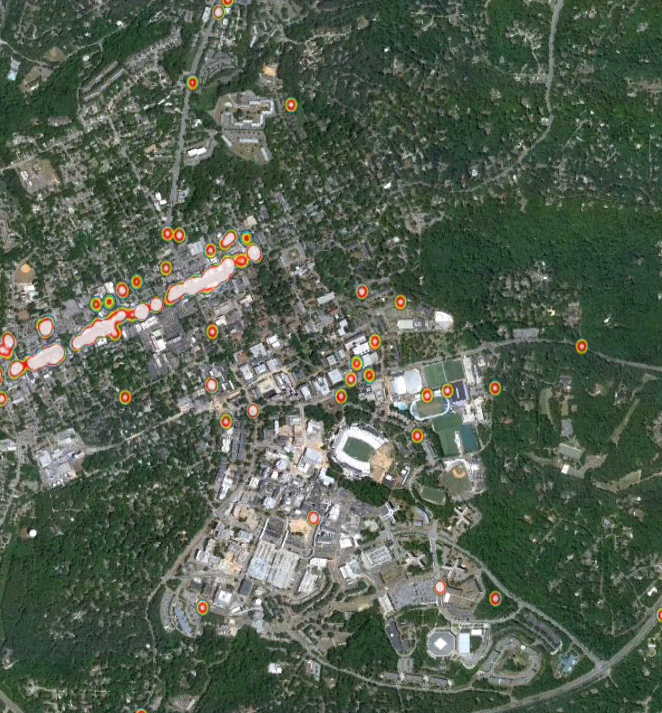
We provide heat maps of where most reviewed restaurants are located. The aim of this is to show that most reviewed restaurants are usually clustered together. This is an intuitive results, given that consumers have the option of choosing another (equally good) restaurant if the originally chosen restaurant is crowded.
We have specifically focused on the wide fluctuation of ratings (based on quality and service) of restaurants around Troy, NY over the period of time studied. The restaurant names, and the number of reviews for each restaurant are listed next in table 1 (sorted by the most reviewed ones first). For the sake of brevity, we have restricted the listing to only 30 names. However, our analysis includes the all the restaurants and services (a total of 158 restaurants and services). Even though we have tried to clean the data, more work is needed in this regard(i.e. some restaurant names are repeated).
| Name of the Restaurant | Total Number of Reviews |
|---|---|
| Browns Brewing Co.: The Taproom | 76 |
| Dinosaur Bar-B-Que | 62 |
| Famous Lunch | 38 |
| DeFazio’s Pizzeria | 37 |
| Jose Malones | 34 |
| Ali Baba | 29 |
| The Ruck | 28 |
| I Love NY Pizza | 26 |
| Snowman | 23 |
| Shalimar Restaurant | 23 |
| Flavour Cafe Lounge | 23 |
| X’s To O’s Vegan Bakery | 22 |
| Plum Blossom Chinese Restaurant | 21 |
| Ale House | 21 |
| Beirut Restaurant | 19 |
| Troy Market | 18 |
| Illium Cafe | 17 |
| Spill’n the Beans Coffeehouse Bistro | 16 |
| Daisy Baker’s | 15 |
| Bacchus | 15 |
| Red Front Restrnt Tavern | 14 |
| Sushi King | 13 |
| Country View Diner | 13 |
| The Greek House | 12 |
| Muza | 12 |
| Manory’s Restaurant | 12 |
| Francesca’s | 12 |
| The Placid Baker | 11 |
| South End Tavern | 11 |
| Lo Porto’s | 11 |
The number of ratings appears to follow a power law curve by Figure 1 Plot. (The X-axis represents the number of restaurants/services and the Y-axis represents the number of reviews)
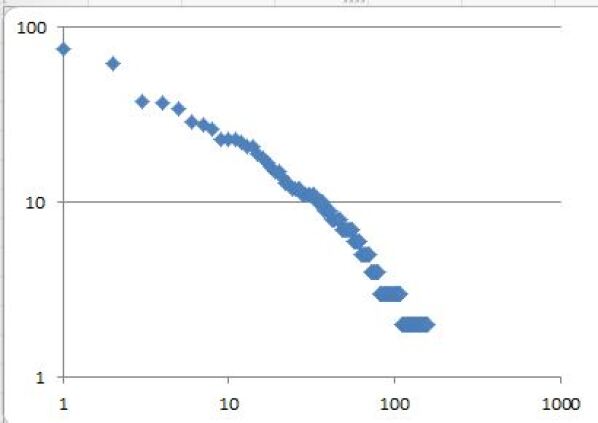
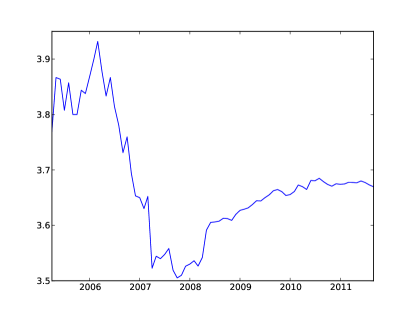
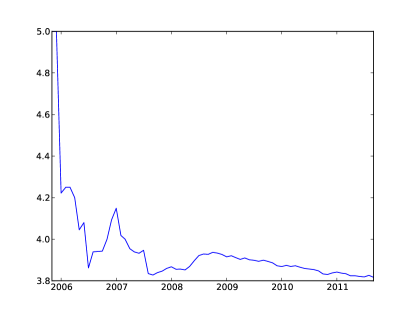
Table LABEL:tab:year_average gives the average rating for all restaurants near Troy. The overall average rating converges to an average of 3.75.
| Year | Average |
|---|---|
| 2005 | 3.5 |
| 2006 | 5.0 |
| 2007 | 3.85245901639 |
| 2008 | 3.66666666667 |
| 2009 | 3.91139240506 |
| 2010 | 3.83435582822 |
| 2011 | 3.7660944206 |
Figure 2 shows the Average rating over the time period 2005 to 2011.
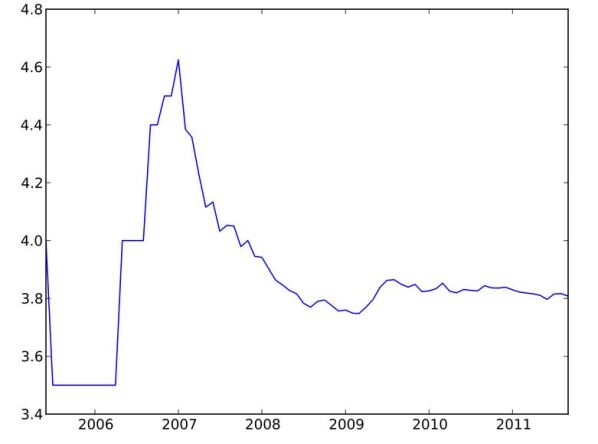
Figure 3 shows a heat map of where all these restaurants are located.
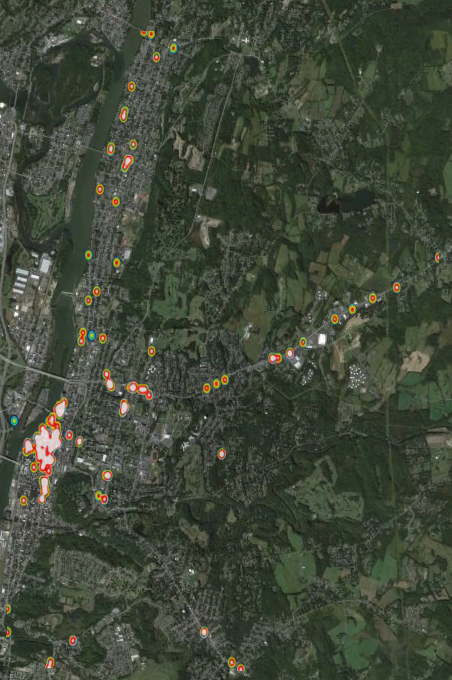
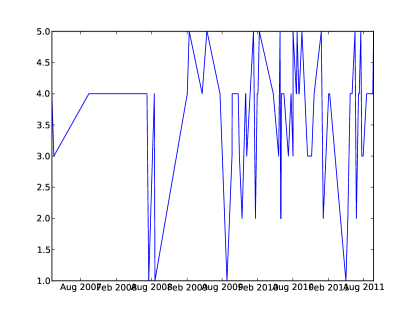
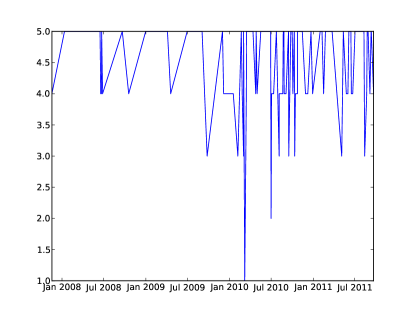
Figure 4 shows the periodic behavior of reviews for the business with the maximum number of reviews, Browns Brewing Co.: The Taproom.
3 Analysis of Data
The same model was applied on Yelp data from four (geographically) different college campuses. The four places analyzed are as follows:
-
1.
Ann Arbor, Michigan
-
2.
Manhattan (near Columbia University), New York City
-
3.
Seattle, Washington
-
4.
Raleigh, Chapel Hill and Durham, North Carolina
3.1 Ann Arbor
First we look at Ann Arbor (Home of University of Michigan) Listed below are the top restaurants and their review counts in table 2.
| Name of the Restaurant | Total Number of Reviews |
|---|---|
| Zingerman’s Delicatessen | 407 |
| Ashley’s | 147 |
| Madras Masala | 90 |
| Sava’s | 87 |
| Eve | 87 |
| Comet Coffee | 84 |
| Silvio’s Organic Pizza | 83 |
| Angelo’s Restaurant | 77 |
| New York Pizza Depot | 76 |
| Tomukun Noodle Bar | 71 |
| Sadako Japanese Restaurant | 66 |
| Tio’s Mexican Cafe | 65 |
| Bubble Island | 62 |
| Lab | 61 |
| Totoro | 58 |
| Red Hawk Bar Grill | 58 |
| Northside Grill | 58 |
| No Thai | 58 |
| Gandy Dancer Restaurant | 58 |
| Good Time Charley’s | 51 |
| Douglas J Aveda Institute Salon | 50 |
| Sushi.Come | 49 |
| Yamato | 48 |
| TK Wu | 48 |
| Bar Louie | 48 |
| Yogo Bliss | 45 |
| The Original Cottage Inn | 45 |
| Raja Rani Fine Indian Cuisine | 45 |
| Pita Kabob Grill | 45 |
| Amer’s Delicatessen | 45 |
| China Gate Restaurant | 44 |
| Panchero’s Mexican Grill | 41 |
| Le Dog | 41 |
| Brown Jug | 40 |
The number of reviews again follow the Power Law, and is shown in figure 5, where the X-axis represents the number of restaurants/services and the y-axis the number of reviews.
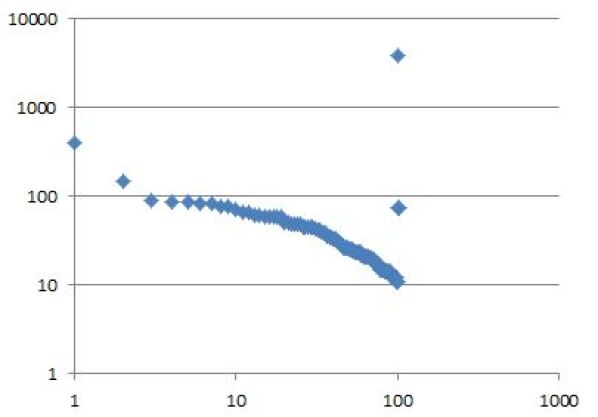
Figure 6 shows the Average rating from 2005 to 2011.
The results show that the average rating converges close to 3.7. Figure 7 heat map of where all these restaurants are located.
To show the cyclic behavior of the reviews for one restaurant, figure 8 shows the most reviewed restaurant, Zingerman’s Delicatessen.
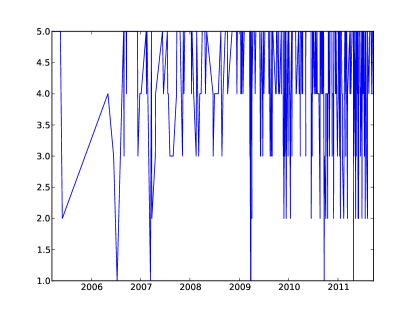
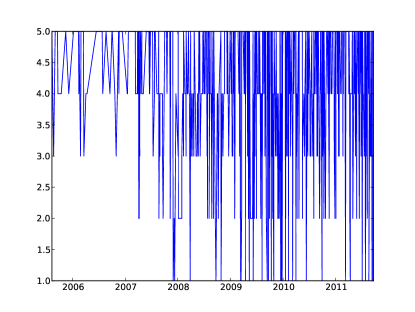
Fluctuations are obvious in the above figure, however some of the fluctuation may be due to noise. In order to reduce noise, the highest reviews were used.
3.2 Manhattan
Next, we look at Manhattan (Home of University of Columbia University) Listed below are the top restaurants and their review counts.
| Name of the Restuant | Total Number of Reviews |
|---|---|
| Koronet Pizza | 267 |
| Community Food Juice | 265 |
| Tom’s Restaurant | 216 |
| Kitchenette Uptown | 190 |
| Hungarian Pastry Shop | 185 |
| Max Soha | 160 |
| Havana Central | 155 |
| Melba’s | 151 |
| Society Coffee | 150 |
| Le Monde | 138 |
| Ollie’s | 135 |
| Miss Mamie’s Spoonbread Too | 129 |
| Deluxe on Broadway | 129 |
| Roti Roll - Bombay Frankie | 126 |
| Mel’s Burger Bar | 123 |
| Rack Soul | 117 |
| The Heights Bar Grill | 114 |
| Sip | 105 |
| Vareli | 94 |
| Mill Korean | 94 |
| Nussbaum Wu Bakery | 88 |
| M2M | 88 |
| Campo | 87 |
| Artopolis | 86 |
| The Village Pourhouse | 80 |
| Westside Market NYC | 77 |
| V T Pizzeria Restaurant | 77 |
| Harlem Tavern | 76 |
| Vine: Sushi Sake | 75 |
| Lion’s Head Tavern | 75 |
| Max Caf | 73 |
As seen on earlier two cities (Troy and Ann Arbor), the number of reviews follow a power law as shown in figure 9, where the X-axis represents the number of restaurants/services and the y-axis represents the number of reviews.
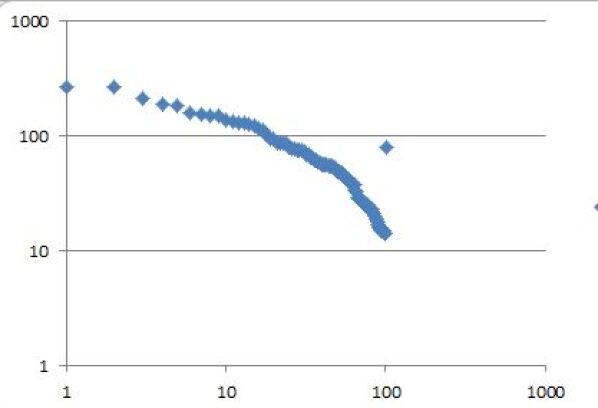
Figure 10 shows the average rating over from 2005 to 2011.
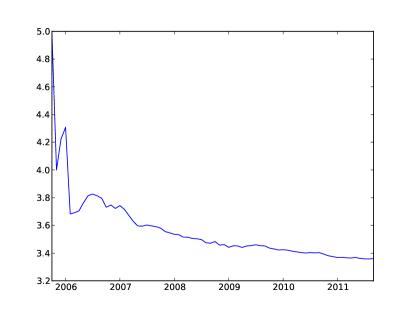
The results show that the average rating converges close to 3.4 for the restaurants in Manhattan (close to Columbia University). Figure 11 shows a heat map of where all these restaurants are located.
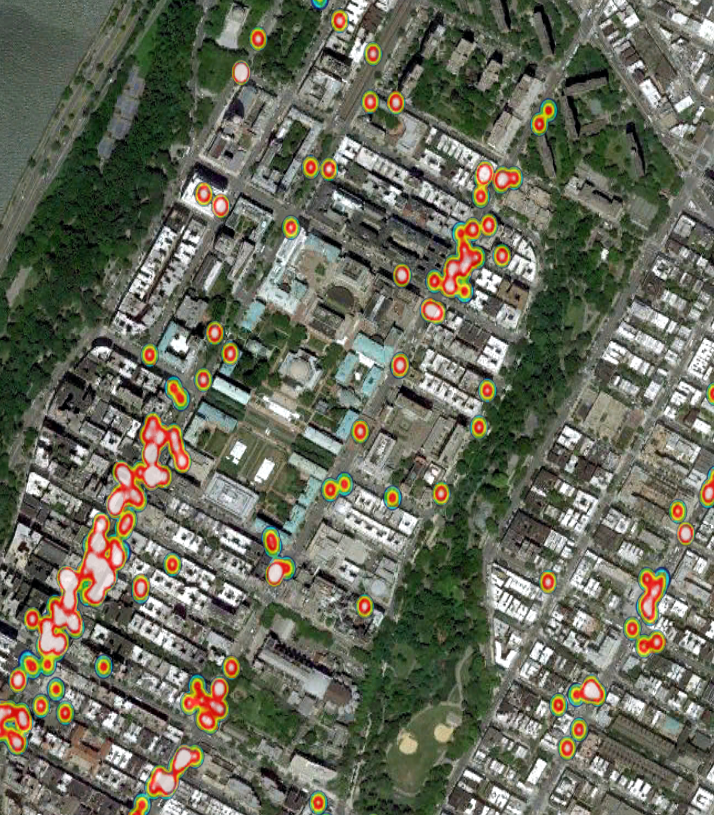
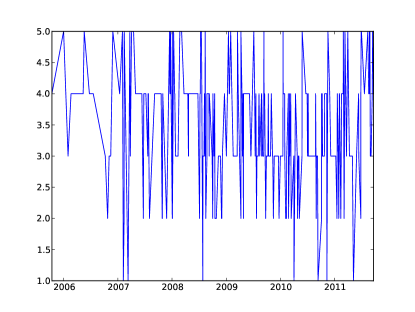
To show the cyclic behavior of the review of one restaurant, figure 12 shows the most reviewed restaurant, Koronet Pizza.
3.3 Seattle
Next, we look at Seattle (Home of University of Washington), located in the Pacific Northwest of the United States. Listed below are the top restaurants and their review counts.
| Name of the Restuant | Total Number of Reviews |
|---|---|
| Thai Tom | 680 |
| Blue C Sushi | 285 |
| Aladdin Gyro-Cery | 189 |
| Shultzy’s Sausage | 166 |
| Trabant Coffee Chai | 160 |
| Thanh Vi | 154 |
| Cafe Solstice | 148 |
| Aladdin Falafel Corner | 140 |
| Thaiger Room | 136 |
| Big Time Brewing Company | 129 |
| Flowers Bar Restaurant | 128 |
| Pho Than Brothers | 127 |
| Ugly Mug Caf | 126 |
| Chipotle | 125 |
| Cafe On The Ave | 119 |
| Samurai Noodle | 115 |
| Boom Noodle | 111 |
| Thai 65 | 110 |
| University Teriyaki | 108 |
| Sonrisa | 105 |
| Yunnie Bubble Tea | 102 |
| WOW Bubble Tea | 100 |
| Continental Restaurant Pastry Shop | 96 |
| Cedars | 93 |
| Buffalo Exchange | 92 |
| Sureshot | 90 |
| Jimmy John’s | 90 |
| Fran’s Chocolates | 90 |
As seen on earlier three cities (Troy, Ann Arbor and Manhattan), the number of reviews here follow a power law as shown in figure 13, where X-axis represents the number of restaurants/services and the y-axis represents the number of reviews.
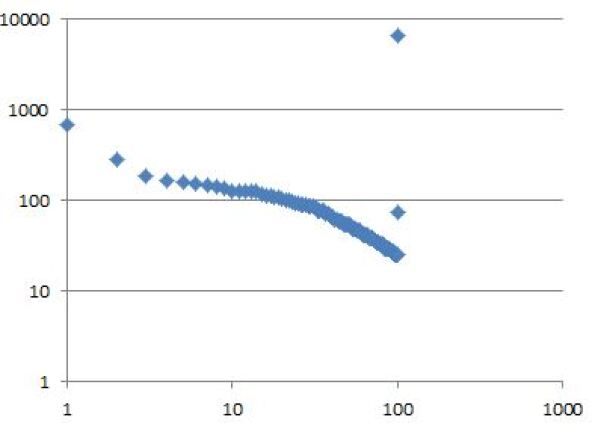
Figure 14 shows the Average rating from 2005 to 2011.
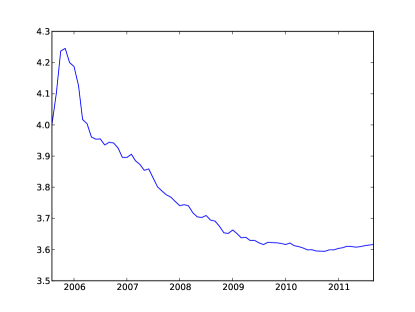
The results find that the average rating converges close to 3.6 for the restaurants in Seattle area (close to University of Washington). Figure 15 shows a heat map of where all these restaurants are located.
To show the cyclic behavior of the review of one restaurant, figure 16 shows the most reviewed restaurant, Thai Tom.
3.4 Raleigh, Chapel Hill and Durham
Lastly, we look at Raleigh, Chapel Hill and Durham (Home of North Carolina State University, University of North Carolina and Duke), located in East Coast of the United States. Listed below are the top restaurants and their review counts.
| Name of the Restuant | Total Number of Reviews |
|---|---|
| Mediterranean Deli Catering | 122 |
| Top of the Hill Restaurant Brewery | 110 |
| Lantern | 95 |
| Buns | 92 |
| Mama Dip’s Kitchen | 80 |
| Sandwhich | 78 |
| Pepper’s Pizza | 76 |
| 411 West | 74 |
| Mint | 70 |
| Crook’s Corner | 63 |
| Lime and Basil | 61 |
| Carolina Brewery | 59 |
| Sugarland | 57 |
| Vimala’s Curryblossom Cafe | 54 |
| Time-Out Restaurant | 52 |
| Elaine’s On Franklin | 48 |
| The Crunkleton | 47 |
| Ye Olde Waffle Shoppe | 45 |
| Penang | 43 |
| Cosmic Cantina | 43 |
| Foster’s Market | 40 |
| 35 Chinese Restaurant | 40 |
| Talullas | 39 |
| Italian Pizzeria III | 34 |
| Yogurt Pump | 33 |
| Sutton’s Drug Store | 33 |
| Spanky’s Restaurant | 32 |
| Local 506 | 32 |
| Linda’s Bar and Grill | 32 |
| Moshi Moshi | 31 |
| Jack Sprat Cafe | 30 |
The table below gives the average rating for all restaurants near Raleigh, Chapel Hill and Durham Area. The overall average rating converges to 3.75.
| Year | Average |
|---|---|
| 2005 | 4.22222222222 |
| 2006 | 4.13157894737 |
| 2007 | 3.75630252101 |
| 2008 | 3.93542757417 |
| 2009 | 3.76438356164 |
| 2010 | 3.80676328502 |
| 2011 | 3.7443324937 |
As seen on earlier four cities (Troy, Ann Arbor, Manhattan and Seattle), the number of reviews for this area follow the power law as shown in figure17, where X-axis represents the number of restaurants/services and the y-axis represents the number of reviews.
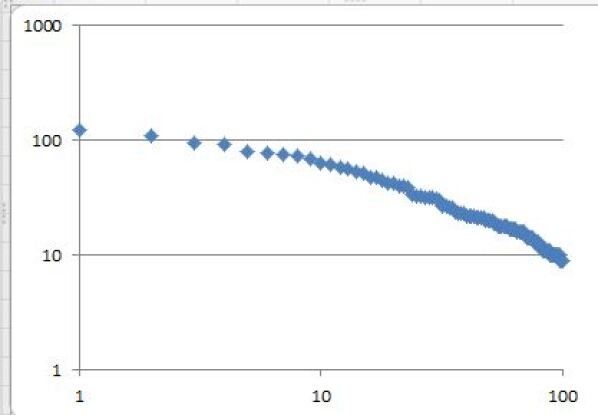
Figure 18 shows the Average rating from 2005 to 2011.
The results show the average rating converges close to 3.8 for the restaurants in Raleigh, Chapel Hill and Durham area (close to three Universities). Figure 19 shows a heat map of where all these restaurants are located.
To show the cyclical behavior of the reviews of one restaurant, figure 20 shows the most reviewed restaurant, Mediterranean Deli and Catering.
First we look at Ann Arbor (Home of University of Michigan) Listed below are the top restaurants and their review counts.
4 Discussions
The results presented in this paper demonstrate that the cumulative rating of restaurants as a whole converge, whereas the reviews of individual restaurants have fluctuating behavior. This phenomenon may also be explained as historical patterns repeat themselves. This phenomenon may also be explained by food preferences of college students, such as the preference for ethnic restaurants, and how top ethnicity food preferences may differ depending upon the regions. Pizza restaurants also appear as some of the most frequently rated restaurants, and by and large, they are the most common among all the campuses. Even though university sponsored restaurants appear in all the lists, they do not tend to be frequently reviewed. Frequently reviewed restaurants appear to be clustered close to each other. This may be due to attracting the overflow crowd, or just that these restaurants are situated in a popular area for dining.
The periodic behavior of an individual restaurant could may also be attributed to a lack of data (reviews) during a specific time period. We have posted the ratings of all (restricted to top 100) the restaurants (for the five locations we considered) in the following URL http://goo.gl/16bcnF as compressed zip files.
5 Acknowledgement
The third author wishes to thank Prof. G. M. Prabhu and Dr. J. Krishnamoorthy for their help in editing the paper. The third author also wishes to thank Prof. H. S. Mani for his help on the model. All three authors wish to thank Mr. Sean O’Sullivan ’85 for his generous donation to the Rensselaer Center for Open Source Software where this work originated.
References
- [1] http://scholar.google.com
- [2] Web Of Science, Thompson Reuters, http://wokinfo.com/
- [3] J. E. Hirsch, ”An index to quantify an individual’s scientific research output”, PNAS, Vol. 102, No. 46, pp. 16569.16572.
- [4] C. Labbè, ”Ike Antkare one of the great stars in the scientific firmament”, Universitè Joseph Fourier LIG Laboratory, 2010.
- [5] New York Review of Books http://www.nybooks.com/
- [6] http://www.rottentomatoes.com/
- [7] http;//www.amazon.com
- [8] D. J. Solomon, ”The Role of Peer Review for Scholarly Journals in the Information Age”, Vol. 10, No. 1, The Journal of Electronic Publishing, Winter 2007 http://quod.lib.umich.edu/j/jep/3336451.0010.107?view=text;rgn=main
- [9] Business Appraisal Blog http://www.businessappraisalblog.com/14/
-
[10]
Risky business: 44% of small firms reach Year 4
http://www.nbcnews.com/id/16872553/#.U6gaHPPD-70 - [11] BBC Report http://www.bbc.com/news/business-16611040
- [12] L. Liua, S. Bhattacharya, S.L. Sclovea, R. Chena and W. J. Lattyakb, ”Data Mining on Time Series: an illustration using fast-food restaurant franchise data”, Computational Statistics & Data Analysis, Vol. 37, No. 4, pp. 455-476.
- [13] M. Luca, ”Reviews, Reputation, and Revenue: The Case of Yelp.com”, Working Paper, HBS, 2011, http://hbswk.hbs.edu/item/6833.html
- [14] M. Blanding, ”The Yelp Factor: Are Consumer Reviews Good for Business?”, HBS, 2011, http://hbswk.hbs.edu/item/6836.html?wknews=10262011
- [15] D. Fost, ”The Coffee was Lousy. The Wait was Long”,http://www.nytimes.com/2008/05/21/business/smallbusiness/21yelp.html
- [16] J. Stoppleman, ”Why Yelp Has a Review Filter”, http://officialblog.yelp.com/2009/10/why-yelp-has-a-review-filter.html
- [17] M. E. J. Newman, ”Power laws, Pareto distributions and Zipf.s law”, Contemporary Physics, Vol. 46, 2005, pp. 323-351 http://arxiv.org/abs/cond-mat/0412004.
- [18] A. Barabási, R. Albert, ”Emergence of scaling in random networks”, Science vol. 286 No.5439, pp. 509.512.