Millisecond Pulsar Scintillation Studies with LOFAR:
Initial Results
Abstract
High-precision timing of millisecond pulsars (MSPs) over years to decades is a promising technique for direct detection of gravitational waves at nanohertz frequencies. Time-variable, multi-path scattering in the interstellar medium is a significant source of noise for this detector, particularly as timing precision approaches 10 ns or better for MSPs in the pulsar timing array. For many MSPs the scattering delay above 1 GHz is at the limit of detectability; therefore, we study it at lower frequencies. Using the LOFAR (LOw-Frequency ARray) radio telescope we have analyzed short (5–20 min) observations of three MSPs in order to estimate the scattering delay at 110–190 MHz, where the number of scintles is large and, hence, the statistical uncertainty in the scattering delay is small. We used cyclic spectroscopy, still relatively novel in radio astronomy, on baseband-sampled data to achieve unprecedented frequency resolution while retaining adequate pulse phase resolution. We detected scintillation structure in the spectra of the MSPs PSR B1257+12, PSR J1810+1744, and PSR J2317+1439 with diffractive bandwidths of , , and kHz, respectively, where the estimate for PSR J2317+1439 is reliable to about a factor of 2. For the brightest of the three pulsars, PSR J1810+1744, we found that the diffractive bandwidth has a power-law behavior , where is the observing frequency and , consistent with a Kolmogorov inhomogeneity spectrum. We conclude that this technique holds promise for monitoring the scattering delay of MSPs with LOFAR and other high-sensitivity, low-frequency arrays like SKA-Low.
Subject headings:
ISM: structure — pulsars: individual (PSR B1257+12, PSR J1810+1744, PSR J2317+1439) — techniques: spectroscopic1. Introduction
The effort to detect gravitational waves with an array of millisecond pulsars (MSPs) continues to gain momentum. One example of the maturity of this effort is the special focus issue of Classical and Quantum Gravity (Bizouard et al. 2013), comprised of 16 articles on Pulsar Timing Arrays (PTAs) that detail their promise, current status, and major challenges. One substantial challenge is correcting for time-varying propagation delays due to passage of the radio waves through the partially ionized interstellar medium (ISM; Stinebring 2013). The motion of the pulsar, ISM, and the Earth all contribute to the time variability of various propagation delays, with different weighting for each type of delay. Frequency-dependent () dispersion, quantified by the dispersion measure (DM), produces the largest time delay of typically tens to hundreds of ms at 1 GHz, depending on the pulsar. Because this is such a large effect compared to the 10 ns timing correction goal that is commonly pursued, all three PTAs — the North American Nanohertz Observatory for Gravitational Waves, the European Pulsar Timing Array, and the Parkes Pulsar Timing Array — employ active DM-variability mitigation schemes (Demorest et al. 2013; Lee et al. 2014; Keith et al. 2013) .
The second-most-important delay, that due to multi-path scattering, is generally not corrected for in timing efforts at frequencies near 1 GHz. The approximately dependence of this delay makes it less important as a direct effect. For small scattering time delays , where is the pulse width, the main effect is to delay the arrival of the pulse by , with negligible time-smearing (Hemberger & Stinebring 2008; Coles et al. 2010). Nonetheless, as we move towards timing pulsars at the 10-ns level of precision, it is important to begin estimating and correcting for this delay. One should also consider indirect effects of scattering delay on precision pulsar timing. For example, DMs to pulsars included in the PTAs are determined by multiple-frequency observations, including frequencies near 400 MHz, where scattering delays can be substantial (about 150 times larger than at 1.4 GHz), with the potential to bias and cause time-variability in DM estimates and, hence, in the reported arrival time.
Here we present a pilot study for temporal monitoring of this scattering delay. Although the frequencies of choice for high-precision timing of MSPs remain around 1–3 GHz, we explore the scattering delay of MSPs at frequencies around 150 MHz for two reasons. First, the dependence of means that the effects of scattering are strong at these frequencies. Second, the LOFAR (LOw-Frequency ARray) telescope provides 80 MHz of bandwidth at these frequencies, where 1–2 MHz was typical for previous instruments. This, coupled with LOFAR’s high sensitivity and versatility (van Haarlem et al. 2013), makes it an excellent instrument with which to explore scattering delays. As we discuss further below, the advent of a new signal processing technique – cyclic spectroscopy (CS) – plays a central role in the results presented here. Prior to the availability of CS in radio astronomy, it was not possible to achieve the required fine frequency resolution and pulse phase resolution simultaneously.
In the past, several approaches have been taken to estimate the scattering delay, . These can, in general, be divided into time-domain and frequency-domain techniques, depending on whether time-domain fitting of a scatter-broadening function was applied to average profiles (Bhat et al. 2004; Löhmer et al. 2001) or whether an autocorrelation analysis or similar was applied to the scintillation-modulated spectrum of the pulsar (Cordes et al. 1985; Kondratiev et al. 1998, 2001; Hemberger & Stinebring 2008). Although the correspondence between the scattering timescale and the diffractive scintillation bandwidth (or decorrelation bandwidth), , is known to be more complicated than this (Cordes & Rickett 1998), the standard formula for relating the two quantities is conventionally taken to be , and we will use that in the present work.
Previous work has shown that time-domain fitting is complicated by the evolution of average profiles with observing frequency (Hassall et al. 2013; Pennucci et al. 2014). Although MSP profiles do not evolve with frequency as strongly as do those of some slowly rotating pulsars, they typically have more complex profiles with larger duty cycles. Both of those features make time-domain fitting for scattering delay potentially inaccurate. As an attractive alternative, we employ frequency-domain analysis of the spectra in order to characterize the diffractive bandwidth .
In §2 we present the pilot observations we have made for three MSPs. Then, in §3 we give details of our analysis procedure. Finally, in §4 we present our results and discuss their implications for the prospect of correcting MSP precision timing for the effect of time-variable scattering delay.
2. Observations and Initial Processing
We used LOFAR baseband data from observations of PSR B1257+12 (catalog PSR B1257+12), PSR J1810+1744 (catalog PSR J1810+1744), and PSR J2317+1439 (catalog PSR J2317+1439) obtained for other purposes (Kondratiev et al. 2014) on three occasions from late 2012 through early 2014 for the analysis described below. Since PSR J1810+1744 is in a black-widow system (Hessels et al. 2011), we ensured that our observation (at orbital phases 0.78–0.80) was well away from the eclipse centered at orbital phase 0.25. All data were acquired in coherent beam-formed mode using the central LOFAR Core stations. As described in Stappers et al. (2011), van Haarlem et al. (2013), and Kondratiev et al. (2014), baseband data were recorded and stored in 400 subbands of width 195 kHz spanning the frequency range from approximately 110–190 MHz. Each 195-kHz subband was coherently dedispersed and then, in a manner described below, divided into 1024 frequency channels for a final frequency resolution of Hz spanning a total of 80 MHz. This narrow frequency resolution was needed to analyze the kHz-scale modulation produced by multi-path scattering in this frequency range.
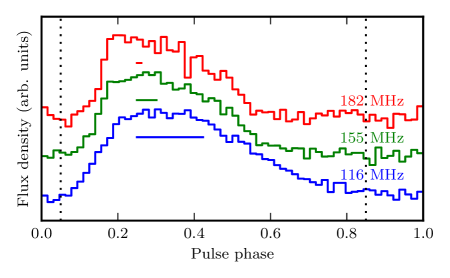
Traditional pulsar spectral processing operates on a coherently dedispersed baseband data stream and Fourier-transforms111Some modern pulsar backends use polyphase filterbanks instead, obtaining better channel isolation at the cost of increasing the minimum product by a factor of 4, 8, 16, or more. short segments of duration to form an -channel filter bank (with channels of width ). These spectra are then averaged modulo the pulsar period to form a (radio-frequency, pulse-phase-bin) 2D array that is accumulated for a subintegration length which is typically 10–60 s. This array then allows RFI excision and averaging over frequency to produce profiles like those in Figure 1, which are the primary input to pulsar timing. However, the constraint inherent in this approach poses a fundamental problem for scintillation studies of MSPs at low radio frequencies because small values of and are needed simultaneously (e.g. we needed Hz and s for one of the pulsars in our study, requiring ). Fortunately, the application of CS to observations of pulsars (Demorest 2011; Walker et al. 2013) makes such analysis possible. CS generalizes spectral analysis to periodically varying signals (Antoni 2007). Therefore, one can choose to be as long as a subintegration length (often tens of seconds) without impacting pulse phase resolution . This separation of and offers the possibility to study scintillation in the frequency domain while still retaining short enough to resolve scattering tails in the pulse-phase domain. The computed quantity is known as the periodic spectrum (Demorest 2011), or in other application areas as the Wigner-Ville spectrum (Antoni 2007). Its interpretation ranges from straightforward, as here, to quite subtle, depending on the application.
In our processing, for each 195-kHz subband, periodic spectrum estimates were formed modulo the pulse period with a pulse-phase resolution , where is the pulsar period. This resulted in 100 s, 25 s, and 50 s for the pulsars PSR B1257+12, PSR J1810+1744, and PSR J2317+1439, respectively. The periodic spectrum is a real-valued second-order product of the baseband data that can be accumulated over time. It has dimensions by , where and are the number of frequency channels and pulse phase bins, respectively. We integrated the periodic spectrum for s (shorter than the diffractive timescale) to form a set of subintegrations producing a final data cube denoted .
This processing was accomplished with the dspsr program222http://dspsr.sourceforge.net (van Straten & Bailes 2011), which incorporates CS as well as a wide range of state-of-the-art pulsar signal processing code. The version of dspsr -cyclic initially available to us allowed serious spectral leakage of narrow-band radio-frequency-interference (RFI) signals. Since the majority of interfering signals in the LOFAR high band are of this character333Offringa et al. 2013 found an average RFI occupancy of 3.2%, with most signals narrower than the 0.76-kHz resolution they employed. we added a polyphase-filter-like step (activated with the -cyclicoversample option) to the dspsr code and propagated this to the main code repository. This sufficiently isolated narrow-band RFI, which was then removed in the next processing step.
3. Analysis and Results
Processing continued on 4-MHz (PSR J1810+1744) or 8-MHz “parts,” which are the subband aggregates written by the beamformer; for each we assembled a data cube by concatenating the data cubes for each subband in the frequency direction. The real-valued periodic spectra (see, e.g., Figure 2 in Demorest 2011) are pulse-phase-resolved representations of the frequency structure imposed by multi-path scattering, but on a scale finer than . It is easily verified from the construction of the periodic spectrum that averaging it over all phases exactly recovers the traditional spectrum. Omitting from this average phase ranges where there is no pulsar signal, either intrinsic or scattered, cannot affect the obtained spectrum, and allows estimation of the non-pulsar components of the measured spectrum. This posed no problem for processing the PSR B1257+12 and PSR J2317+1439 data, but it did cause some problems for analyzing the PSR J1810+1744 data in the lower frequency range, as we comment on below.
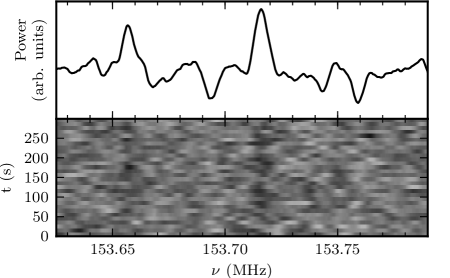
For each pulsar, we chose an on-pulse phase gate of width and a similar off-pulse gate of width . By averaging over these phase ranges we created on- and off-pulse 2D data slices . We then formed the dynamic spectrum array . Requiring , where is the intrinsic pulse width and is the duration of the multi-path scattering tail, ensures that this recovers the traditional dynamic spectrum. We show a very small section of the dynamic spectrum for PSR J1810+1744 in Figure 2, where we focus attention on several bright interference maxima or “scintles”.
Although RFI had been isolated by the polyphase filtering step, it was still a significant problem for our frequency-domain analysis. We manually excised all regions in frequency-subintegration space containing RFI spikes. We also corrected for the digitally-determined bandpass shape of each 195-kHz subband imposed by a front-end polyphase filter and blanked out the edges of each polyphase subband, where the power aliased from the other side of the subband was more than 10% of the total power; this required blanking approximately 10% of the band in every observation.
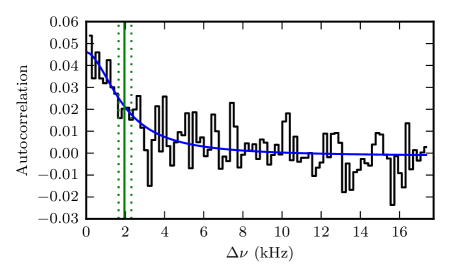
Once the RFI excision was accomplished, we analyzed each 4- or 8-MHz part individually using a standard autocorrelation function (ACF) analysis (e.g. Cordes et al. 1985) on the final spectra comprised of either 20480 channels (for PSR J1810+1744) or 40960 channels. The resulting ACF was then fit to a Lorentzian function , where is the conventional diffractive bandwidth (HWHM of the frequency ACF function for small values of , as was the case here), where the offset and scale-factor are not relevant to this study. We ignore the zero-lag noise spike as part of this fit, but use it to estimate the signal-to-noise ratio . A Lorentzian ACF is the appropriate functional form if the image point-spread function due to scattering is Gaussian and, hence, the pulse-broadening function is a one-sided exponential (Rickett 1990). To aid manual inspection of fit quality, we downsampled the dynamic spectrum where necessary to obtain approximately 16 bins across the ACF peak. An example of calculated ACF and fitted function for PSR J1810+1744 are shown in Figure 3.
A simple calculation of the signal-to-noise (S/N) of the ACF yields the expression
| (1) |
Here, is the phase-averaged pulsar flux density, SEFD is the system equivalent flux density, is the total bandwidth, and is a dimensionless constant of order unity. This assumes that the spectra are integrated for the diffractive scintillation time ; after that, the ACFs are incoherently averaged up to the total integration time . Raw sensitivity is clearly vital because of the squared ratio of signal strength to system noise. Note that because and for anticipated ISM conditions, we expect that , which should be visible across the LOFAR band, although the SEFD and gain degrade away from the center of the band (van Haarlem et al. 2013), which will partially offset this improvement.
A summary of relevant observational details and the results of this ACF fitting process are presented in Table 1. As indicated there, the fitted parameters for PSR J1810+1744 are well constrained. However, the ACFs for the other two pulsars were much weaker, as indicated by the signal-to-noise ratio and by the error estimates on in Table 1. This follows because the S/N of the time-domain data (e.g. the time-averaged pulsar flux divided by the noise rms in the pulse profile, corrected for the number of phase bins) was a factor of 3–4 smaller than for PSR J1810+1744, and Equation (1) shows that this will result in a factor of 9–15 degradation in if the SEFD is comparable for each of these pulsars.
| PSR | MJD | ObsID | Duration | DM | ||
|---|---|---|---|---|---|---|
| (s) | () | (kHz) | ||||
| B1257+12 | 56280 | L81046 | 1200 | 10.2 | 7.9 | |
| J1810+1744 | 56693 | L203594 | 300 | 39.7 | 21.0 | |
| J2317+1439 | 56286 | L81273 | 1200 | 21.9 | 4.1 |
Note. — The value for is referenced to an observing frequency of MHz. The value of DM quoted here is for comparison purposes only. here is the peak value of the ACF divided by the noise averaged over a bandwidth of . Note than in addition to their longer duration, the fits quoted here for pulsars PSR B1257+12 and PSR J2317+1439 used 8 MHz of bandwidth rather than 4 MHz.
The behavior of diffractive scintillation bandwidth as a function of observing frequency is of great interest because it is influenced by the distribution of scattering material along the line of sight, the nature of the inhomogeneity spectrum, and the transverse extent of scattering “screens” (see Cordes and Lazio 2001 and references therein). In Figure 4 we show results for the three MSPs in this pilot study.
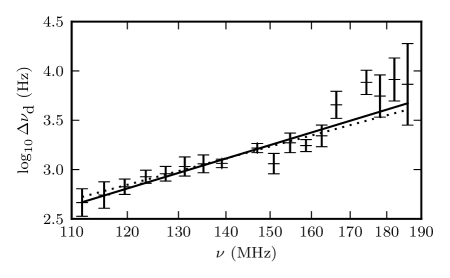
Only the PSR J1810+1744 data are of high enough quality to comment on the log vs. log slope over the LOFAR band. We find a logarithmic slope of over this range, consistent with predictions for a thin-screen, Kolmogorov turbulence model of unlimited transverse extent (), but also consistent with numerous other plausible models (Rickett 1990; Lambert & Rickett 2000; Cordes & Lazio 2001; Löhmer et al. 2001; Bhat et al. 2004). In particular, a break in the power-law to a smaller value of at lower frequencies could indicate an “inner scale” to the density variations or a truncation of the scattering disc at large spatial scales (Rickett 1990; Cordes & Lazio 2001).
We note that for the PSR J1810+1744 data selection of an on-pulse region poses a difficult decision. Including phase ranges where there is little or no signal reduces the signal-to-noise. However, while averaging the periodic spectrum over all signal-containing phases does produce the familiar spectrum, examining both simulated spectra and those observed for PSR B1937+21 (Demorest 2011) shows that the frequency structure of a scattered pulse narrows as one moves to later phases in which the scattering tail dominates. Omitting these later phases biases the estimate upwards. Since the scattering tail lengthens substantially at lower frequencies, this could produce a break in the power law relation between and , mimicking the effect of an inner scale or a truncated screen.
4. Discussion and Conclusions
This effort aimed at exploring LOFAR’s potential for frequency-domain studies of multi-path scattering in the ISM. Based on results from the bright MSP PSR J1810+1744 and two other moderately bright MSPs we find good potential for further studies, which we are embarking upon. We have shown that CS is a powerful and essential tool for studying MSP scintillation at LOFAR frequencies, and we have improved upon its implementation in the standard pulsar signal-processing package dspsr. This pilot study also serves to demonstrate the power that the low-frequency (50-350 MHz) component of the Square Kilometre Array (SKA-Low) will have for such studies. SKA-Low will provide an order-of-magnitude improvement in sensitivity over LOFAR, and can thus serve as a powerful ISM monitor to support high-precision timing at higher observing frequencies.
There are two major challenges to expanding these studies to other MSPs. The first problem is raw sensitivity. Despite LOFAR’s large collecting area and state-of-the-art architecture, we only had borderline detections of scintillation structure for two moderately bright MSPs. Admittedly this was in 1200-s data blocks — and we note that these observations were earlier in the commissioning process — but Equation (1) emphasizes that narrow requires high instantaneous sensitivity or a compensating increase in (incoherent) integration time. Because of the lower sky temperature at higher frequencies, some MSPs will be better studied in the range 300–500 MHz using this method. Secondly, as was true for PSR J1810+1744 in this study, a combination of large duty cycle () and/or substantial values of at low frequency means that there will be limited or no off-pulse baseline for some pulsars. This makes it difficult to determine the traditional spectrum accurately from the periodic spectrum, which possesses interference structure out to at least the quadratic sum of and . However, in future observations of PSR J1810+1744 and similar high-duty-cycle or heavily scattered MSPs, we plan to use LOFAR’s multi-beaming capability to provide off-source calibration. For very heavily scattered pulsars it may also be necessary to apply these techniques at higher frequencies, using baseband-output or realtime cyclic-spectroscopy backends of other telescopes.
The ultimate goal of this work is to improve the timing accuracy of MSPs at gigahertz frequencies. In order to accomplish that we plan to expand the sample of MSPs studied with LOFAR and to make multi-epoch observations of them. We will compare these results with what is known at frequencies around 1 GHz about multi-path scattering and its temporal variations for many of these pulsars (Levin et al. 2014). As has become common for studies attempting to improve the pulsar-based gravitational-wave detector, this work is likely to lead to increased understanding of another area of astrophysics, in this case the ionized ISM.
This work was made possible by an ERC Starting Grant (DRAGNET) and NWO Vrije Competitie grant to J.W.T.H., and an NWO Bezoekersbeurs to support the long-term visit of D.S. Other important support includes NSF awards 0968296 (PIRE) and 1009580 (RUI) as well as a Research Status award from Oberlin College to D.S. We thank A. Karastergiou, B. Stappers, and J. Verbiest for useful discussions and other contributions. The data were taken under proposals LC0-011 and LC1-027 (PI: Verbiest). We thank the referee for numerous helpful suggestions.
References
- Antoni (2007) Antoni, J. 2007, Mechanical Systems and Signal Processing, 21, 597
- Bhat et al. (2004) Bhat, N. D. R., Cordes, J. M., Camilo, F., Nice, D. J., & Lorimer, D. R. 2004, ApJ, 605, 759
- Bizouard et al. (2013) Bizouard, M. A., Jenet, F., Price, R., & Will, C. M. 2013, Classical and Quantum Gravity, 30, 220301
- Coles et al. (2010) Coles, W. A., Rickett, B. J., Gao, J. J., Hobbs, G., & Verbiest, J. P. W. 2010, ApJ, 717, 1206
- Cordes & Lazio (2001) Cordes, J. M., & Lazio, T. J. W. 2001, ApJ, 549, 997
- Cordes & Rickett (1998) Cordes, J. M., & Rickett, B. J. 1998, ApJ, 507, 846
- Cordes et al. (1985) Cordes, J. M., Weisberg, J. M., & Boriakoff, V. 1985, ApJ, 288, 221
- Demorest (2011) Demorest, P. B. 2011, MNRAS, 416, 2821
- Demorest et al. (2013) Demorest, P. B., et al. 2013, ApJ, 762, 94
- Hassall et al. (2013) Hassall, T. E., et al. 2013, A&A, 552, A61
- Hemberger & Stinebring (2008) Hemberger, D. A., & Stinebring, D. R. 2008, ApJ, 674, L37
- Hessels et al. (2011) Hessels, J. W. T., et al. 2011, in American Institute of Physics Conference Series, Vol. 1357, American Institute of Physics Conference Series, ed. M. Burgay, N. D’Amico, P. Esposito, A. Pellizzoni, & A. Possenti, 40–43
- Hobbs et al. (2005) Hobbs, G., Lorimer, D. R., Lyne, A. G., & Kramer, M. 2005, MNRAS, 360, 974
- Keith et al. (2013) Keith, M. J., et al. 2013, MNRAS, 429, 2161
- Kondratiev et al. (2014) Kondratiev, V., et al. 2014, in preparation
- Kondratiev et al. (1998) Kondratiev, V. I., Popov, M. V., Skulachev, A. D., & Soglasnov, V. A. 1998, Astronomy Letters, 24, 464
- Kondratiev et al. (2001) Kondratiev, V. I., Popov, M. V., Soglasnov, V. A., & Kostyuk, S. V. 2001, Ap&SS, 278, 43
- Lambert & Rickett (2000) Lambert, H. C., & Rickett, B. J. 2000, ApJ, 531, 883
- Lee et al. (2014) Lee, K. J., et al. 2014, arXiv:1404.2084
- Levin et al. (2014) Levin, L., et al. 2014, in preparation
- Löhmer et al. (2001) Löhmer, O., Kramer, M., Mitra, D., Lorimer, D. R., & Lyne, A. G. 2001, ApJ, 562, L157
- Lorimer & Kramer (2005) Lorimer, D. R., & Kramer, M. 2005, Handbook of Pulsar Astronomy (Cambridge University Press)
- Manchester et al. (2005) Manchester, R. N., Hobbs, G. B., Teoh, A., & Hobbs, M. 2005, AJ, 129, 1993
- Offringa et al. (2013) Offringa, A. R., et al. 2013, A&A, 549, A11
- Pennucci et al. (2014) Pennucci, T. T., Demorest, P. B., & Ransom, S. M. 2014, arXiv:1402.1672
- Rickett (1990) Rickett, B. J. 1990, Ann. Rev. Astr. Ap., 28, 561
- Stappers et al. (2011) Stappers, B. W., et al. 2011, A&A, 530, A80
- Stinebring (2013) Stinebring, D. 2013, Classical and Quantum Gravity, 30, 224006
- van Haarlem et al. (2013) van Haarlem, M. P., et al. 2013, A&A, 556, A2
- van Straten & Bailes (2011) van Straten, W., & Bailes, M. 2011, PASA, 28, 1
- Walker et al. (2013) Walker, M. A., Demorest, P. B., & van Straten, W. 2013, ApJ, 779, 99