The peculiar Galactic center neutron star X-ray binary XMM J174457–2850.3
Abstract
The recent discovery of a milli-second radio pulsar experiencing an accretion outburst similar to those seen in low mass X-ray binaries, has opened up a new opportunity to investigate the evolutionary link between these two different neutron star manifestations. The remarkable X-ray variability and hard X-ray spectrum of this object can potentially serve as a template to search for other X-ray binary/radio pulsar transitional objects. Here we demonstrate that the transient X-ray source XMM J174457–2850.3 near the Galactic center displays similar X-ray properties. We report on the detection of an energetic thermonuclear burst with an estimated duration of 2 hr and a radiated energy output of erg, which unambiguously demonstrates that the source harbors an accreting neutron star. It has a quiescent X-ray luminosity of and exhibits occasional accretion outbursts during which it brightens to for a few weeks (2–10 keV). However, the source often lingers in between outburst and quiescence at . This peculiar X-ray flux behavior and its relatively hard X-ray spectrum, a power law with an index of , could possibly be explained in terms of the interaction between the accretion flow and the magnetic field of the neutron star.
Subject headings:
accretion, accretion disks — Galaxy: center — pulsars: general — stars: neutron — X-rays: binaries — X-rays: individual (XMM J174457–2850.3)1. Introduction
Low-mass X-ray binaries (LMXBs) and millisecond radio pulsars (MSRPs) are two different manifestations of neutron stars in binary systems that are thought to be evolutionarily linked (e.g., Alpar et al., 1982; Bhattacharya & van den Heuvel, 1991; Strohmayer et al., 1996; Wijnands & van der Klis, 1998).
In an LMXB configuration, the neutron star accretes matter from a less massive () companion star that overflows its Roche lobe. Transient systems spend most of their time in a dim quiescent state with a 2–10 keV luminosity of , during which the transferred matter is stored in a cold accretion disk. Once sufficient mass has been accumulated, (part of) the disk becomes hot and ionized, allowing matter to accrete onto the neutron star and giving rise to an outburst with (e.g., van Paradijs, 1996; King et al., 1996; Lasota, 2001; Coriat et al., 2012). When a certain portion of the disk mass has been accreted, the binary switches back to a quiescent state during which the disk is slowly replenished until a new outburst occurs.
These outburst/quiescence cycles eventually terminate as the binary evolves and the companion star decouples from its Roche lobe so that the mass-transfer stops (e.g., Tauris, 2012). The rapidly rotating neutron star, spun up to millisecond periods by gaining angular momentum during the accretion phases, may now emit pulsed radio emission so that the binary is observed as a MSRP.
Recent discoveries have opened up new opportunities to investigate the LMXB/MSRP connection. There are three MSRPs that exhibit increased X-ray states during which an accretion disk is present and radio pulsations are no longer detected: PSR J1824–24521/IGR J18245–2452 in the globular cluster M28 (henceforth the M28 source; e.g., Papitto et al., 2013b; Linares et al., 2014), PSR J1023+0038 (e.g., Archibald et al., 2009; Patruno et al., 2014), and XSS J12270–4859 (e.g., de Martino et al., 2013; Bassa et al., 2014; Roy et al., 2014).
The M28 source, a 3.9-ms radio pulsar, suddenly became active as an LMXB in 2013: its pulsed radio emission disappeared, while its X-ray emission increased from to . The detection of a type-I X-ray burst and coherent X-ray pulsations demonstrated that the strong X-ray brightening was due to matter accreting onto the surface of the neutron star (e.g., Papitto et al., 2013b; Linares et al., 2014). After 2 months, the accretion ceased, the X-rays faded, and the radio pulsations returned (Papitto et al., 2013c). However, instead of settling back at its quiescent level, the source jumped between and (Linares et al., 2014).
The other two neutron stars, PSR J1023+0038 and XSS J12270–4859 (both spinning in 1.7 ms), display faint X-ray emission of and no optical signatures of an accretion disk when active as a MSRP (e.g., Archibald et al., 2009; Bassa et al., 2014; Bogdanov et al., 2011, 2014; Roy et al., 2014). However, both also exhibit an enhanced X-ray state during which no radio pulsations are detected, the X-ray luminosity is increased to , and an accretion disk is visible in the optical band (e.g., Archibald et al., 2009; de Martino et al., 2013; Linares, 2014; Patruno et al., 2014). Nevertheless, their X-ray luminosity is much lower than that of active LMXBs (i.e., such as seen for the M28 source), but rather in the regime of quiescent LMXBs. Both sources seem to spend years at a time in the two different states (e.g., Bassa et al., 2014; Patruno et al., 2014).
The remarkable X-ray variability displayed by these three “transitional objects” is thought to be related to the interaction between the neutron star magnetosphere and the accretion flow (e.g., Archibald et al., 2009; Linares et al., 2014; Papitto et al., 2014; Patruno et al., 2014). In response to fluctuations in the mass-accretion rate, the magnetospheric radius (the radius at which the magnetic field is dynamically important in the governing the accretion flow) may shrink or expand, giving rise to different X-ray states (e.g., Lipunov et al., 1992, and references therein):
-
i)
For sufficiently high accretion rates, is smaller than the co-rotation radius (the radius at which the Keplerian angular velocity equals the spin velocity of the neutron star) so that accretion onto the stellar surface is centrifugally allowed. This state would correspond to the bright LMXB accretion outburst seen in the M28 source. If the matter is channeled onto the magnetic poles, pulsed X-ray emission can be observed (as was indeed the case for the M28 source; Papitto et al., 2013a).
-
ii)
When the accretion rate drops, may expand beyond so that a propeller mechanism can operate: the fast rotating magnetic field impedes the accretion of matter onto the neutron star surface. Consequently, the X-ray luminosity is significantly lower. The interaction of the in-falling matter with the magnetosphere may suppress the radio-pulsar mechanism. This scenario could correspond to the enhanced X-ray state () seen in the three transitional objects. The prominent (un-pulsed) gamma-ray emission seen for PSR J1023+0038 and XSS J12270–4859 (Hill et al., 2011; Stappers et al., 2014) may fit into this picture, since it could result from shocks formed when the accretion stream runs into the neutron star magnetosphere (e.g., Papitto et al., 2014).
-
iii)
For very low accretion rates, may expand beyond the light cylinder (the radius at which the co-rotation speed equals the speed of light). The pressure of the neutron star’s relativistic particle wind is then sufficient to prevent matter from reaching the magnetosphere. This may clear out the accretion disk (although see Ekşİ & Alpar, 2005) and allow the radio pulsar mechanism to operate. Hence, this would correspond to the MSRP state. The faint X-ray emission () may find its origin in an intra-binary shock (e.g., Bogdanov et al., 2011, 2014; Linares et al., 2014).
Here we discuss the peculiar X-ray properties of XMM J174457–2850.3: an unclassified transient X-ray source located NW of Sgr A∗, that was discovered in 2001 (Sakano et al., 2005). We report on the Swift detection of an energetic type-I X-ray burst, which unambiguously demonstrates that the source harbors an accreting neutron star, most likely in an LMXB configuration (see also Degenaar et al., 2012a). By investigating 12 yr of X-ray monitoring data of the Galactic center (2000–2012), we show that it behaves similar to the M28 source.
2. Observations and Data Analysis
In the past decade, the Galactic center region has been targeted many times with high-resolution X-ray imaging/spectroscopic instruments onboard Swift, Chandra, and XMM-Newton. We searched the public data archives of these three observatories to characterize the long-term soft (2–10 keV) X-ray behavior of XMM J174457–2850.3.
2.1. Swift XRT and BAT data
Swift’s X-Ray Telescope (XRT; Burrows et al., 2005) can acquire two-dimensional images in photon counting (PC) mode. However, for very bright sources, the instrument is operated in windowed timing (WT) mode in which the central CCD columns are collapsed into one dimension (Hill et al., 2004). We found 179 XRT/PC observations that had XMM J174457–2850.3 in the field of view (FOV). These 1 ks observations were carried out between 2007 July 5 and 2012 October 31, and resulted in ks of accumulative exposure time.
Reduction and analysis was carried out using the Swift tools and calibration data within heasoft (ver. 6.13). After processing the data with xrtpipeline, we employed XSelect to extract count rates, light curves, and spectra. We used a circular region to obtain source events, and a circular region for the background. The detection of a type-I X-ray burst (Section 4) caused pile-up in the PC data. For that observation (ID 91408042) we therefore used an annular region with an inner/outer radius of /. To study the X-ray burst properties, we also analyzed the subsequent WT mode observation (ID 530588000), for which we extracted source counts from a rectangular box. Ancillary response files were generated with xrtmkarf and the response matrix files (ver. 14) were sourced from the caldb. Using grppha, the spectra were grouped to a minimum of 15 photons per bin.
Due to the intense brightening caused by the type-I X-ray burst, the Burst Alert Telescope (BAT; Barthelmy et al., 2005) triggered on XMM J174457–2850.3 (trigger 530588; Barlow et al., 2012). We reprocessed this data and created standard data products using the batgrbproduct tool. The BAT is sensitive in the 15–150 keV range, but we restricted our analysis to the 15–35 keV band because the data were dominated by the background at higher energies. A spectrum was extracted with batbinevt, and standard corrections were applied with batupdatephakw and batphasyserr. The response matrix was created using the task batdrmgen.
2.2. XMM-Newton EPIC data
We used 43 XMM-Newton observations obtained with the European Photon Imaging Camera (EPIC), which consists of one PN and two MOS detectors (Turner et al., 2001; Strüder et al., 2001). These data span a time between 2000 September and 2012 September, with exposures ranging between 6 and 106 ks per observation. Reduction and retrieval of data products was achieved using SAS (ver. 13.0). After processing the data with epproc and emproc we extracted count rates using eregionanalyse. To obtain source events we used a circular region with a radius, while an aperture of twice that size was used for the background. Spectra and response files were obtained using specextract. A combined spectrum of all three detectors was created using epicspeccombine. The spectral data were grouped into bins with at least 20 photons.
2.3. Chandra ACIS and HRC data
A total of 24 Chandra observations were used, obtained with the Advanced CCD Imaging Spectrometer (ACIS; Garmire et al., 2003) or the High-Resolution Camera (HRC; Kenter et al., 2000). Of the two, only the ACIS provides spectral information. The Chandra data covered the epoch between 2001 July and 2008 July, and had exposure times of 4–167 ks per individual observation. Reduction and analysis were performed using the ciao tools (ver. 4.5). After initial reprocessing, we used dmextract to obtain source counts from a circular region with a radius of , and background counts from a region with a radius of . We extracted source and background spectra from the ACIS data using specextract, which also generated the response files. The spectra were grouped to a minimum of 20 photons bin-1.
2.4. Spectral Analysis and Light Curve Construction
The spectral data were modeled using XSpec (ver. 12.8; Arnaud, 1996). Fits were restricted to the 2–10 keV range (15–35 keV for the BAT) because of the very high hydrogen column density (). We used a black body model (bbodyrad) to describe the type-I X-ray burst (Section 4), whereas a power-law model (pegpwrlw, with the normalization set to represent the 2–10 keV range) was used for all other data. The tbabs model was included to account for interstellar absorption, using the vern cross-sections and wilm abundances (Verner et al., 1996; Wilms et al., 2000).
We deduced unabsorbed fluxes in the 2–10 keV energy range and converted these into luminosities by assuming a distance of kpc (see Section 4.2). To obtain 2–10 keV flux estimates for observations with a low number of counts and to obtain flux upper limits for non-detections, we determined instrument-specific count rate to flux conversion factors. Throughout this work, quoted fluxes and luminosities refer to the 2–10 keV band unless stated otherwise. Errors reflect 90% confidence levels.
| Epoch | Instr. | ObsID | State |
|---|---|---|---|
| 2002 May | Chandra | 3392/93 | Q |
| 2004 Aug/Sep | XMM | 0202670701/801 | Q |
| 2007 Mar/Apr | XMM | 0402430301/401/701 | I |
| 2011 Mar/Apr | XMM | 0604300601/701/801/901/1001 | I |
| 2012 Mar | XMM | 0674600601/701/801/1001/1101 | I |
| 2001 Sep | XMM | 0112972101 | O |
| 2008 Jun | Swift | 0035650109/110 | O |
| 2012 Aug | Swift | 0091408042/43/44 | O |
3. Accretion History
3.1. Long-term X-Ray Light Curve
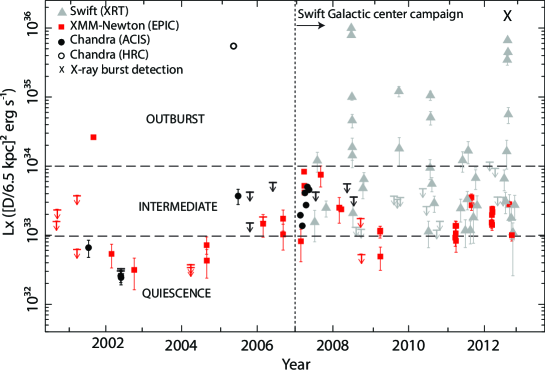
To investigate the long-term accretion history of XMM J174457–2850.3, we assembled a total of 246 Swift, XMM-Newton, and Chandra observations obtained between 2000 September and 2012 October. To increase the sensitivity of the short Swift exposures, we added chunks of data performed within a time frame of 2–4 weeks that added up to 5–10 ks of exposure time (except during outbursts when the source was readily detected within single observations).
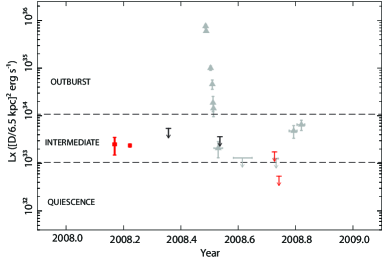
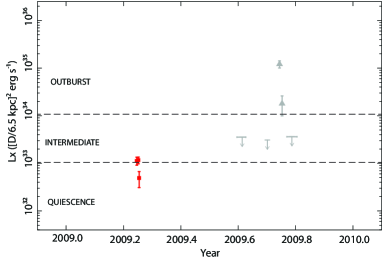
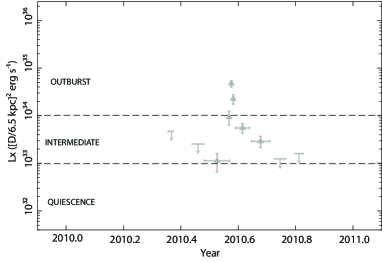
Figure 1 (top) reveals at least five distinct outbursts reaching over the past 12 yr: in 2005, 2008, 2009, 2010, and 2012 (Wijnands et al., 2006; Degenaar & Wijnands, 2010; Degenaar et al., 2010a, 2012b, 2012c). The type-I X-ray burst was detected during the 2012 outburst (Section 4). Owing to the high cadence of observations, four of the outbursts were caught by the Swift monitoring program. This provides constraints on the duration of the outbursts: 1–7 weeks in 2008, 1–9 days in 2009, 5–21 days in 2010, and 15–21 days in 2012 (see also Degenaar & Wijnands, 2010; Degenaar et al., 2012b).
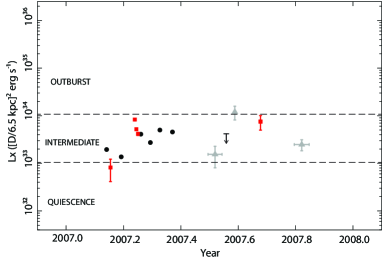
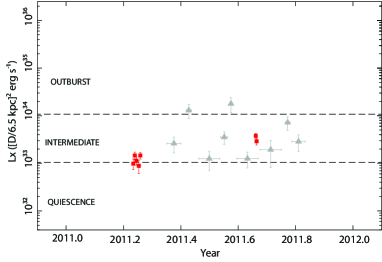
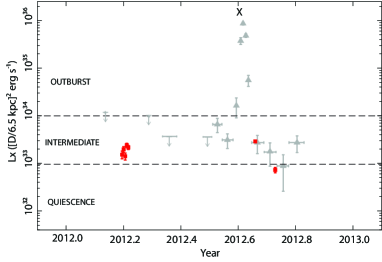
The lowest luminosity exhibited by the source, as seen with Chandra and XMM-Newton in 2002 and 2004, is (see also Sakano et al., 2005). However, it is not often found at its quiescent level, but is instead frequently detected at , i.e., intermediate between quiescence and full outburst. This is perhaps best illustrated by the expanded view of the 2007, 2011, and 2012 light curves, when the source was most densely sampled (Figure 1).
In 2007 February–May, the source was covered during ten Chandra/XMM-Newton observations, which showed that its luminosity varied between . These observations were spaced by 2–18 days, making it unlikely that all these caught the rise/decay of bright outbursts that were missed. Rather, it seems to suggests that the source lingered in an intermediate luminosity state for several months. This is supported by dense monitoring in 2011 May–November (on average two observations per week, with gaps of only 2–10 days), which showed the source hovering at for several months while it did not reach quiescent or bright outburst levels during that time (Figure 1). It is also striking that in 2012 the source was already detected well above quiescence at for 1 month prior to its bright outburst, and instead of decaying to quiescence afterward, it remained at for at least another 2 months.
Examination of the long-term light curve thus shows that the low-activity stages can last for several months, and that these are not necessarily associated with bright outbursts (see also Degenaar & Wijnands, 2010; Degenaar et al., 2012b). It therefore appears that the source occupies three distinct luminosity regimes: (1) accretion outbursts of , (2) a quiescent state with , and (3) an intermediate state characterized by (2–10 keV).
We note that the number of source counts detected in individual observations is low: for XMM-Newton, (ACIS) and (HRC) for Chandra, and for Swift. Moreover, the source was often found at the edge of the detector, which significantly decreases the effective exposure time. The low statistics (and the low timing resolution of the imaging observations) did not allow us to conduct meaningful searches for (fast) X-ray pulsations.999Sakano et al. (2005) reported the possible detection of slow (5.2 s) X-ray pulsations during a 2001 XMM-Newton observation in which the source was detected at (ObsID 0112972101). However, there are no details given on the search methods or the significance of the signal. We were not able to reproduce these results and did not obtain any meaningful limits.
3.2. X-Ray Spectral Properties
XMM J174457–2850.3 is so faint that most observations did not collect sufficient photons to allow for spectral analysis. Nevertheless, we obtained a few good spectra to characterize the different luminosity regimes and to investigate any possible changes in spectral shape (Table 1). To improve the statistical quality of the spectra we summed several observations (of the same instrument) that had similar source count rates.
For the outburst state we use three epochs: XMM-Newton data obtained in 2001, and Swift data covering the 2008 and 2012 outbursts.101010The 2005 outburst was captured by the Chandra/HRC and hence no spectral information is available. The 2009 and 2010 Swift outbursts were only sparsely sampled and did not yield as good quality spectra as the 2008 and 2012 outbursts (Figure 1). Two different epochs were used to characterize the quiescent state: we summed the spectra of two long (157–167 ks) Chandra/ACIS observations performed on 2002 May 25/28, and combined two long (135 ks) XMM-Newton exposures of 2004 August 31 and September 2. Finally, the intermediate luminosity state is best covered by a series of XMM-Newton exposures obtained during three different epochs: 2007 March 30 till April 3, 2011 March 28 till April 5, and 2012 March 13–31 (with exposure times of 16–106 ks).
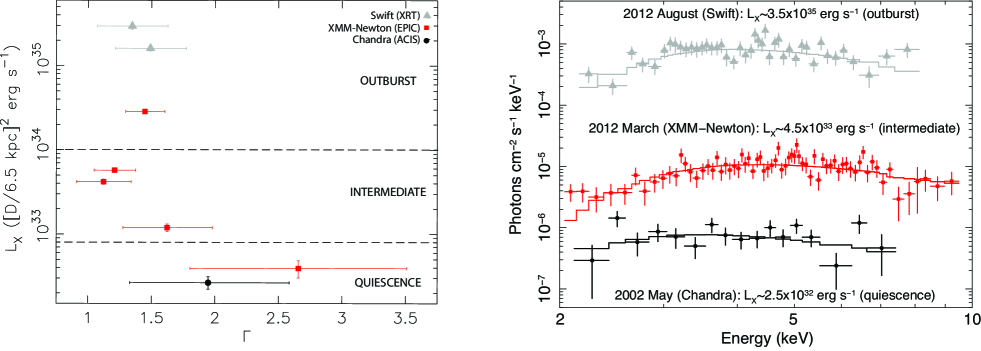
This set of eight spectra were fitted together to an absorbed power-law model. We first assumed that the hydrogen column density and photon index remained the same at all epochs, allowing only the normalization of the pegpwrlw model (the unabsorbed 2–10 keV flux) to vary between the different observations. This resulted in a reasonable fit ( for 554 dof) with , and . Allowing either or to vary between different epochs improved the fit ( for 554 dof), although an f-test suggests that there is a probability that such an improvement is achieved by chance. Indeed, there appears to be little variation in and between different epochs. This is illustrated by Figure 2 (left), where we show the values of obtained for the fit in which was tied between the different data sets (yielding ). The spectrum seems to be somewhat softer in quiescence than at higher luminosities, although the 90% error bars are large and partly overlap with those of the brighter states.
It seems that despite four orders of magnitude change in luminosity, XMM J174457–2850.3 shows no strong spectral variability in the 2–10 keV energy range. This can also be seen in Figure 2 (right), which displays three spectra that are representative of the different luminosity states. We note that due to the large absorption column in the direction of the source, we cannot obtain any meaningful upper limits on the quiescent thermal emission from the surface of the neutron star.
4. Detection of a Type-I X-ray Burst
Regular monitoring of the Galactic center with Swift/XRT showed that XMM J174457–2850.3 started a new accretion outburst around 2012 August 5 (Figure 1; Degenaar et al., 2012c). Six days later, on August 11, the BAT triggered on XMM J174457–2850.3 (trigger 530588; Barlow et al., 2012). Preliminary analysis suggested that this trigger was caused by a type-I X-ray burst (Degenaar et al., 2012a): a bright flash of X-ray emission resulting from unstable thermonuclear burning of He and/or H on the surface of a neutron star. These explosive phenomena are characterized by a sharp rise in X-ray luminosity (up to the Eddington limit) resulting from rapid ignition of the fuel layer, followed by a slower decay tail as the burning ashes cool.
Below, we present the detailed analysis of the BAT trigger on XMM J174457–2850.3. The light curve morphology (a double peak followed by a long decay along a power law with an index of 1.05), the spectral shape and evolution (a black body cooling from 2 to 1 keV), and the estimated bolometric energy output ( erg) are indeed all consistent with a type-I X-ray burst from an accreting neutron star LMXB.
4.1. X-Ray Burst Light Curve Analysis
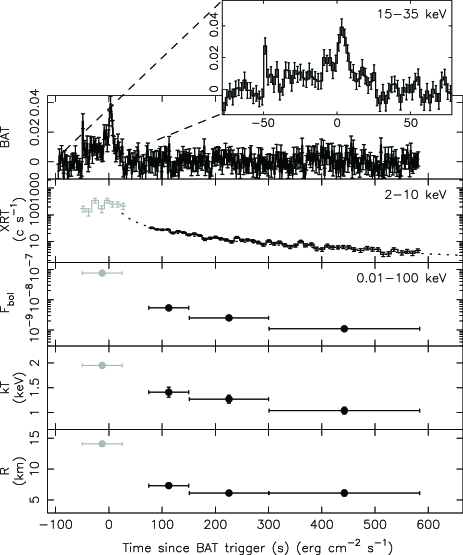
The 15–35 keV BAT light curve of trigger 530588, displayed in Figure 3, shows an enhancement above the background for 75 s. The main peak lasts 20 s and is centered on the trigger time (; 2012 August 11 at 04:44 utc), but there is also a much sharper peak 50 s before the BAT trigger (see the inset in Figure 3). A double-peaked structure is often observed for type-I X-ray bursts and could be a signature of a photospheric radius expansion phase that occurs when the generated emission reaches the Eddington limit.
By coincidence, the BAT trigger occurred when Swift/XRT was observing the Galactic center as part of its regular monitoring program (ObsID 91408042). The 85-s long PC mode observation shows that XMM J174457–2850.3 was the only active X-ray source in the FOV. Strikingly, the source was a factor 1000 brighter than during the preceding 300-s exposure that was obtained 3.5 hr earlier (when it was detected at ). This indicates that the peak of the X-ray burst was also caught by the XRT (see Figure 3).
In response to the BAT trigger, the PC mode observation was interrupted, the spacecraft slewed, and observations of XMM J174457–2850.3 resumed with the XRT operating in WT mode 75 s later. The s exposure showed that the source intensity steadily decayed from 30 to (Figure 3). There is no indication that the decay was leveling off at the end of the XRT observation, and the source was still a factor 10 brighter than observed 3.5 hr prior to the BAT trigger (). This suggests that the cooling tail of the X-ray burst was ongoing and thus had a length of 10 minutes.
To characterize the decay of the X-ray burst we fitted the WT light curve to a power law of the form . This yielded an index of and normalization of ( for 100 dof; dotted curve in Figure 3). Extrapolating the power-law decay down to the pre-burst level of , we estimate that the X-ray burst may have been as long as 7400 s (2.1 hr). We searched the 0.5–10 keV XRT/WT for burst oscillations (modulations at the neutron star spin period; e.g., Strohmayer & Bildsten, 2006) but found none, with a upper limit of 6%.
4.2. X-Ray Burst Spectral Analysis
We extracted a BAT spectrum using 75 s of data obtained from = s to s since the trigger time. The XRT/PC monitoring observation ran from s to s, hence coinciding with the BAT detection (see Figure 3). To exploit this broad-band coverage, we fitted the XRT/PC and BAT spectra simultaneously (each with their own response files), treating them as a single spectrum. The follow-up XRT/WT data were divided into three intervals of 1500 counts each.
We fitted the X-ray burst spectra together to an absorbed black body with the hydrogen column density () tied between the different intervals. To account for the underlying accretion emission we included a power-law component with the parameters fixed to the values obtained from fitting the spectrum of the 300-s PC mode data that preceded the X-ray burst detection (a photon index of and a 2–10 keV unabsorbed flux of ).
This approach resulted in a good fit ( for 333 dof). The joint value of is consistent with that found for accretion outbursts of the source (Section 3.2). For the peak of the X-ray burst, we infer a temperature of keV, which decays to keV in the final part of the XRT/WT observation (Figure 3). Extrapolating the black body fits to an energy range of 0.01–100 keV we estimate a bolometric peak flux of .
The duration and energy output suggests that we observed a pure He X-ray burst (see Section 5.1), which are thought to reach the Eddington luminosity (). The double-peaked structure seen in the BAT data may support this (Section 4.1). Therefore, assuming that the bolometric peak flux corresponded to the empirical value of (Kuulkers et al., 2003), we estimate a source distance of kpc.
4.3. X-Ray Burst Energetics
For , the fluence in the 75 s X-ray burst peak is . The energy emitted during the X-ray burst tail can be estimated by integrating the power-law decay fit from s (the time when the peak had decayed back into the BAT background; Figure 3) to s after the BAT trigger (the time at which the XRT count rate had presumably decayed to the persistent level; Section 4.1). This yields , and hence a total fluence for the X-ray burst of . For kpc, this implies a total radiated energy output of erg. Table 2 summarizes the X-ray burst properties.
The nuclear energy generation rate for a pure He burst is MeV nucleon erg g-1 (e.g., Galloway et al., 2008). This suggests that the ignition layer had a mass of g (where =1.31 is the gravitational redshift for a neutron star with km and ). From the flux measured 3.5 hr prior to the X-ray burst we estimate that the source was accreting at a bolometric luminosity of , i.e., 0.3% of the Eddington limit (where we assumed a bolometric correction factor of 3 for converting from the 2–10 keV band flux; in ’t Zand et al., 2007). This corresponds to a mass-accretion rate of (where is the gravitational constant). Powering the observed X-ray burst would thus require the source to accrete at this level for 10 weeks. Since this is longer than the observed duration of the bright accretion episodes (see Section 3.1), it would take several outbursts (i.e., several years) to build up enough fuel.
5. Discussion
5.1. An LMXB with Peculiar X-Ray Behavior
XMM J174457–2850.3 was tentatively identified as a neutron star LMXB based on the amplitude of its X-ray variability and the lack of a bright radio counterpart (Sakano et al., 2005; Wijnands et al., 2006). In this work, we have reported the detection of a type-I X-ray burst, which confirms this classification. Based on the observed peak flux we estimate a source distance of kpc.
The observable properties of type-I X-ray bursts (e.g., the duration, peak brightness and energy output) depend on the conditions of the ignited fuel layer (e.g., its H content and thickness), and are set by the accretion rate onto the neutron star (Fujimoto et al., 1981; Bildsten, 1998; Peng et al., 2007). The long cooling tail (10 minutes, up to hr) and high radiated energy output ( erg) observed for XMM J174457–2850.3 fall into the regime of intermediately long X-ray bursts. These rare events are thought to arise from ignition of a thick, pure He layer and are typically observed from neutron stars accreting slowly at 1% of the Eddington limit, like XMM J174457–2850.3 (e.g., in ’t Zand et al., 2005; Falanga et al., 2008; Linares et al., 2009; Degenaar et al., 2010b, 2011, 2013a). It takes a long time to accrete enough fuel to power these energetic X-ray bursts (several weeks/months), so it is not surprising that this was the first X-ray burst ever detected from the source, despite its frequent activity over the past decade.
Investigation of the long-term (2000–2012) light curve revealed several accretion outbursts reaching up to and lasting for a few days–weeks. The brightness, duration, and repetition rate of these outbursts is not unusual for Galactic LMXBs (e.g., Chen et al., 1997; Wijnands et al., 2006; Degenaar & Wijnands, 2010). Its quiescent luminosity of is typical for neutron LMXBs. However, it is striking that the source is often detected at an intermediate luminosity of , sometimes for months at a time. Below we discuss different scenarios that may account for this peculiar X-ray variability. We consider the most likely explanation that it is caused by the interaction of the magnetic field of the neutron star with the accretion disk, similar to what has been proposed for the MSRP/LMXB transitional objects.
5.2. Quasi-stable Accretion Disk or Wind Accretion?
It is not immediately clear how quasi-stable low-luminosity states such as seen in XMM J174457–2850.3 can be explained within the disk instability model that ascribes outburst and quiescent cycles to changes in the ionization state of the accretion disk. There are some parallels with Z-Cam stars, a sub-class of accreting white dwarfs that undergo outburst/quiescent cycles but sometimes get caught in a “standstill”. These states may last several days to years and are 1 optical magnitudes fainter than the maximum intensity reached during outbursts. It is thought that the mass-accretion rate is fluctuating around a critical rate (perhaps due to sunspot activity on the donor star), so that the accretion disk can be found both in a stable (standstill) and unstable (outburst-quiescence cycles) configuration (e.g., Meyer & Meyer-Hofmeister, 1983; Lasota, 2001).
The detection of a bright outburst from XMM J174457–2850.3 in 2012, while it was in an intermediate-luminosity state right before and after, does not fit into this picture. During a standstill, the disk should be in a stable, ionized configuration and therefore the thermal-viscous instability that causes bright accretion outbursts cannot occur. Interestingly, three Z-Cam stars were recently found to display outbursts during their standstills (Iw And, V513 Cas, and ST Cha; Simonsen, 2011; Simonsen et al., 2014; Szkody et al., 2013).
This apparent challenge to the disk instability model was addressed by Hameury & Lasota (2014), who concluded that no physically motivated modifications to the model could account for the observations. Therefore, these authors proposed that the outbursts observed during standstills should be caused by brief enhancements in the mass-transfer rate (e.g., due to magnetic activity) of the donor star. One requirement is then that an outburst is followed by a brief but significant luminosity dip before it restores to the standstill level. This was not observed in XMM J174457–2850.3, which settled right back at its intermediate-luminosity state after its 2012 outburst. Moreover, it is not clear if accretion disks in neutron star LMXBs would respond the same as these dwarf novae.
Given the difficulty of explaining the peculiar X-ray flux behavior of XMM J174457–2850.3 in the disk instability model, it was previously proposed that it might be a wind-accreting system (Degenaar & Wijnands, 2010). Indeed, there is a striking resemblance with Super-giant Fast X-ray Transients (SFXTs), in which a neutron star is accompanied by an O/B supergiant (e.g., Sidoli, 2013, for a review). A common property of these objects is that their outburst () and quiescent states () are relatively rare; they are most often detected at intermediate levels of (e.g., Romano et al., 2011). Their behavior is explained in terms of quasi-spherical accretion from the (clumpy) winds of their companion (e.g., Drave et al., 2014). A similar phenomenology is observed for Symbiotic X-ray binaries (SyXRBs), in which a neutron star accretes from the wind of an M-giant (e.g., Masetti et al., 2007; Patel et al., 2007; Enoto et al., 2014).
Despite the similarities in X-ray behavior, the lack of an infra-red counterpart with mag (Mauerhan et al., 2009), renders it unlikely that XMM J174457–2850.3 is a SFXT or a SyXRB (it also rules out a main sequence companion with a spectral type earlier than B3; Degenaar & Wijnands, 2010). Moreover, the neutron stars in these systems are believed to have very strong magnetic fields ( G), which prevents the occurrence of type-I X-ray bursts such as seen for XMM J174457–2850.3 (e.g., Bildsten, 1998). It has also been proposed that LMXBs with low accretion luminosities such as XMM J174457–2850.3 are capturing the wind of an M-dwarf companion (Maccarone & Patruno, 2013). However, its time-averaged mass-accretion rate of (Degenaar & Wijnands, 2010) seems to be too high. Wind accretion therefore likely cannot account for the peculiar X-ray flux behavior of XMM J174457–2850.3.
| Parameter (unit) | Value |
|---|---|
| Powerlaw decay index, | |
| Total duration, (hr) | |
| Total fluence, () | |
| Radiated energy, (erg) | |
| Bolometric peak flux, () | |
| Distance, (kpc) | |
| Pre-burst accretion luminosity, () | |
| Pre-burst mass-accretion rate, () |
5.3. Interaction with the Neutron Star Magnetic Field?
The properties of XMM J174457–2850.3 are reminiscent of the M28 source, and the two other MSRPs that show enhanced X-ray states. The state changes and X-ray flux variations observed in these three objects are thought to be related to the interplay between the neutron star’s magnetic field and the accretion disk (Section 1; e.g., Archibald et al., 2009; Linares et al., 2014; Papitto et al., 2014; Patruno et al., 2014).
A similar mechanism might be at work in XMM J174457–2850.3. If true, the source likely has a sizable magnetic field and may exhibit (fast) X-ray pulsations during accretion outbursts. However, the faintness of the source in the present data did not allow us to conduct meaningful pulsation searches. It might also exhibit radio pulsations during its quiescent X-ray state (). Sadly, it would be challenging to test this since the intrinsically faint radio emission would further suffer from scattering due to the very high absorption column density. Similarly, its 6.5 kpc distance and location in the crowded Galactic center field, make it difficult to search for gamma-ray emission such as detected from PSR J1023+0038 and XSS J12270–4859.
Support for this interpretation comes from the fact that the X-ray spectrum of XMM J174457–2850.3, a power law with index , is harder than that of other neutron star LMXBs detected in the same luminosity range (; R. Wijnands et al. in preparation). This does not seem to be an effect of the high absorption (), since other strongly absorbed neutron star LMXBs in the Galactic center display regular soft spectra (e.g., AX J1745.6–2901, GRS 1741–2853, KS 1741–293; Maeda et al., 1996; Sakano et al., 2002; Degenaar & Wijnands, 2009, 2010; Degenaar et al., 2012b; Degenaar & Wijnands, 2013). The M28 source also displays a strikingly hard X-ray spectrum (), and another common feature of the two is the lack of strong spectral evolution, despite 4–5 orders of magnitude change in X-ray luminosity (Linares et al., 2014). These similarities may provide additional support for hypothesis that the peculiar X-ray flux behavior of XMM J174457–2850.3 is related to the interaction between the accretion flow and the magnetic field of the neutron star.
5.4. Similar Behavior in Other LMXBs?
It is worth considering whether the X-ray behavior of XMM J174457–2850.3 (and the MRSP/LMXB transitional objects) is common. There are several neutron star LMXBs that have been observed at multiple epochs and appear to sustain a stable quiescent X-ray luminosity, or only show a steady decrease in thermal luminosity that is attributed to a gradual cooling of the hot neutron star (e.g., Cackett et al., 2008, 2010a; Degenaar et al., 2013b, 2014; Servillat et al., 2012; Guillot et al., 2013). However, there are several other sources that display some form of flux variations in between their outburst () and quiescence levels ().
Cen X-4, Aql X-1, SAX J1808.4–3658 (a 2.5 ms X-ray pulsar), and EXO 1745–248 (in the globular cluster Terzan 5) all vary at on a timescales of hours and months/years (e.g., Rutledge et al., 2002; Campana et al., 2004, 2008; Cackett et al., 2010b, 2011; Degenaar & Wijnands, 2012). Furthermore, KS 1741–293, XTE J1701–462, GRS 1741–2853, and SAX J1750.8–2900 have shown “mini” accretion outbursts during which their luminosity increased from quiescence () to for a few days (Degenaar & Wijnands, 2010, 2013; Fridriksson et al., 2011; Wijnands & Degenaar, 2013). Finally, GRO J1744–28 (a 0.5-s X-ray pulsar) may also exhibit extended low-luminosity states at such as seen in XMM J174457–2850.3 (e.g., Wijnands & Wang, 2002; Degenaar et al., 2012b), and somewhat similar quasi-stable low states are seen in 4U 1608–52 and SAX J1747.0–2853, albeit at a higher luminosity of (e.g., Wijnands et al., 2002; Šimon, 2004; Degenaar et al., 2012b).
There is thus considerable X-ray variability observed for neutron star LMXBs in between their outburst and quiescent levels. Two of the sources mentioned above (SAX J1808.4–3658 and GRO J1744–28) are known to be X-ray pulsars, indicating the magnetic field of these neutron stars could be involved in the X-ray variability. Indeed, it has been proposed that SAX J1808.4–3658 acts as a MSRP during X-ray quiescent state, although no radio pulsations have been detected (e.g., Burderi et al., 2003). It is unclear, however, if the interaction of the neutron star magnetic field and the accretion flow can account for the X-ray variability in all these LMXBs. For instance, LMXBs harboring a black hole instead of a neutron star also display considerably X-ray variability in between outburst and quiescence (e.g., Kong et al., 2002; Hynes et al., 2004; Tomsick et al., 2004), which clearly requires a different explanation.
References
- Alpar et al. (1982) Alpar, M. A., Cheng, A. F., Ruderman, M. A., & Shaham, J. 1982, Nature, 300, 728
- Archibald et al. (2009) Archibald, A. M., Stairs, I. H., Ransom, S. M., et al. 2009, Science, 324, 1411
- Arnaud (1996) Arnaud, K. A. 1996, in Astronomical Society of the Pacific Conference Series, Vol. 101, Astronomical Data Analysis Software and Systems V, ed. G. H. Jacoby & J. Barnes, 17
- Barlow et al. (2012) Barlow, B. N., Barthelmy, S. D., Gronwall, C., Palmer, D. M., & Zhang, B.-B. 2012, GRB Coordinates Network, 13619
- Barthelmy et al. (2005) Barthelmy, S. D., Barbier, L. M., Cummings, J. R., et al. 2005, Space Science Reviews, 120, 143
- Bassa et al. (2014) Bassa, C. G., Patruno, A., Hessels, J. W. T., et al. 2014, MNRAS, 441, 1825
- Bhattacharya & van den Heuvel (1991) Bhattacharya, D., & van den Heuvel, E. P. J. 1991, Phys. Rep., 203, 1
- Bildsten (1998) Bildsten, L. 1998, in NATO ASIC Proc. 515: The Many Faces of Neutron Stars., ed. R. Buccheri, J. van Paradijs, & A. Alpar, 419
- Bogdanov et al. (2011) Bogdanov, S., Archibald, A. M., Hessels, J. W. T., et al. 2011, ApJ, 742, 97
- Bogdanov et al. (2014) Bogdanov, S., Patruno, A., Archibald, A. M., et al. 2014, ApJ, 789, 40
- Burderi et al. (2003) Burderi, L., Di Salvo, T., D’Antona, F., Robba, N. R., & Testa, V. 2003, A&A, 404, L43
- Burrows et al. (2005) Burrows, D. N., Hill, J. E., Nousek, J. A., et al. 2005, Space Science Reviews, 120, 165
- Cackett et al. (2010a) Cackett, E. M., Brown, E. F., Cumming, A., et al. 2010a, ApJ, 722, L137
- Cackett et al. (2010b) Cackett, E. M., Brown, E. F., Miller, J. M., & Wijnands, R. 2010b, ApJ, 720, 1325
- Cackett et al. (2011) Cackett, E. M., Fridriksson, J. K., Homan, J., Miller, J. M., & Wijnands, R. 2011, MNRAS, 414, 3006
- Cackett et al. (2008) Cackett, E. M., Wijnands, R., Miller, J. M., Brown, E. F., & Degenaar, N. 2008, ApJ, 687, L87
- Campana et al. (2004) Campana, S., Israel, G. L., Stella, L., Gastaldello, F., & Mereghetti, S. 2004, ApJ, 601, 474
- Campana et al. (2008) Campana, S., Stella, L., & Kennea, J. A. 2008, ApJ, 684, L99
- Chen et al. (1997) Chen, W., Shrader, C. R., & Livio, M. 1997, ApJ, 491, 312
- Coriat et al. (2012) Coriat, M., Fender, R. P., & Dubus, G. 2012, MNRAS, 424, 1991
- de Martino et al. (2013) de Martino, D., Belloni, T., Falanga, M., et al. 2013, A&A, 550, A89
- Degenaar et al. (2012a) Degenaar, N., Kennea, J. A., Wijnands, R., Miller, J. M., & Gehrels, N. 2012a, ATel, 4308
- Degenaar et al. (2013a) Degenaar, N., Miller, J. M., Wijnands, R., Altamirano, D., & Fabian, A. C. 2013a, ApJ, 767, L37
- Degenaar & Wijnands (2009) Degenaar, N., & Wijnands, R. 2009, A&A, 495, 547
- Degenaar & Wijnands (2010) —. 2010, A&A, 524, A69
- Degenaar & Wijnands (2012) —. 2012, MNRAS, 422, 581
- Degenaar & Wijnands (2013) Degenaar, N., & Wijnands, R. 2013, in IAU Symposium, Vol. 290, IAU Symposium, ed. C. M. Zhang, T. Belloni, M. Méndez, & S. N. Zhang, 113–116
- Degenaar et al. (2012b) Degenaar, N., Wijnands, R., Cackett, E. M., et al. 2012b, A&A, 545, A49
- Degenaar et al. (2011) Degenaar, N., Wijnands, R., & Kaur, R. 2011, MNRAS, 414, L104
- Degenaar et al. (2010a) Degenaar, N., Wijnands, R., Kennea, J., & Gehrels, N. 2010a, ATel, 2770
- Degenaar et al. (2012c) Degenaar, N., Wijnands, R., Kennea, J. A., Miller, J. M., & Gehrels, N. 2012c, ATel, 4305
- Degenaar et al. (2010b) Degenaar, N., Jonker, P. G., Torres, M. A. P., et al. 2010b, MNRAS, 404, 1591
- Degenaar et al. (2013b) Degenaar, N., Wijnands, R., Brown, E. F., et al. 2013b, ApJ, 775, 48
- Degenaar et al. (2014) Degenaar, N., Medin, Z., Cumming, A., et al. 2014, ArXiv:1403.2385
- Drave et al. (2014) Drave, S. P., Bird, A. J., Sidoli, L., et al. 2014, MNRAS, 439, 2175
- Ekşİ & Alpar (2005) Ekşİ, K. Y., & Alpar, M. A. 2005, ApJ, 620, 390
- Enoto et al. (2014) Enoto, T., Sasano, M., Yamada, S., et al. 2014, ApJ, 786, 127
- Falanga et al. (2008) Falanga, M., Chenevez, J., Cumming, A., et al. 2008, A&A, 484, 43
- Fridriksson et al. (2011) Fridriksson, J. K., Homan, J., Wijnands, R., et al. 2011, ApJ, 736, 162
- Fujimoto et al. (1981) Fujimoto, M. Y., Hanawa, T., & Miyaji, S. 1981, ApJ, 247, 267
- Galloway et al. (2008) Galloway, D. K., Muno, M. P., Hartman, J. M., Psaltis, D., & Chakrabarty, D. 2008, ApJS, 179, 360
- Garmire et al. (2003) Garmire, G. P., Bautz, M. W., Ford, P. G., Nousek, J. A., & Ricker, Jr., G. R. 2003, in Presented at the Society of Photo-Optical Instrumentation Engineers (SPIE) Conference, Vol. 4851, Society of Photo-Optical Instrumentation Engineers (SPIE) Conference Series, ed. J. E. Truemper & H. D. Tananbaum, 28
- Guillot et al. (2013) Guillot, S., Servillat, M., Webb, N. A., & Rutledge, R. E. 2013, ApJ, 772, 7
- Hameury & Lasota (2014) Hameury, J.-M., & Lasota, J.-P. 2014, ArXiv:1407.3156
- Hill et al. (2011) Hill, A. B., Szostek, A., Corbel, S., et al. 2011, MNRAS, 415, 235
- Hill et al. (2004) Hill, J. E., Burrows, D. N., Nousek, J. A., et al. 2004, in Society of Photo-Optical Instrumentation Engineers (SPIE) Conference Series, Vol. 5165, Society of Photo-Optical Instrumentation Engineers (SPIE) Conference Series, ed. K. A. Flanagan & O. H. W. Siegmund, 217–231
- Hynes et al. (2004) Hynes, R. I., Charles, P. A., Garcia, M. R., et al. 2004, ApJ, 611, L125
- in ’t Zand et al. (2005) in ’t Zand, J. J. M., Cornelisse, R., & Méndez, M. 2005, A&A, 440, 287
- in ’t Zand et al. (2007) in ’t Zand, J. J. M., Jonker, P. G., & Markwardt, C. B. 2007, A&A, 465, 953
- Kenter et al. (2000) Kenter, A. T., Chappell, J. H., Kraft, R. P., et al. 2000, in Presented at the Society of Photo-Optical Instrumentation Engineers (SPIE) Conference, Vol. 4012, Society of Photo-Optical Instrumentation Engineers (SPIE) Conference Series, ed. J. E. Truemper & B. Aschenbach, 467
- King et al. (1996) King, A. R., Kolb, U., & Burderi, L. 1996, ApJ, 464, L127
- Kong et al. (2002) Kong, A. K. H., McClintock, J. E., Garcia, M. R., Murray, S. S., & Barret, D. 2002, ApJ, 570, 277
- Kuulkers et al. (2003) Kuulkers, E., den Hartog, P. R., in ’t Zand, J. J. M., et al. 2003, A&A, 399, 663
- Lasota (2001) Lasota, J.-P. 2001, New Astronomy Review, 45, 449
- Linares (2014) Linares, M. 2014, ArXiv:1406.2384
- Linares et al. (2009) Linares, M., Watts, A. L., Wijnands, R., et al. 2009, MNRAS, 392, L11
- Linares et al. (2014) Linares, M., Bahramian, A., Heinke, C., et al. 2014, MNRAS, 438, 251
- Lipunov et al. (1992) Lipunov, V. M., Börner, G., & Wadhwa, R. S. 1992, Astrophysics of Neutron Stars
- Maccarone & Patruno (2013) Maccarone, T. J., & Patruno, A. 2013, MNRAS, 428, 1335
- Maeda et al. (1996) Maeda, Y., Koyama, K., Sakano, M., Takeshima, T., & Yamauchi, S. 1996, PASJ, 48, 417
- Masetti et al. (2007) Masetti, N., Landi, R., Pretorius, M. L., et al. 2007, A&A, 470, 331
- Mauerhan et al. (2009) Mauerhan, J. C., Muno, M. P., Morris, M. R., et al. 2009, ApJ, 703, 30
- Meyer & Meyer-Hofmeister (1983) Meyer, F., & Meyer-Hofmeister, E. 1983, A&A, 121, 29
- Papitto et al. (2013a) Papitto, A., Bozzo, E., Ferrigno, C., et al. 2013a, ATel, 4959
- Papitto et al. (2014) Papitto, A., Torres, D. F., & Li, J. 2014, MNRAS, 438, 2105
- Papitto et al. (2013b) Papitto, A., Ferrigno, C., Bozzo, E., et al. 2013b, Nature, 501, 517
- Papitto et al. (2013c) Papitto, A., Hessels, J. W. T., Burgay, M., et al. 2013c, ATel, 5069
- Patel et al. (2007) Patel, S. K., Zurita, J., Del Santo, M., et al. 2007, ApJ, 657, 994
- Patruno et al. (2014) Patruno, A., Archibald, A. M., Hessels, J. W. T., et al. 2014, ApJ, 781, L3
- Peng et al. (2007) Peng, F., Brown, E. F., & Truran, J. W. 2007, ApJ, 654, 1022
- Romano et al. (2011) Romano, P., La Parola, V., Vercellone, S., et al. 2011, MNRAS, 410, 1825
- Roy et al. (2014) Roy, J., Bhattacharyya, B., & Ray, P. S. 2014, ATel, 5890
- Rutledge et al. (2002) Rutledge, R. E., Bildsten, L., Brown, E. F., Pavlov, G. G., & Zavlin, V. E. 2002, ApJ, 577, 346
- Sakano et al. (2002) Sakano, M., Koyama, K., Murakami, H., Maeda, Y., & Yamauchi, S. 2002, ApJS, 138, 19
- Sakano et al. (2005) Sakano, M., Warwick, R. S., Decourchelle, A., & Wang, Q. D. 2005, MNRAS, 357, 1211
- Servillat et al. (2012) Servillat, M., Heinke, C. O., Ho, W. C. G., et al. 2012, MNRAS, 423, 1556
- Sidoli (2013) Sidoli, L. 2013, ArXiv:1301.7574
- Simonsen (2011) Simonsen, M. 2011, Journal of the American Association of Variable Star Observers (JAAVSO), 39, 66
- Simonsen et al. (2014) Simonsen, M., Bohlsen, T., Hambsch, F.-J., & Stubbings, R. 2014, Journal of the American Association of Variable Star Observers (JAAVSO), 42, 199
- Stappers et al. (2014) Stappers, B. W., Archibald, A. M., Hessels, J. W. T., et al. 2014, ApJ, 790, 39
- Strohmayer & Bildsten (2006) Strohmayer, T., & Bildsten, L. 2006, New views of thermonuclear bursts, ed. M. Lewin, W. H. G. & van der Klis, 113–156
- Strohmayer et al. (1996) Strohmayer, T. E., Zhang, W., Swank, J. H., et al. 1996, ApJ, 469, L9
- Strüder et al. (2001) Strüder, L., Briel, U., Dennerl, K., et al. 2001, A&A, 365, L18
- Szkody et al. (2013) Szkody, P., Albright, M., Linnell, A. P., et al. 2013, PASP, 125, 1421
- Tauris (2012) Tauris, T. M. 2012, Science, 335, 561
- Tomsick et al. (2004) Tomsick, J. A., Kalemci, E., & Kaaret, P. 2004, ApJ, 601, 439
- Turner et al. (2001) Turner, M. J. L., Abbey, A., Arnaud, M., et al. 2001, A&A, 365, L27
- Šimon (2004) Šimon, V. 2004, A&A, 418, 617
- van Paradijs (1996) van Paradijs, J. 1996, ApJ, 464, L139
- Verner et al. (1996) Verner, D. A., Ferland, G. J., Korista, K. T., & Yakovlev, D. G. 1996, ApJ, 465, 487
- Wijnands & Degenaar (2013) Wijnands, R., & Degenaar, N. 2013, MNRAS, 434, 1599
- Wijnands et al. (2002) Wijnands, R., Miller, J. M., & Wang, Q. D. 2002, ApJ, 579, 422
- Wijnands & van der Klis (1998) Wijnands, R., & van der Klis, M. 1998, Nature, 394, 344
- Wijnands & Wang (2002) Wijnands, R., & Wang, Q. D. 2002, ApJ, 568, L93
- Wijnands et al. (2006) Wijnands, R., in ’t Zand, J. J. M., Rupen, M., et al. 2006, A&A, 449, 1117
- Wilms et al. (2000) Wilms, J., Allen, A., & McCray, R. 2000, ApJ, 542, 914