Oscillatory behavior of chromospheric fine structures in a network and a semi-active regions
Abstract
In the present work, we study the periodicities of oscillations in dark fine structures using observations of a network and a semi-active region close to the solar disk center. We simultaneously obtained spatially high resolution time series of white light images and narrow band images in the H line using the 2D Göttingen spectrometer, which were based on two Fabry-Perot interferometers and mounted in the VTT/Observatorio del Teide/Tenerife. During the observations, the H line was scanned at 18 wavelength positions with steps of 125 mÅ. We computed series of Doppler and intensity images by subtraction and addition of the H 0.3 Å and 0.7 Å pairs, sampling the upper chromosphere and the upper photosphere, respectively. Then we obtained power, coherence and phase difference spectra by performing a wavelet analysis to the Doppler fluctuations. Here, we present comparative results of oscillatory properties of dark fine structures seen in a network and a semi-active region.
keywords:
Sun:chromosphere – fine structures: oscillations1 Introduction
When observing the quiet solar chromosphere in the H line, dark elongated fine structures can be seen especially in the borders of the supergranular cells (magnetic network). These structures are called mottles on the disk and spicules at the limb and they seem to originate from network bright points. Mottles form into two kind of groups, namely rosettes and chains. They have lengths between , widths smaller than and lifetimes of the order of 10 minutes (Beckers, 1963, 1968; Bray & Loughhead, 1974; Suematsu et al., 1995). It has been considered that mottles are the disk counterparts of spicules and that the driving mechanism of these structures has the same origin (Tsiropoula et al., 1994; Suematsu et al., 1995; Christopoulou et al., 2001; Hansteen et al., 2006; Rouppe van der Voort et al., 2007). These jet-like features act as channels trough which energy and mass are supplied from the solar photosphere into the upper solar atmosphere and the solar wind (De Pontieu et al., 2004; De Pontieu & Erdlyi, 2006; Morton et al., 2012).
The active solar chromosphere in the H line core shows another sort of dark fine features named fibrils. They are mostly classified into two types, traditional fibrils and dynamic fibrils. Dynamic fibrils are jet-like features with higher decelerations, slightly lower velocities, shorter lifetimes and shorter lengths and located mostly in a dense active region plage, while traditional fibrils are low-lying features with lower decelerations, slightly higher velocities, longer lifetimes and longer lengths (for a more detailed description and their properties of these structures see Hansteen et al., 2006; De Pontieu & Erdlyi, 2006; Tsiropoula et al., 2012).
The study of oscillations and periodicities of these structures has become more important in recent years as they are believed to be an important source for the heating of the solar chromosphere. Several authors have investigated periodicities and oscillations in these structures. Dominant periods of order 5 minutes are reported in chromospheric mottles (Tziotziou et al., 2004; Tsiropoula et al., 2009; Bostancı, 2011). Similarly, the periods for the oscillations in more inclined dynamic fibrils are found to be in the 4 – 6 minute range (De Pontieu et al., 2004; Hansteen et al., 2006; De Pontieu & Erdlyi, 2006). These findings support the idea that normally evanescent photospheric 5 minute oscillations leak into the higher atmospheric layers along inclined flux tubes (De Pontieu et al., 2004).
Observations performed at photospheric levels show power enhancements at higher frequencies ( 5 mHz) in the surrounding active regions (Brown et al., 1992; Braun et al., 1992; Hindman & Brown, 1998; Thomas & Stanchfield, 2000; Muglach, 2003) and in quiet regions around the network magnetic elements (Krijger et al., 2001; Muglach et al., 2005). Such power enhancements are called power halos. On the other hand, chromospheric observations show power suppression called magnetic shadows at higher frequencies especially around magnetic network elements as well (Judge et al., 2001; Krijger et al., 2001; Finsterle et al., 2004; Reardon et al., 2009). Kontogiannis et al. (2010) observed in a rosette region at photospheric and chromospheric heights power enhancement and suppression for both the 5 and 3 minutes period bands.
Moreover, the transverse oscillations have also been investigated in spicules (Zaqarashvili & Erdlyi, 2009; Okamoto & de Pontieu, 2011), in mottles (Rouppe van der Voort et al., 2007; Kuridze et al., 2012; Morton et al., 2012; Kuridze et al., 2013) and in fibrils (Pietarila et al., 2011; Morton et al., 2014). There are several possible interpretations of these oscillatory phenomena such as kink waves propagating along magnetic flux tubes, volume-filling Alfvn waves propagating in surrounding spicular structures, and transverse pulses excited in the photospheric magnetic flux tube by means of buffeting of granules (see Zaqarashvili & Erdlyi, 2009, and references therein).
In this paper, taking advantage of 2D spectroscopic H observations, we investigate the oscillations in chromospheric dark fine structures at different levels of height in the solar atmosphere.
2 Observations & Data reduction
Observations of a network and a semi-active region were carried out in H near the solar disk center in May 2002. The data were obtained under good seeing conditions with the ‘Göttingen’ Fabry-Perot spectrometer, which was mounted in the Vacuum Tower Telescope at the Observatorio del Teide/Tenerife (Koschinsky et al., 2001; Bostancı, 2011). During the observations, 8 narrow-band images were recorded at 18 wavelength positions by scanning through the H line. A spacing of 125 mÅ between adjoining wavelength positions was selected for the spectral scans. The exposure time was 30 ms and the time interval between the start of two consecutive spectral scans was 49 s. The observed field of view of the raw data was 384286 with an image scale of 01 per pixel. Broad-band images were simultaneously taken with narrow-band images. Totally 60 spectral scans per region were acquired with the spectrometer. After the correction for dark current, flat field and image motion, the broad-band images per each scan were restored by using the spectral ratio (von der Lühe, 1984) and the speckle masking technique (Weigelt, 1977). The narrow-band images at each wavelength position sampling H line were reconstructed by using Keller & von der Lühe (1992)’s method.
Since our analysis requires the determination of Doppler and intensity fluctuations at individual height levels of the solar chromosphere, the H line profile for each pixel in the field of view (FOV) was reconstructed from intensity values of narrow band images belonging to 18 wavelength positions using spline interpolation.
We computed image time series at 0.3 Å and 0.7 Å from the H center so as to sample different layers of the solar atmosphere. We then formed intensity and Doppler time series by averaging and subtracting image pairs for each atmospheric layer. After the alignment of data cubes using Fourier cross-correlation techniques, the final FOV sizes of the network and semi-active regions reduced to 288162 and 306167, respectively.
In order to investigate the temporal properties of both observed regions, we performed the wavelet analysis to the Doppler fluctuations using the wavelet package (Torrence & Compo, 1998) with a Morlet wavelet function as the analysing function. Furthermore, we calculated the global wavelet spectrum for each pixel in the FOV of each observed region to obtain the spatial distribution of power. We then averaged the power over the following frequency bands; 0.73 – 1.75 mHz, 2.46 – 4.16 mHz and 4.93 – 8.31 mHz.
We employed a cross wavelet transform (Torrence & Compo, 1998) to derive coherence and phase difference spectra between Doppler fluctuations at H 0.3 Å and H 0.7 Å sampling the upper chromospheric and the upper photospheric heights, respectively. Just as in the same way as the power maps, coherence and phase differences for each pixel in the FOV were calculated and then averaged over the selected frequency bands. Since we took the difference between chromospheric and photospheric signals, positive and negative values in the phase difference maps indicate upward and downward propagating waves, respectively.
The Network Region
The Semi-Active Region
3 Results & Discussions
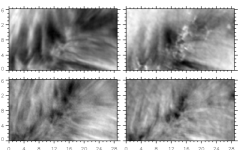
We show in Figure 1 the temporal averaged intensity and Doppler images corresponding to different depths in the atmosphere for the network (upper two rows) and the semi-active (lower two rows) regions. In the network region, mottles spread out from bright points occupying the network boundary, while in the semi-active region fibrils extend from two groups of bright points located around the lower center and the upper right of the FOV. Morphologies of mottles and fibrils vary in relevant intensity images belonging to different atmospheric layers. They are highly structured and more elongated in different inclinations and directions at 0.3 Å from H center, corresponding to the chromosphere, but they are less outstanding at 0.7 Å from the line center, corresponding to the upper photosphere (for details on H line formation see, e.g., Leenaarts et al., 2012). Moreover, the pattern of granules and bright points become visible at the lowest layer. In the temporal averaged Doppler images, darker and lighter shades of grey indicate downflows and upflows, respectively. Brighter and darker elongated structures seen in areas where mottles and fibrils are found in the intensity images, point to the presence of upward and downward motion along these structures. Darker areas close to the bright points indicate that the downflows are significant at the foot point of mottles and fibrils.
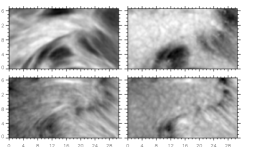
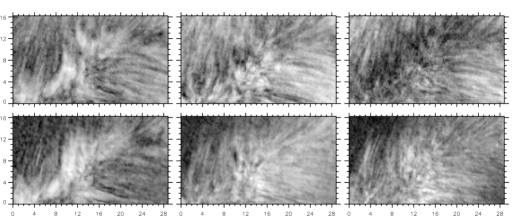
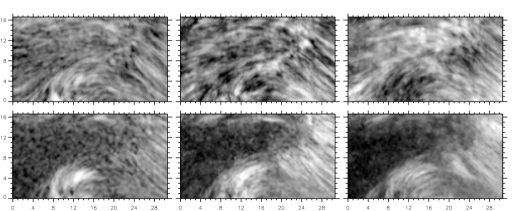
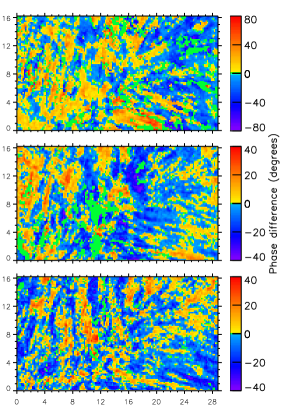
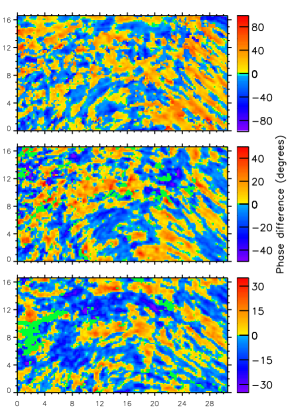
We present the averaged Doppler power, coherence and phase difference maps over the three frequency bands for the mottles and fibrils regions in Figures 2, 3 and 4. Brighter patches in the power maps corresponds to strong power. Positive (red) and negative (blue) values in phase difference maps indicate upward and downward propagation, respectively.
The Network Region
The Semi-Active Region
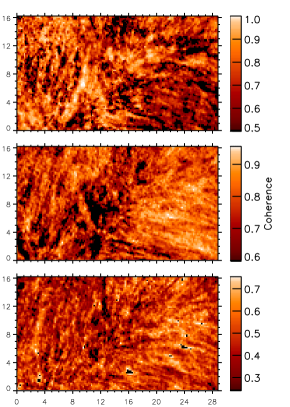
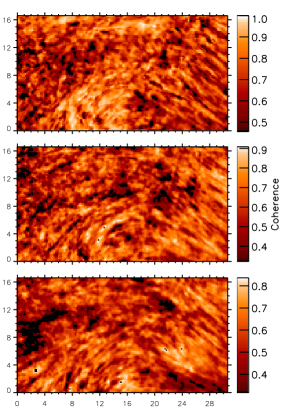
Low frequency range, 0.73 – 1.75 mHz: In the mottles region the power spreads from the network to the structures at the highest atmospheric layer while it is more concentrated on the network at lower layers. In the fibrils region the power seems to cover the whole FOV at the highest layer, but the power occurs primarily on fibrils, especially on the fibril group located around the lower center part of the FOV. The power also shows granular distribution in the absence of mottles or fibrils at the lower layers.
The network region, outlined with a large number of bright points, is positioned diagonally in the FOV (see the mean intensity image for H 0.7 Å in Figure 1). Here, the phase differences are mostly positive (a mean value of about 20∘) with higher coherence, showing the existence of upward propagating waves. In the inter-network regions covered by inclined mottles, phase differences have both positive and negative values with a mean value of about –3∘, indicating the presence of both upward and downward propagating waves. Similarly, Gupta et al. (2013) observed pronounced upward propagation at magnetic network regions and a mixture of upward and downward propagation at other locations. Furthermore, Vecchio et al. (2007) showed that chromospheric acoustic power at lower frequencies below the acoustic cut-off, directly propagates upward from the photosphere in the proximity of the magnetic network elements.
In the fibrils region, higher coherence is specially seen in the fibril group located on the lower center part of the FOV, whereas fibrils located on the right part of the FOV have slightly lower coherence. In phase difference maps, fibrils on lower center of FOV have both positive and negative values while on the right of FOV positive phase differences are more significant in the form of fibrils. Similarly the contrast in these fibril groups was also observed on power maps; on fibrils at the lower center part, power is getting dimmer through the higher atmospheric layers, whereas power is getting more significant on fibrils at the right part. This increase in the power can be interpreted as leakage of p-modes along inclined magnetic fields into the chromosphere (De Pontieu et al., 2004; Jefferies et al., 2006; Vecchio et al., 2007). This reveals differences in magnetic topologies of two fibril groups in the FOV as well.
Intermediate frequency range, 2.46 – 4.16 mHz: this is centered at 5 minutes. At the highest atmospheric height, for both observed regions, the power appears to occur somewhat diffused over the whole FOV with a small tendency to be less suppressed in areas where the power in low frequency range is significant. However, at lower atmospheric heights the power distribution is more pronounced on magnetic fields in the shape of mottles or fibrils. This is more obvious in the semi-active region.
Phase differences are negative with a mean value of about –25∘ in the surrounding network, where the coherence has higher value. This area corresponds to the food parts of mottles and seems quite dense as a result of overlapping of these parts. The negative phase differences here indicate downward reflected waves by the inclined magnetic fields. However, in areas far from the network, where distances between neighbouring mottles get larger (the upper left or the lower right corner parts of FOV), the phase differences are mostly positive. This may point to waves which propagate upward and are not impeded by the inclined magnetic fields (Kontogiannis et al., 2010). The downward propagation shows itself in power maps as well. The power in areas around the magnetic network is suppressed at chromospheric heights, but it is significant at photospheric heights. Lawrence & Cadavid (2010) found power suppression in the presence of magnetic fields for both G-band and Ca II H-line oscillations in the frequency range 5.5 f 8.0 mHz. Kontogiannis et al. (2010) observed similar power suppression in 3 and 5 minute ranges at chromospheric heights but they found it more significant in the 3 minute range. Morton et al. (2014) reported that the velocity power appears to decrease significantly from the chromosphere to the corona, with the power of the high-frequency waves decreasing to a much greater degree. In our observation, we found that the power suppression exists in mottles in the 3 and 5 minute ranges although more noticeable at 3 minutes. This phenomena is known as ’magnetic shadow’ described in the introduction. Using 2D simulations Rosenthal et al. (2007) showed that in regions called magnetic canopy, where the magnetic field is significantly inclined to the vertical, waves could be reflected at a surface whose altitude is highly variable having consequences on the oscillatory processes.
In the 5 minute band the phase differences have mostly negative values in fibrils on lower center part of the FOV, whereas fibrils on the right part of the FOV show both positive and negative phase differences. In the corresponding power maps, while the power concentrates in fibrils at photospheric heights, it gets weaker and shows almost uniform distribution with a tendency to be some significant on areas where a large number of magnetic features are closely packed at chromospheric heights.
High frequency range, 4.93 – 8.31 mHz: this is the 3 minute range. It can be noticed that both observed regions show similar behavior. The power distribution shows suppression in locations of mottles or fibrils at the highest atmospheric layer. However, in contrast with this view, the power becomes significant on magnetic fields (i.e. in mottles or fibrils) at the lower atmospheric heights.
Coherence maps reveal fibrillar structures clearly in the 3 minute range as well as in the 5 minute range. There seems to be an increase of the coherence in the lower-right area of the mottles FOV. This area corresponds to the region of less dense structures. Both positive and negative phase values are seen over the FOV. Considering the power maps, one can conclude that the wave reflection for this frequency range is stronger than that for the 5 minute range (Vecchio et al., 2007). As a result, the power suppression in the 3 minute range seems to be stronger than the suppression in the 5 minute range. However, the phase values do not reflect this situation. This finding might indicate that waves of downward propagation are overwhelmed by waves of upward propagation. De Wijn et al. (2009) reported a similar behaviour for the 5 minute range.
In the phase difference maps of the fibrils region, both positive and negative values are seen in two fibril groups in the FOV, while negative phase values are noticeable in the fibril-free region. However, in the power maps from photosphere to chromosphere, fibrils shows a power suppression while the fibril-free region shows a power increase. It can be said that positive phase difference may indicate waves which are not obstructed by the inclined magnetic fields and travel upward, while downward directed waves may be the result of the reflection of acoustic oscillations at the inclined magnetic fields (Kontogiannis et al., 2010). On the other hand, this view does not explain the negative phase values, which occurs in the fibril-free region. On the contrary, there is also a power increase in this region upward to the chromosphere. This could indicate downward directed and damped oscillations. The same area shows positive phase values and a diffuse power increase in the chromospheric heights in the 5 minute band. It is questionable if this is a result of wave refraction.
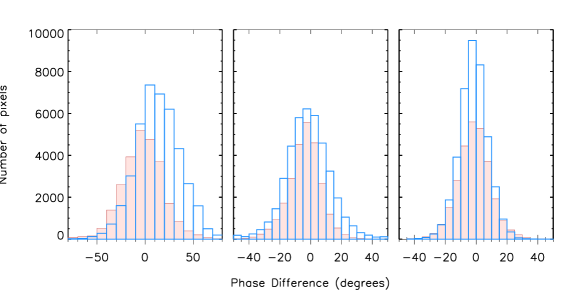
Following dark elongated fine structures such as mottles and fibrils during their life time in H is a complex task since their shape and length change continuously and their contrast is not sufficient to outline these structures. For the definition of their areas in the FOV we used the time averaged intensity image at 0.3 Å from the line center and masked the pixels, where values lie under the mean value of the image. We show in Figure 5 the distributions of phase differences in the three frequency bands for both structures (mottles and fibrils) selected by masks. In the low frequency range, while the phase values for the mottles exhibit a Gaussian distribution, the phases for the fibrils lie predominantly in the positive region. In the intermediate frequency range, the phase values for the mottles lie mainly in the negative region, while in the high frequency range they show a relatively symmetrically distribution around zero confirming the results derived from the phase maps. The phase values for the fibrils in the 5 and 3 minute ranges are also symmetrically distributed around zero, showing a slightly higher number of negative values, but there is no obvious dominance.
4 Conclusion
De Wijn et al. (2009) investigated the oscillations in a plage and expressed that the 5 minute oscillations can only propagate along inclined magnetic field lines and not in the central region of the plage, where the magnetic field is expected to be vertical. However, in the present study, a power increase is seen in the chromospheric heights on network bright points in the 5 minute band. Roberts (1983) proposed that radiative losses in thin flux tubes can lead to a significant reduction of the cutoff frequency. This mechanism enables propagation of the 5-minute oscillations to the chromosphere in the vertical magnetic structures. Afterwards, Centeno et al. (2006, 2009) and Khomenko et al. (2008) stated that if the radiative relaxation time is short enough, then the acoustic cut-off frequency would decrease to lower values and this would allow the vertical propagation of 5 minute waves to the chromosphere. Heggland et al. (2011) found in their simulations 5 minute long-period oscillations to be dominant in strong and inclined magnetic field, while the 3 minute oscillations to be dominant in areas with weak or vertical magnetic fields. Nutto et al. (2012) connected the slow acoustic mode power observed on magnetic network elements to mode conversion. In the present study, the power of the 3 minute oscillations gets stronger with increasing atmospheric heights in regions where the magnetic field is weak. But it is difficult to say that the 5 minute waves propagate along inclined magnetic fields. On the contrary to this, we found for both regions in areas of inclined magnetic fields a power suppression, which is stronger in the 3 minute band, confirming the results of Kontogiannis et al. (2010). A power increase in inclined magnetic fields through higher atmospheric heights is seen for the low frequency range, which may be a signature of leakage of p-modes (De Pontieu et al., 2004; Jefferies et al., 2006; Vecchio et al., 2007). In the same frequency range, our investigations revealed the presence of propagating waves in the magnetic network, which was also reported by Gupta et al. (2013). In relation with the intermediate frequency range, a weak power suppression was found in regions of inclined magnetic fields for both FOVs showing negative phase differences and indicating downward reflected waves. A stronger suppression was observed for the high frequency range, while the phase values did not reflect this case. This may be due to a overwhelming of downward propagating signals by upward propagating signals. One of the interesting results of this study is the negative phase values in the 3 minute band and the positive phase values in the 5 minute band, which occurs for the same area in a fibril-free region. A possible explanation for the negative phase values could be downward directed and damped oscillations since the power decreases towards lower heights.
Acknowledgments
We would like to thank the referee for valuable comments and suggestions. We are also indebted to Franz Kneer for helpful comments and suggestions. A. Gültekin recognizes a support from Scientific Research Projects Coordination Unit of Istanbul University. Project number UDP-24161. This work was partially supported by Deutsche Forschungsgemeinschaft through grant Kn 152/26-1. The Vacuum Tower Telescope is operated by the Kiepenheuer-Institut für Sonnenphysik, Freiburg, at the Spanish Observatorio del Teide of the Instituto de Astrofsica de Canarias.
References
- Beckers (1963) Beckers, J. M. 1963, ApJ, 138, 648
- Beckers (1968) Beckers, J. M. 1968, Sol. Phys., 3, 367
- Bostancı (2011) Bostancı, Z. F., 2011, AN, 332, 815
- Braun et al. (1992) Braun, D. C., Duvall, T. L., Jr., Labonte, B. J., Jefferies, S. M., Harvey, J. W., Pomerantz, M. A., 1992, ApJ, 391, L113
- Bray & Loughhead (1974) Bray, R. J. & Loughhead, R. E. 1974, The Solar Chromosphere
- Brown et al. (1992) Brown, T. M., Bogdan, T. J., Lites, B. W. & Thomas, J. H., 1992, ApJ, 394, L65
- Centeno et al. (2006) Centeno, R., Collados, M. & Trujillo Bueno, J. 2006, ApJ, 640, 1153
- Centeno et al. (2009) Centeno, R., Collados, M. & Trujillo Bueno, J. 2009, ApJ, 692, 1211
- Christopoulou et al. (2001) Christopoulou, E. B., Georgakilas, A. A. & Koutchmy, S. 2001, Sol. Phys., 199, 61
- De Pontieu et al. (2004) De Pontieu, B., Erdlyi, R. & James, S. P. 2004, Nature, 430, 536
- De Pontieu & Erdlyi (2006) De Pontieu, B. & Erdlyi, R., 2006, R. Soc. Lond. Phil. Trans. Ser. A, 364, 383
- De Wijn et al. (2009) De Wijn, A. G., McIntosh, S. W. & De Pontieu, B., 2009, ApJ, 702, L168
- Finsterle et al. (2004) Finsterle, W., Jefferies, S.M., Cacciani, A., Rapex, P., Giebink, C., Knox, A. & Dimartino, V., 2004, Sol. Phys., 220, 317
- Gupta et al. (2013) Gupta, G. R., Subramanian, S., Banerjee, D., Madjarska, M. S. & Doyle, J. G., 2013, Sol.Phys, 282, 67
- Hansteen et al. (2006) Hansteen V. H., De Pontieu B., Rouppe van der Voort L., van Noort M. & Carlsson M., 2006, ApJ 647, L73
- Heggland et al. (2011) Heggland, L., Hansteen, V. H., de Pontieu, B. & Carlsson, M., 2011, ApJ, 743, 142
- Hindman & Brown (1998) Hindman, B. W. & Brown, T. M., 1998, ApJ, 504, 1029
- Jefferies et al. (2006) Jefferies, S. M., McIntosh, S. W. & Armstrong, J. D., et al. 2006, ApJ, 648, L151
- Judge et al. (2001) Judge, P.G., Tarbell, T.D. & Wilhelm, K., 2001, ApJ, 554, 424
- Keller & von der Lühe (1992) Keller, C. & von der Lühe, O., 1992, A&A, 261, 321
- Khomenko et al. (2008) Khomenko, E., Centeno, R., Collados, M. & Trujillo Bueno, J., 2008, ApJ, 679, 85
- Khomenko & Calvo Santamaria (2013) Khomenko E. & Calvo Santamaria I., 2013, J. Phys.: Conf. Ser., 440, 012048
- Kontogiannis et al. (2010) Kontogiannis, I., Tsiropoula, G. & Tziotziou, K., 2010, A&A, 510, A41
- Koschinsky et al. (2001) Koschinsky, M., Kneer, F. & Hirzberger, J., 2001, A&A, 365, 588
- Krijger et al. (2001) Krijger, J.M., Rutten, R. J., Lites, B. W., Straus, T., Shine, R. A. & Tarbell, T. D., 2001, A&A, 379, 1052
- Kuridze et al. (2012) Kuridze, D., Morton, R. J., Erdlyi, R., Dorrian, G. D., Mathioudakis, M., Jess, D. B. & Keenan, F. P., 2012, ApJ, 750, 51
- Kuridze et al. (2013) Kuridze, D., Verth, G., Mathioudakis, M., Erdlyi, R., Jess, D. B., Morton, R. J., Christian, D. J. & Keenan, F. P., 2013, ApJ, 779, 82
- Lawrence & Cadavid (2010) Lawrence, J. K. & Cadavid, A. C., 2010, Solar Phys., 261, 35
- Leenaarts et al. (2012) Leenaarts, J., Carlsson, M., & Rouppe van der Voort, L. 2012, ApJ, 749, 136
- Morton et al. (2012) Morton, R.J., Verth, G., Jess, D. B., Kuridze, D., Ruderman, M. S., Mathioudakis, M., Erdlyi, R., 2012, Nat. Comms., 3, 1315
- Morton et al. (2014) Morton, R. J., Verth, G., Hillier, A., Erdlyi, R., 2014, ApJ, 784, 29
- Muglach (2003) Muglach, K. 2003, A&A, 401, 685
- Muglach et al. (2005) Muglach, K., Hofmann, A. & Staude, J. 2005, A&A, 437, 1055
- Nutto et al. (2012) Nutto, C., Steiner, O. & Roth, M., 2012, A&A, 542, L30
- Okamoto & de Pontieu (2011) Okamoto, T. J. & de Pontieu, B. ApJ, 2011, 736, L24
- Pietarila et al. (2011) Pietarila, A., Aznar Cuadrado, R., Hirzberger, J., Solanki, S. K., 2011, ApJ, 739, 92
- Reardon et al. (2009) Reardon, K. P., Uitenbroek, H. & Cauzzi, G., 2009, A&A, 500, 1239
- Roberts (1983) Roberts, B. 1983, Sol. Phys., 87, 77
- Rosenthal et al. (2007) Rosenthal, C. S., Bogdan, T. J., Carlsson, M., Dorch, S. B. F., Hansteen, V., McIntosh, S. W., McMurry, A., Nordlund, A. & Stein, R. F., 2002, ApJ, 564, 508
- Rouppe van der Voort et al. (2007) Rouppe van der Voort, L. H. M., De Pontieu, B., Hansteen, V. H., Carlsson, M. & van Noort, M., 2007, ApJ, 660, L169
- Suematsu et al. (1995) Suematsu, Y., Wang, H. & Zirin, H., 1995, ApJ, 450, 411
- Thomas & Stanchfield (2000) Thomas, J. H. & Stanchfield, D. C. H., 2000, ApJ, 537, 1086
- Tian & Xia (2008) Tian, H. & Xia, L., 2008, A&A, 488, 331
- Torrence & Compo (1998) Torrence, C. & Compo, G. P., 1998, Bull. Amer. Meteor. Soc., 79, 61
- Tsiropoula et al. (1994) Tsiropoula, G., Alissandrakis, C. E. & Schmieder, B. 1994, A&A, 290, 285
- Tsiropoula et al. (2009) Tsiropoula, G., Tziotziou, K., Schwartz, P. & Heinzel, P., 2009, A&A, 493, 217
- Tsiropoula et al. (2012) Tsiropoula, G., Tziotziou, K., Kontogiannis, I., Madjarska, M. S., Doyle, J. G. & Suematsu, Y., 2012, SSRv, 169, 181
- Tziotziou et al. (2004) Tziotziou, K., Tsiropoula, G. & Mein, P., 2004, A&A, 423, 1133
- Vecchio et al. (2007) Vecchio, A., Cauzzi, G., Reardon, K. P., Janssen, K. & Rimmele, T., 2007, A&A, 461, L1
- von der Lühe (1984) von der Lühe, O., 1984, J. Opt. Soc. Am. A 1, 510
- Weigelt (1977) Weigelt, G. P., 1977, Optics Comm., 21, 55
- Zaqarashvili & Erdlyi (2009) Zaqarashvili, T. V. & Erdlyi, R. 2009, Space Sci. Rev., 149, 355