A comparison of the morphological properties between local and infrared luminous galaxies. Are local and high (U)LIRGs different?
Abstract
Ultraluminous and luminous infrared galaxies (ULIRGs and LIRGs) are the most extreme star-forming galaxies in the universe, and dominate the total star formation rate density at . In the local universe (), the majority of ULIRGs and a significant portion of LIRGs are triggered by interactions between gas-rich spiral galaxies, yet it is unclear if this is still the case at high. To investigate the relative importance of galaxy interactions in infrared luminous galaxies, we carry out a comparison of optical morphological properties between local (U)LIRGs and (U)LIRGs at based on the same sample selection, morphology classification scheme, and optical morphology at similar rest-frame wavelengths. In addition, we quantify the systematics in comparing local and high datasets by constructing a redshifted dataset from local (U)LIRGs, in which its data quality mimics the high dataset. Based on the Gini- classification scheme, we find that the fraction of interacting systems decreases by 8% from local to , and it is consistent with the reduction between local and redshifted datasets (). Based on visual classifications, the merger fraction of local ULIRGs is found to be lower compared to published results, and the reduction due to redshifiting is . Consequently, the differences of merger fractions between local and (U)LIRGs is only 17%. These results demonstrate that there is no strong evolution in the fraction of (U)LIRGs classified as mergers at least out to . At , the morphology types of 30% of (U)LIRGs can not be determined due to their faintness in the -band, and thus the merger fraction measured at suffers from large uncertainties.
Subject headings:
galaxies: evolutiongalaxies: structureinfrared: galaxies1. Introduction
Ultraluminous infrared galaxies (ULIRGs; 111 in the object’s rest-frame ) and Luminous Infrared Galaxies (LIRGs; ) host the most intense star formation events in the universe. Locally (), the majority of ULIRGs and a significant portion of LIRGs are triggered by strong interactions between gas-rich spiral galaxies, where the bulk of the infrared emission is produced from dust heating by starbursts and/or an active galactic nucleus (AGN) (e.g. Sanders et al., 1988; Sanders & Mirabel, 1996). Detailed morphological and kinematic studies of (U)LIRGs have revealed various interacting features such as bridges, tidal tails, and complicated kinematic properties (e.g. Mihos & Bothun, 1998; Farrah et al., 2001; Veilleux et al., 2002; Colina et al., 2005). The strong correlation between galaxy interactions and (U)LIRGs can also be seen via the growing merger fraction and the progressing merger stage with increasing (e.g. Veilleux et al., 2002; Ishida, 2004; Haan et al., 2011; Ellison et al., 2013, Larson et al. in prep.). Extensive simulation work has also demonstrated that galaxy interactions can transport gas toward the merger nuclei where it can trigger enhanced star formation and AGN activities (e.g. Barnes & Hernquist, 1996; Mihos & Hernquist, 1996).
Although (U)LIRGs are relatively rare locally, they become increasingly important contributors to the total star formation rate density at high (e.g. at , Le Floc’h et al., 2005; Casey et al., 2012). However, it remains unclear if galaxy interactions are the dominant mechanism driving intense star formation in high (U)LIRGs. In fact, high star-forming galaxies are known to contain a higher fraction of gas compared to their local counterparts (Tacconi et al., 2008, 2010). Such enhanced gas fractions may increase the luminosity threshold between normal star formation and merger-driven starbursts (Hopkins et al., 2010). In these scenarios, high (U)LIRGs may be alternatively driven by secular accretion as opposed to galaxy interactions.
To investigate the role of galaxy interactions in high (U)LIRGs and to understand how the threshold between normal and merger-driven star formation varies across cosmic time, one can explore the frequency of mergers in these extreme star-forming systems and compare such frequencies at multiple epochs. Extensive studies have already been done via the characterization of rest-frame optical morphology (e.g. Lotz et al., 2008b; Dasyra et al., 2008; Melbourne et al., 2008; Kartaltepe et al., 2010, 2012; Hung et al., 2013). Although the percentage of mergers in LIRGs can vary from % (Kartaltepe et al., 2010; Hung et al., 2013) to only 1015% (Lotz et al., 2008b; Melbourne et al., 2008), there is a general trend that the merger fraction in high (U)LIRGs appears to be significantly lower compared to their local counterparts. For example, the merger fraction in ULIRGs found at and is (Kartaltepe et al., 2010, 2012; Hung et al., 2013), whereas a much higher merger fraction is found in local ULIRGs (, Farrah et al., 2001; Veilleux et al., 2002; Ishida, 2004).
The comparison between local and high datasets is often not straightforward. Two major factors influencing such comparisons are surface brightness dimming and band-shifting. Deep optical surveys of high galaxies correspond to rest-frame -band or shorter, yet galaxies may show very different structures when imaged at longer wavelengths (e.g. Cameron et al., 2011). Locally, high resolution/sensitivity imaging at rest-frame -band or longer wavelength can detect large-scale tidal features and other disturbed structures, enabling an unambiguous identification of merger signatures (e.g. Surace et al., 1998; Veilleux et al., 2002). Yet these extended features often fade away or become less prominent at shorter wavelengths or when artificially redshifted to high (Hibbard & Vacca, 1997; Petty et al., 2009). A proper consideration of the reduction of merger fractions that is purely due to data degradation and band-shifting is important when comparing local and high datasets.
Another complication may originate from the sample identification of (U)LIRGs. The majority of local (U)LIRGs have been identified from the Infrared Astronomical Satellite (IRAS) 60 All-Sky Survey (e.g. Kim & Sanders, 1998; Lawrence et al., 1999; Sanders et al., 2003). However, prior to the availability of observations from the Herschel Space Observatory (Pilbratt et al., 2010), the selection of high (U)LIRGs often relied on extrapolation from Spitzer 24 observations (which corresponds to rest-frame 8 at ) or optical/near-infrared color selection (Le Floc’h et al., 2004; Daddi et al., 2004). Selections based on mid-IR emission can bias toward galaxies with a stronger AGN (e.g. Brand et al., 2006), and it is unclear how this may impact the statistics of galaxy morphology such as merger fractions.
To avoid sample selection biases, we compile samples of (U)LIRGs at and that are both selected based on rest-frame 60100 observations. We carry out a comparison of their morphology using both automatic indicators ( coefficient and ) and visual classifications. Since our high sample is observed at rest-frame - and -band, we limit our comparison to those local (U)LIRGs with observations at similar wavelengths. As a test, we take nearby (U)LIRGs and simulate how they would appear at high. This way we can directly test how the surface brightness dimming influences any signature of merging.
The paper is organized as follows: the data and sample selection are described in Section 2 and we construct the redshifted dataset in Section 3. We describe our classification schemes in Section 4 and then examine the distribution of galaxy morphological properties in three bins in Section 5. We discuss the implications of our results in Section 6 and summarize our findings in Section 7. Throughout this paper, we adopt a CDM cosmology with km s-1 Mpc-1, and (Hinshaw et al., 2009). Magnitudes are given in the AB system.
2. Sample and Data for IR-luminous Galaxies
2.1. Sample Selection
Our sample of local (U)LIRGs has been selected from the Great Observatories Allsky LIRGs Survey (GOALS, Armus et al., 2009), and the QDOT all-sky IRAS galaxy redshift survey (Queen Mary and Westfield College, Durham, Oxford and Toronto; Lawrence et al., 1999). Both GOALS and QDOT samples are selected based on IRAS 60 observations. The GOALS sample comprises 203 (U)LIRGs with at , and it is a complete subset of the IRAS Revised Bright Galaxy Sample (RBGS, Sanders et al., 2003), which includes all extragalactic sources with 60 flux density 5.24 Jy. The QDOT sample is selected based on a 60 flux density limit of 0.6 Jy, which provides 95 (U)LIRGs with 222Note that the luminosity listed in Lawrence et al. (1999) is determined using 60 flux. of these QDOT ULIRGs are determined based on the method described in Kim & Sanders (1998). , where the infrared flux [ W m-2]. at .
The sample of (U)LIRGs at is selected based on Herschel Photodetector Array Camera and Spectrometer (PACS; Poglitsch et al., 2010) and the Spectral and Photometric Imaging REceiver (SPIRE; Griffin et al., 2010) observations in the Cosmic Evolution Survey (COSMOS; Scoville et al., 2007). The PACS (100 and 160 ) and SPIRE (250, 350 and 500 ) observations in the COSMOS field are acquired as part of the PACS Evolutionary Probe program (PEP; Lutz et al., 2011) and the Herschel Multi-tiered Extragalactic Survey (HerMES; Oliver et al., 2012), respectively. Detailed descriptions of the source identification, the cross-correlation between multi-wavelength datasets, and the measurement of , dust temperature and dust mass are presented in Lee et al. (2013b), where they identify a sample of 4218 Herschel-selected sources with and log(/) .
These Herschel-selected galaxies, similar to the local IRAS-selected (U)LIRGs, are identified at rest-frame . Such Far-infrared (FIR) selection identifies IR-luminous galaxies at the peak of their SEDs, which is less biased by the emission from AGNs and does not rely on the extrapolation from mid-IR data. Based on the Herschel-selected galaxies identified by Lee et al. (2013b), Hung et al. (2013) have carried out a detailed morphological analysis of 2084 galaxies at using the Advanced Camera for Surveys (ACS) -band ( = 7985Å, = 1877Å) images taken as part of the HST-COSMOS survey (Koekemoer et al., 2007). In this paper, we select a subset of 246 (U)LIRGs at with log(/) (hereafter the high sample, note that this term specifically refers to our Herschel-selected (U)LIRGs at ), where this subset is uniformly distributed in but otherwise randomly selected.
2.2. Optical Images
The processed ACS -band images used for our high sample have the pixel scale of 0.03 ″ pixel-1 and the point spread function (PSF) of 0.1″ (Koekemoer et al., 2007), which correspond to the physical scale of pc pixel-1 and pc at . For the local sample, we use a subset of GOALS galaxies that are covered in the Sloan Digital Sky Survey Data Release 7 (SDSS DR7: Abazajian et al., 2009, hereafter the GOALS-SDSS sample). SDSS images have a complete wavelength coverage in , , , and filters ( = 3595, 4640, 6122, 7439, 8897Å, = 558, 1158, 1111, 1044, 1124Å), and thus we can properly consider K-correction when constructing the redshifted datasets. The pixel scale and the typical PSF of SDSS images are 0.396″ pixel-1 and 1.3″ (Abazajian et al., 2009), which corresponds to the physical scale of pc pixel-1 and pc at , the median redshift of the GOALS-SDSS galaxies. We have restricted the GOALS-SDSS sample to the galaxies that are not saturated in the SDSS images, and those are at which have sufficient spatial resolution for simulating high HST observations. We have also excluded two fields that contain too many stars because of the difficulties in removing the field stars from target galaxies. The final GOALS-SDSS sample contains 59 galaxies with log(/) .
In addition to the GOALS-SDSS sample, we also include 23 (U)LIRGs with log(/) from the QDOT survey that have been observed with the HST Wide-Field Planetary Camera 2 (WFPC2) in the -band ( = 5734Å, = 2178Å) (GO-6356; P.I. M. Rowan-Robinson, Farrah et al., 2001). The WFPC2 -band images have the pixel scale of 0.045″ pixel-1 and the PSF of 0.06″ corresponding to the physical scale of pc pixel-1 and pc at the median redshift of the QDOT sample (). We stress the importance of including these 23 (U)LIRG and the necessity of using the HST -band images due to the following reasons: (1) the QDOT (U)LIRGs provide auxiliary sample covering the highest , (2) the QDOT galaxies are further away compared to the GOALS galaxies, and thus HST images are required to provide comparable resolution to the high observations, (3) our comparison high (U)LIRGs are observed in -band, which corresponds to rest-frame - to -band at , and thus we use the images with shortest possible wavelengths that are available for the local sample. The GOALS-SDSS and QDOT samples together provide 82 (U)LIRGs (hereafter the local sample).
3. Redshifted Local (U)LIRGs
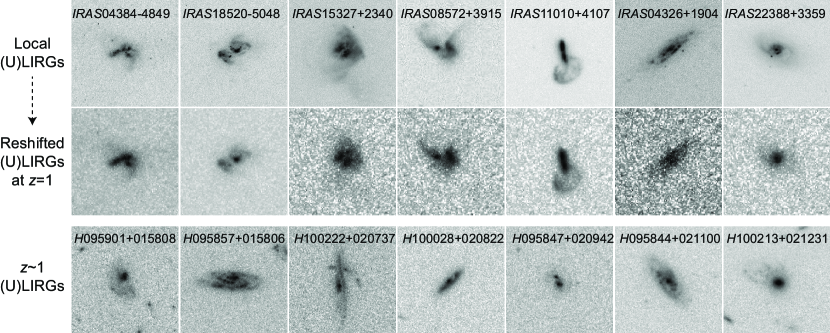
We have constructed a redshifted dataset of local (U)LIRGs that mimics the data quality of our high sample based on the optical images described in Section 2.2 (hereafter the redshifted sample). We begin by making image cutouts centered at the position of each (U)LIRG, where the angular size of each image corresponds to 50 kpc 50 kpc in physical scale. Three galaxies in our local sample are widely separated pairs (with typical separation of pc), and we use the cutout sizes of 80 kpc 80 kpc. We note that these widely separated non-interacting pairs are likely to be classified as isolated galaxies without including redshift information at high. Then we mask out foreground stars and background galaxies in each image, and replace the masked regions by random background area in the same image (hereafter the “cleaned images”). The cleaned images are then artificially redshifted using a redshifting code, FERENGI (Barden et al., 2008).
Here we briefly summarize the redshifting procedure of the GOALS-SDSS sample. The input multi-wavelength cleaned images are first deconvolved using the point spread function (PSF) of SDSS. The redshifiting code then derives the surface brightness distribution of each galaxy according to the redshift and the plate scales of the input and output images. The feasible redshift range of this redshifting experiment is determined by the wavelength coverage of SDSS and the desired output wavelength. Here we assume the redshifted (U)LIRGs are located at , and they are observed in ACS -band with the sensitivity the same as COSMOS ACS images (5 point source limiting magnitude of 27.2). Using the k_correct routine, FERENGI determines the best-fit rest-frame SED template based on the multi-wavelength input images and then calculate the expected flux in the -band. Finally, the output flux distribution is convolved with the PSF of ACS, and a noise frame is added using a blank region extracted from COSMOS HST observations. Since the majority of these GOALS-SDSS galaxies become too faint to study after redshifting, we apply an artificial brightening factor of two magnitudes to ensure that the redshifted dataset has similar apparent magnitude as our high sample.
We apply a slightly different redshifting procedure to the QDOT sample. Since galaxies in the QDOT sample are generally 1-2 magnitude brighter than the GOALS-SDSS sample, we do not apply artificial brightening for the QDOT sample. We also disable the K-correction function in the FERENGI code since only single-filter images are used here. Figure 1 shows a few examples of the redshifted images.
4. Morphology Indicators
Non-parametric statistics (e.g. coefficient and ) and visual classifications are commonly used to classify mergers/non-mergers of (U)LIRGs (e.g. Lotz et al., 2004, 2008b; Dasyra et al., 2008; Melbourne et al., 2008; Kartaltepe et al., 2010). To compare the merger fractions in this study with those derived in the literature, we use both - and visual classification to determine the morphological properties in our local, redshifted, and high sample.
4.1. Gini coefficient and
The Gini coefficient (, Gini, 1912) is defined in order to describe the dispersion of a given distribution, and it was introduced to describe the galaxy light distribution by Abraham et al. (2003). is defined in the range of by
| (1) |
where is the average flux and is defined as the -th lowest flux in a total of pixels. In this definition, galaxies with single or multiple bright nuclei yield higher (typically ) whereas galaxies with smoother light distribution such as face-on spiral galaxies tend to have lower (typically ).
is defined as the second-order moment of the brightest pixels that constitute 20% of the total galaxy light, and then normalized by the second-order moment of the total galaxy light (Lotz et al., 2004, hereafter L04). In its mathematical form,
| (2) |
stands for the second-order moment of the total galaxy light:
| (3) |
where and represents the the center of the galaxy, which is computed by minimizing . Based on the definition, galaxies that show more concentrated light distribution such as elliptical galaxies tend to have smaller (typical ), yet galaxies that show more distributed bright features such as separated nuclei and star-forming clumps tend to have larger (typical ).
We derive and based on a segmentation map that encloses the area for estimating the flux distribution. Different methods for determining the segmentation map have been used in the literature (e.g. Conselice, 2003; Lotz et al., 2004; Abraham et al., 2007). Here we apply a “quasi-Petrosian” method developed by Abraham et al. (2007, also see Larson et al. (2014, in prep.)), which defines the isophotal threshold as
| (4) |
where is the -th step of the cumulative flux array, and is the mean surface brightness in the sorted flux array. This method does not require a circular or elliptical aperture while calculating the isophotal flux such as the methods used in Conselice (2003) and L04, and therefore it provides a better estimate for galaxies with irregular shapes.
When applying a constant isophotal threshold for all galaxies, and are not biased by the source magnitude, cosmological dimming, and the sensitivity of observations. An isophotal threshold of is commonly used for typical local datasets (e.g. Lotz et al., 2004; Cotini et al., 2013), and is also used for some high observations (Abraham et al., 2007; Lotz et al., 2008b; Lee et al., 2013a). However, a point of caution has been raised by Law et al. (2012), who show that using for their high datasets is not satisfactory because the majority of their high galaxies have at a signal-to-noise ratio (SN) of 1.5. In these cases, the segmentation maps are either forced to include many pixels that are purely noise when enforcing a fixed threshold of , or they are indeed only probing when limiting the calculation to SN .
Similar to the findings in Law et al. (2012), we find that only 17% of our high sample has at SN (20% if we limit the sample to those with ). We thus increase the isophotal threshold of our high and redshifted sample to , where 53% of the galaxies have at SN (limiting to those with ). In the automatic calculations, we limit the enclosure of galaxy pixels to SN if the observations are not sensitive to the isophotal threshold. We also limit the calculation to the sources located within 3″ from the image center for the high sample and we do not derive and for those galaxies with 24 due to their faintness.
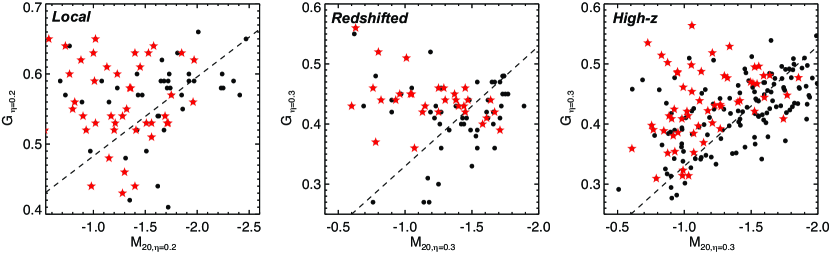
L04 find that local ULIRGs populate a distinctive region in - space compared to normal spiral and elliptical galaxies. Therefore, they can define a merger/non-merger classification scheme based on a galaxy’s location on the - plane. In Figure 10 of L04, the interacting galaxies are classified based on the criteria . Lotz et al. (2008b, hereafter L08) further define a similar classification scheme ( for interacting galaxies) for galaxies at higher redshift (). In this paper, we adopt the merger/non-merger classification criteria of L04 for our local sample, and we use the criteria in L08 for the redshifted and high samples. Since these criteria are derived using , we have to convert the equation in L08 to one that is applicable for the calculation based on . We apply a similar approach as Law et al. (2012). The majority of our local sample can achieve at SN , and thus we calculate and of our local sample using both and and fit the best conversions of and calculated using two thresholds:
| (5) |
| (6) |
Although the segmentation maps used in L04 and L08 are determined based on Petrosian radius with an elliptical aperture, which is different from the quasi-Petrosian method used in our work, the differences in the derived and are small (Law et al., 2012) and thus we do not apply another conversion.
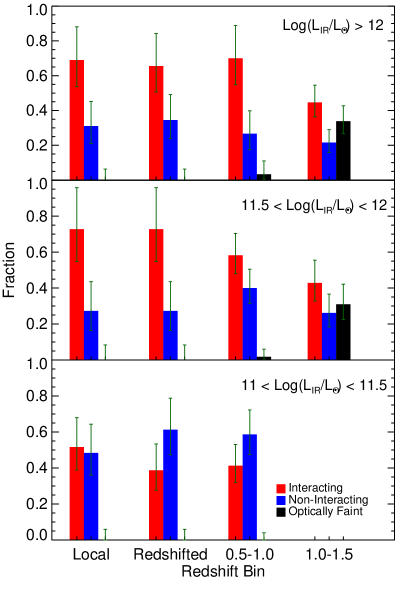
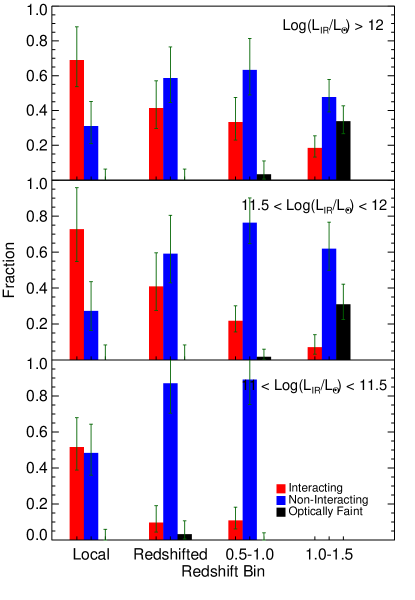
Using the classification criteria described above, we show the fraction of interacting galaxies, non-interacting galaxies, and optically faint () galaxies in our local, redshifted, and high sample in Figure 3 and 6. We note that Figure 6 shows the results based on and , and this is for a direct comparison with the results in L08 (see the discussion in Section 6.1).
4.2. Visual Classification
We adopt the visual classification scheme used in Hung et al. (2013), which is a modified version of the method developed by Kartaltepe et al. (2014) (also see Kartaltepe et al., 2012; Kocevski et al., 2012). A detailed description of this visual classification scheme and examples are presented in Section 3.2 and Figure 2 in Hung et al. (2013).
We enlisted eight classifiers (hereafter the Team) to independently classify all galaxies. The classifiers assign the morphology class and interaction class of each galaxy. The morphology class includes disk, spheroid, irregular and unclassifiable. Unless deemed “unclassifiable”, galaxies can be given multiple morphology classes, such as an irregular disk or a spheroid with irregular features. The interaction class includes merger, interacting pair (major or minor), non-interacting pair (major or minor) or non-interacting galaxy. The classifiers assign only one interaction class to each galaxy unless it is noted as unclassifiable.
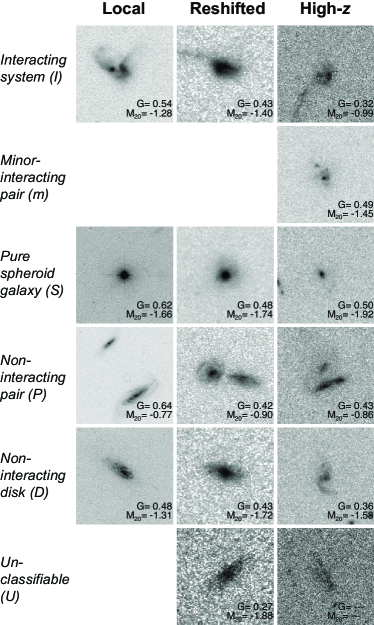
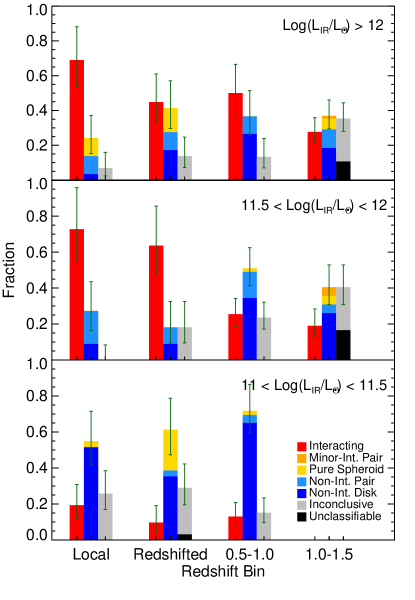
To simplify these classification results yet retain the information related to the interacting features and other non-interacting galaxy types, we re-categorize the morphology and interaction classes into six types: interacting system (I), minor-interacting pair (m), pure spheroid galaxy (S), non-interacting pair (P), non-interacting disk galaxy (D), and unclassifiable galaxy (U). We then combine the classification results from the Team by majority vote. For each galaxy, we assign it as one of the six types if equal or more than half of the classifiers agree, whereas we assign the type as “inconclusive (C)” if no conclusions can be reached among the Team (none of the six types exceed 50% of votes or two types each has 50% vote) Figure 2 shows examples of six morphology types in three datasets: local, redshifted, and high (U)LIRGs. Figure 4 shows the fraction of these morphology types in the three samples.
5. Results
5.1. Rest-frame optical morphology of local, redshifted, and high (U)LIRGs
In this section, we examine the distribution of morphology types for local, redshifted, and high (U)LIRGs using both - and visual classifications. We divide the high sample into two redshift bins: and , in which the ACS -band images correspond to rest-frame - and -band in these two redshift bins. The distribution of morphology types is shown in three luminosity bins: Log(/), Log(/), and Log(/) (Figures 3 and 4). The error bars in these figures are determined assuming a Poisson distribution. Typically, each luminosity and redshift bin contains at least 20-30 galaxies.
Figure 3 shows the classification results based on -. The fractions of interacting and non-interacting systems are consistent between the local and redshifted datasets in the two higher bins, and differ by in the lowest bin. In fact, 77% of the local (U)LIRGs retain their morphology classifications after redshifting. The - classifications for the local (U)LIRGs derived with are highly consistent with those of the redshifted counterparts derived with because we define the conversions between and based on our local sample. On average, only % fewer galaxies are classified as interacting systems in the redshifted sample compared to the local sample. The overall merger fraction in the (U)LIRGs is lower than the local sample, which is consistent with what might be expected due to redshifting (i.e. a combination effect from surface brightness dimming and degrading the spatial resolution). The small difference in the merger fraction is consistent with an absence of strong evolution in morphological properties of (U)LIRGs out to . In the higher redshift bin (), the merger fraction decreases by in the two highest luminosity bins compared to the local sample. However, the merger fraction at is highly uncertain due to the growing population of optically faint galaxies. About 30% of (U)LIRGs in the bin are too faint to measure and reliably and thus their morphology types can not be determined.
The distribution of different morphology types based on visual classifications is shown in Figure 4. The decrease of interacting systems in the redshifted dataset is more prominent compared to the results based on - classification. A significant population (on average, ) of local (U)LIRGs lose their interacting features and they are “misclassified” as other morphology types when artificially redshifted to using the data quality of the COSMOS ACS observations. Similar to our conclusions based on - classification, at least part of the differences of merger fraction between local and (U)LIRGs can be explained as a redshifting effect. The remaining difference of interaction fraction is 17%, which is consistent with the increasing population of galaxies with inconclusive morphology type. The fraction of non-interacting disks and pairs, on the other hand, remains the same in the local and bins. In the bin, galaxies with inconclusive morphology types and unclassifiable galaxies dominate the entire sample.
5.2. Comparison between - and visual classification
We compare the classification results based on - and visual classification in Table 1, and the distributions of , overlaid with the visual interacting systems are shown in Figure 5. The outcomes of visual classification are divided into seven possibilities (I: Interacting system, m: minor-interacting pair, S: pure spheroid, P: non-interacting pair, D: non-interacting disk, U: unclassifiable, C: inconclusive), and the outcomes of - are divided into three possibilities (interacting, non-interacting, and optically faint galaxy). The cells with bold text indicate the cases where - and visual classifications are consistent, and we exclude the visually inconclusive cases (numbers with brackets) when calculating the level of consistency between - and visual classifications. We note that although the visually non-interacting pairs lack of obvious interacting features, they are likely to be classified as interacting systems using - due to the presence of multiple nuclei. Here we consider this case as the two classification results being consistent, and discuss other sources where - and visual classifications are inconsistent.
After removing the inconclusive galaxies in visual classifications, we find that the levels of consistency are 68, 74, and 61% in the local, redshifted, and high datasets, respectively. Based on the local sample, we identify two major sources where the results based on - and visual classifications are inconsistent. The galaxies with disturbed morphology that still have a relatively smooth light distribution (e.g. mergers in the interaction class) often have low value and tend to be classified as non-interacting systems using -. On the other hand, edge-on disks that also have concentrated light distribution may be mistaken as interacting systems in - due to their relatively high value. The high dataset shows a slightly lower level of consistency compared to the local and redshifted datasets, which is due to different definitions of galaxy pairs between - and visual classifications (with and without a fixed radius).
About of the local sample do not have conclusive morphology type based on visual classifications, and this fraction increases by a factor of 1.6 in the redshifted and high samples ( and ). About half of these visually inconclusive galaxies are classified as interacting when using - classification, and the other half are classified as either non-interacting or optically faint. The majority of the inconclusive cases are due to the identification of obvious interacting features, and about 10% of the inconclusive cases in the high sample are due to the faintness of galaxies (i.e. if galaxies are classifiable).
Local (U)LIRGs
I
m
S
P
D
U
C
Interacting
29
0
3
7
7
0
(6)
Non-Interacting
13
0
1
0
12
0
(4)
Optically Faint
0
0
0
0
0
0
(0)
Total number of galaxies = 82 (72 without “inconclusive (C)”)
Level of consistency = 68%
Reshifted (U)LIRGs
I
m
S
P
D
U
C
Interacting
24
0
6
6
4
0
(7)
Non-Interacting
6
0
5
0
14
1
(9)
Optically Faint
0
0
0
0
0
0
(0)
Total number of galaxies = 82 (66 without “inconclusive (C)”)
Level of consistency = 74%
high (U)LIRGs
I
m
S
P
D
U
C
Interacting
49
3
2
10
29
2
(26)
Non-Interacting
8
0
4
7
47
2
(15)
Optically Faint
5
0
2
6
6
13
(10)
Total number of galaxies = 246 (195 without “inconclusive (C)”)
Level of consistency = 61%
Table 1.— Comparison tables between visual classification and the - classification results of local, redshifted, and high datasets, including seven possible visual classification outcomes (I: interacting, m: minor-interacting, S: pure spheroid, P: non-interacting pair, D: non-interacting disk, U: unclassifiable, C: inconclusive) and three possible outcomes of -M20 classification. The tables list the number of galaxies in each cell as belonging to the certain category classified visually and using automatic indicators. For illustration, numbers in boldface indicate those categories where the two classification schemes are consistent, whereas normal text indicates where the two schemes are inconsistent. The visually inconclusive cases (marked as numbers in brackets) are not included when calculating the level of consistency between the two classification schemes.
6. Discussion
Based on the comparison of merger fractions between local and (U)LIRGs determined using their rest-frame optical morphology, we can begin to study how the relative importance of galaxy interactions in the luminous infrared galaxies evolves with redshift. In this section, we compare our results with previous morphological studies, and then we discuss the implications of our results.
6.1. Comparing merger fractions to other studies in the literature
Extensive studies based on optical morphological properties have demonstrated that merger fractions systematically increase with , and this trend is seen from the local universe out to (e.g. Ishida, 2004; Kartaltepe et al., 2010; Hung et al., 2013). We observe similar increasing trends with in our local and high (U)LIRGs using both - and visual classification methods (Figure 3 and 4). The increasing trend based on - is less prominent compared to visual classifications, which is likely due to the higher fraction of non-disturbed edge-on disks in the lowest luminosity bin (as discussed in section 5.2), and the fact that - is only sensitive to interacting galaxies at certain merger stages (e.g. after the first passage and later stages, Lotz et al., 2008a).
In spite of the agreement in the general trend with , some discrepancies are seen in the measured merger fractions in this study and the literature, especially for the local ULIRGs. A slightly lower merger fraction is measured using - compared to the number in Lotz et al. (2004) (70% v.s. 75%), yet this difference may not be significant considering the typical uncertainties based on the sample size ().
Local ULIRGs are almost universally () classified as mergers based on visual classifications (e.g. Sanders & Mirabel, 1996; Farrah et al., 2001; Veilleux et al., 2002; Ishida, 2004), however, only of local ULIRGs are classified as interacting systems based on our visual classification results, which is 20-30% lower than values in the literature. One reason for this discrepancy is the definition of the visual classification scheme. In the classification scheme used in this paper, the detection of obvious interacting features is required for galaxies to be classified as interacting systems, and we have not incorporated available spectroscopic information to identify interacting galaxies without obvious disturbed morphology. However, the process of “downgrading” the available information for the local dataset is essential to carry out a fair comparison with the high dataset. Another reason for the discrepancy is due to the use of optical images at shorter rest-frame wavelengths. For example, two ULIRGs with inconclusive morphology types are identified as interacting systems when we reclassify the morphology types using -band images.
The merger fractions in high (U)LIRGs based on visual classifications are consistent with previous studies at using similar sample selection and classification scheme (e.g. Kartaltepe et al., 2010; Hung et al., 2013). Both Kartaltepe et al. (2010) and Hung et al. (2013) also identify a large population of galaxies with unknown morphology types at . In fact, the merger fraction in our LIRGs is also consistent with morphological studies based on 24 -selected LIRGs at a similar redshift range (30% at and , Bell et al., 2005; Melbourne et al., 2005), although a lower merger fraction is also reported in some cases ( at , Melbourne et al., 2008).
The merger fraction of our LIRGs determined using - is significantly higher compared to Lotz et al. (2008b), where they only identify of LIRGs at as mergers. The main reason for this discrepancy is due to the derivation of and . In Figure 6, we show that the merger fraction decreases significantly in high (U)LIRGs based on and with the merger classification criteria in L08 (). However, the merger fraction also decreases significantly in the redshifted dataset, which suggests a larger correction factor due to the redshifting effect is needed when comparing local and high datasets.
6.2. Evolution of (U)LIRGs from local to
By comparing morphological studies of infrared luminous galaxies from local to higher redshifts, a general trend is seen such that the merger fraction of (U)LIRGs is significantly lower compared to their local counterparts (by , Ishida, 2004; Dasyra et al., 2008; Kartaltepe et al., 2010). However, we demonstrate that the difference in merger fraction between local and (U)LIRGs may be overestimated because (1) a lower merger fraction in local (U)LIRGs is measured when applying the same classification scheme as other studies of galaxies, and (2) the differences between local and (U)LIRGs can be partly explained as a redshifting effect. In fact, based on our visual classification results, the merger fraction of (U)LIRGs at is only 17% lower than local (U)LIRGs when properly accounting for (1) and (2).
A number of theoretical and empirical approaches have been proposed to explain and predict the decreasing merger fraction for (U)LIRGs. For example, Hopkins et al. (2010) suggest that due to enhanced gas fractions in galaxies, the luminosity threshold between normal star formation and merger-driven starburst can increase by an order of magnitude from to . Sargent et al. (2012) show a similar increase of that luminosity threshold based on an empirical approach that assumes an increasing specific star formation rate (sSFR=SFR/) with redshift and a double-Gaussian decomposition of the sSFR distribution at fixed stellar mass (Rodighiero et al., 2011).
The general trends of increasing merger fraction with and decreasing merger fraction with redshift found in this study are consistent with the prediction in Sargent et al. (2012). However, when taking a subset of our sample at , our measured merger fraction is much higher compared to their predicted contribution of starbursts at (e.g. 31% v.s. 14% at log(/)11.7). The difference may be even larger when considering the correction factor due to the redshifting effect. At a slightly lower redshift slice (), Bell et al. (2005, Figure 3) also show that interacting galaxies contribute of the luminosity function at log(/)11.7.
The discrepancy between the measured merger fractions and the predicted starburst contributions at may be due to several reasons. Firstly, this comparison assumes that the morphologically identified mergers are all starburst galaxies, which may not be valid when SFRs are only enhanced during a certain period of the interaction sequence (e.g. Mihos & Hernquist, 1996). Secondly, using asymmetry (, Conselice, 2003), Lotz et al. (2010) find that the merger observability timescale increases by a factor of two for an increase in gas fraction from 19% to 39%. This implies that more mergers may be observed at . However, this conclusion may be highly sensitive to the merger classification scheme as Lotz et al. (2010) also point out that such trend does not exist when using -.
7. Conclusions
We have carried out a comparison of optical morphological properties between local (U)LIRGs and (U)LIRGs at . Both our local and high samples are selected based on rest-frame 60-100 observations, and the same classification scheme is adopted using optical images at similar rest-frame wavelengths. In parallel, we investigate possible systematic biases when comparing two different datasets by constructing a redshifted dataset using local (U)LIRGs, in which the redshifted dataset has the same image resolution/sensitivity as the COSMOS HST-ACS observations of our high sample.
Our determination of the distribution of merger fractions in our local, redshifted, and samples leads to the following conclusions:
-
1.
Using a modified - classification scheme, no significant difference is seen in the fraction of interacting systems between local, redshifted, and (U)LIRGs at (, , and , respectively).
-
2.
Since we adopt a “conservative” visual classification scheme where the detection of obvious interacting features is required for galaxies to be classified as interacting systems, the merger fraction of local ULIRGs measured in this study is only 70%, which is 20-30% lower compared to the numbers reported in the literature.
-
3.
We quantify the reduction in merger fraction that is purely due to a redshifting effect (i.e. poorer data quality at high), which is less obvious using - () but more prominent using visual classification ().
-
4.
Based on the conclusion bullet points 2 and 3, we conclude that the merger fraction of (U)LIRGs decreases by at most 20% from to . However, 30% of galaxies at becomes too faint for reliable classifications, and thus the merger fractions at suffer from large uncertainties.
References
- Abazajian et al. (2009) Abazajian, K. N., Adelman-McCarthy, J. K., Agüeros, M. A., et al. 2009, ApJS, 182, 543
- Abraham et al. (2003) Abraham, R. G., van den Bergh, S., & Nair, P. 2003, ApJ, 588, 218
- Abraham et al. (2007) Abraham, R. G., Nair, P., McCarthy, P. J., et al. 2007, ApJ, 669, 184
- Armus et al. (2009) Armus, L., Mazzarella, J. M., Evans, A. S., et al. 2009, PASP, 121, 559
- Barden et al. (2008) Barden, M., Jahnke, K., & Häußler, B. 2008, ApJS, 175, 105
- Barnes & Hernquist (1996) Barnes, J. E., & Hernquist, L. 1996, ApJ, 471, 115
- Bell et al. (2005) Bell, E. F., Papovich, C., Wolf, C., et al. 2005, ApJ, 625, 23
- Brand et al. (2006) Brand, K., Dey, A., Weedman, D., et al. 2006, ApJ, 644, 143
- Cameron et al. (2011) Cameron, E., Carollo, C. M., Oesch, P. A., et al. 2011, ApJ, 743, 146
- Casey et al. (2012) Casey, C. M., Berta, S., Béthermin, M., et al. 2012, ApJ, 761, 140
- Colina et al. (2005) Colina, L., Arribas, S., & Monreal-Ibero, A. 2005, ApJ, 621, 725
- Conselice (2003) Conselice, C. J. 2003, ApJS, 147, 1
- Cotini et al. (2013) Cotini, S., Ripamonti, E., Caccianiga, A., et al. 2013, MNRAS, 431, 2661
- Daddi et al. (2004) Daddi, E., Cimatti, A., Renzini, A., et al. 2004, ApJ, 617, 746
- Dasyra et al. (2008) Dasyra, K. M., Yan, L., Helou, G., et al. 2008, ApJ, 680, 232
- Ellison et al. (2013) Ellison, S. L., Mendel, J. T., Scudder, J. M., Patton, D. R., & Palmer, M. J. D. 2013, MNRAS, 430, 3128
- Farrah et al. (2001) Farrah, D., Rowan-Robinson, M., Oliver, S., et al. 2001, MNRAS, 326, 1333
- Gini (1912) Gini, C. 1912, Memorie di Metodologia Statistica, ed. E. Pizetti & T. Salvemini (reprinted in 1955; Rome: Libreria Eredi Virgilio Veschi)
- Griffin et al. (2010) Griffin, M. J., Abergel, A., Abreu, A., et al. 2010, A&A, 518, L3
- Haan et al. (2011) Haan, S., Surace, J. A., Armus, L., et al. 2011, AJ, 141, 100
- Hibbard & Vacca (1997) Hibbard, J. E., & Vacca, W. D. 1997, AJ, 114, 1741
- Hinshaw et al. (2009) Hinshaw, G., Weiland, J. L., Hill, R. S., et al. 2009, ApJS, 180, 225
- Hopkins et al. (2010) Hopkins, P. F., Younger, J. D., Hayward, C. C., Narayanan, D., & Hernquist, L. 2010, MNRAS, 402, 1693
- Hung et al. (2013) Hung, C.-L., Sanders, D. B., Casey, C. M., et al. 2013, ApJ, 778, 129
- Ishida (2004) Ishida, C. M. 2004, PhD thesis, University of Hawai’i
- Kartaltepe et al. (2010) Kartaltepe, J. S., Sanders, D. B., Le Floc’h, E., et al. 2010, ApJ, 721, 98
- Kartaltepe et al. (2012) Kartaltepe, J. S., Dickinson, M., Alexander, D. M., et al. 2012, ApJ, 757, 23
- Kartaltepe et al. (2014) Kartaltepe, J. S., Mozena, M., Kocevski, D., et al. 2014, ArXiv e-prints, arXiv:1401.2455
- Kim & Sanders (1998) Kim, D.-C., & Sanders, D. B. 1998, ApJS, 119, 41
- Kocevski et al. (2012) Kocevski, D. D., Faber, S. M., Mozena, M., et al. 2012, ApJ, 744, 148
- Koekemoer et al. (2007) Koekemoer, A. M., Aussel, H., Calzetti, D., et al. 2007, ApJS, 172, 196
- Law et al. (2012) Law, D. R., Steidel, C. C., Shapley, A. E., et al. 2012, ApJ, 745, 85
- Lawrence et al. (1999) Lawrence, A., Rowan-Robinson, M., Ellis, R. S., et al. 1999, MNRAS, 308, 897
- Le Floc’h et al. (2004) Le Floc’h, E., Pérez-González, P. G., Rieke, G. H., et al. 2004, ApJS, 154, 170
- Le Floc’h et al. (2005) Le Floc’h, E., Papovich, C., Dole, H., et al. 2005, ApJ, 632, 169
- Lee et al. (2013a) Lee, B., Giavalisco, M., Williams, C. C., et al. 2013a, ApJ, 774, 47
- Lee et al. (2013b) Lee, N., Sanders, D. B., Casey, C. M., et al. 2013b, ApJ, 778, 131
- Lotz et al. (2008a) Lotz, J. M., Jonsson, P., Cox, T. J., & Primack, J. R. 2008a, MNRAS, 391, 1137
- Lotz et al. (2010) —. 2010, MNRAS, 404, 590
- Lotz et al. (2004) Lotz, J. M., Primack, J., & Madau, P. 2004, AJ, 128, 163
- Lotz et al. (2008b) Lotz, J. M., Davis, M., Faber, S. M., et al. 2008b, ApJ, 672, 177
- Lutz et al. (2011) Lutz, D., Poglitsch, A., Altieri, B., et al. 2011, A&A, 532, A90
- Melbourne et al. (2005) Melbourne, J., Koo, D. C., & Le Floc’h, E. 2005, ApJ, 632, L65
- Melbourne et al. (2008) Melbourne, J., Ammons, M., Wright, S. A., et al. 2008, AJ, 135, 1207
- Mihos & Bothun (1998) Mihos, J. C., & Bothun, G. D. 1998, ApJ, 500, 619
- Mihos & Hernquist (1996) Mihos, J. C., & Hernquist, L. 1996, ApJ, 464, 641
- Oliver et al. (2012) Oliver, S. J., Bock, J., Altieri, B., et al. 2012, MNRAS, 424, 1614
- Petty et al. (2009) Petty, S. M., de Mello, D. F., Gallagher, III, J. S., et al. 2009, AJ, 138, 362
- Pilbratt et al. (2010) Pilbratt, G. L., Riedinger, J. R., Passvogel, T., et al. 2010, A&A, 518, L1
- Poglitsch et al. (2010) Poglitsch, A., Waelkens, C., Geis, N., et al. 2010, A&A, 518, L2
- Rodighiero et al. (2011) Rodighiero, G., Daddi, E., Baronchelli, I., et al. 2011, ApJ, 739, L40
- Sanders et al. (2003) Sanders, D. B., Mazzarella, J. M., Kim, D.-C., Surace, J. A., & Soifer, B. T. 2003, AJ, 126, 1607
- Sanders & Mirabel (1996) Sanders, D. B., & Mirabel, I. F. 1996, ARA&A, 34, 749
- Sanders et al. (1988) Sanders, D. B., Soifer, B. T., Elias, J. H., et al. 1988, ApJ, 325, 74
- Sargent et al. (2012) Sargent, M. T., Béthermin, M., Daddi, E., & Elbaz, D. 2012, ApJ, 747, L31
- Scoville et al. (2007) Scoville, N., Aussel, H., Brusa, M., et al. 2007, ApJS, 172, 1
- Surace et al. (1998) Surace, J. A., Sanders, D. B., Vacca, W. D., Veilleux, S., & Mazzarella, J. M. 1998, ApJ, 492, 116
- Tacconi et al. (2008) Tacconi, L. J., Genzel, R., Smail, I., et al. 2008, ApJ, 680, 246
- Tacconi et al. (2010) Tacconi, L. J., Genzel, R., Neri, R., et al. 2010, Nature, 463, 781
- Veilleux et al. (2002) Veilleux, S., Kim, D.-C., & Sanders, D. B. 2002, ApJS, 143, 315