CO(1–0) line imaging of massive star-forming disk galaxies at
Abstract
We present detections of the CO( 1–0) emission line in a sample of four massive star-forming galaxies at obtained with the Karl G. Jansky Very Large Array (VLA). Combining these observations with previous CO(2–1) and CO(3–2) detections of these galaxies, we study the excitation properties of the molecular gas in our sample sources. We find an average line brightness temperature ratios of and , based on measurements for three and two galaxies, respectively. These results provide additional support to previous indications of sub-thermal gas excitation for the CO(3–2) line with a typically assumed line ratio . For one of our targets, BzK-21000, we present spatially resolved CO line maps. At the resolution of (1.5 kpc), most of the emission is resolved out except for some clumpy structure. From this, we attempt to identify molecular gas clumps in the data cube, finding 4 possible candidates. We estimate that of the molecular gas is confined to giant clumps ( kpc in size), and thus most of the gas could be distributed in small fainter clouds or in fairly diffuse extended regions of lower brightness temperatures than our sensitivity limit.
keywords:
galaxies: ISM – galaxies: high-redshift – galaxies: evolution1 Introduction
The physical processes behind gas supply, and subsequent star formation, in early galaxies, remain key uncertainties in our understanding of galaxy formation. Study of the demographics and gas depletion timescales show that most star forming galaxies at form a tight correlation between their star formation rates (SFR) and stellar masses. Such correlation, usually termed as the ‘main-sequence’ of galaxies, suggests that the star formation is typically a long-lived process, likely occurring over timescales of Gyr (e.g., Daddi et al., 2005, 2007). Major gas rich mergers, typically lying above such main-sequence, are unlikely to be the primary driving mechanism for such continuous star formation, since they would lead to short timescale, nuclear starbursts as it is seen in local Ultra Luminous IR Galaxies (ULIRGs; e.g., Solomon et al., 1997; Downes & Solomon, 1998).
Two of the major challenges for understanding the mechanisms of gas accretion and stellar build up in these galaxies is to spatially and kinematically resolve the star formation and molecular gas components down to kpc scales (Shapiro et al., 2008), as well as targeting several molecular gas emission lines in order to characterize the physical state of the interstellar medium (ISM; Carilli & Walter, 2013). High-resolution observations of the ionized gas (H) kinematics and the stellar component have shown that a majority of these galaxies are consistent with clumpy rotating disks with sizes of order 10 kpc (Genzel et al., 2006, 2008; Förster Schreiber et al., 2009, 2011). However, these observations do not directly trace the cold molecular gas from which stars are formed, and could be prone to obscuration within the host galaxy. Direct high resolution observations of the molecular gas are thus necessary.
| Source | a | a | Array b | c | Beam d | P.A. d | rms e | Chan f |
|---|---|---|---|---|---|---|---|---|
| (J2000) | (J2000) | (GHz) | (deg) | (Jy) | (km s-1) | |||
| BzK-21000 | B/D | 45.656 | 91 | 50 | ||||
| BzK-4171 | D | 46.765 | 220 | 80 | ||||
| BzK-16000 | C/D | 45.708 | 130 | 80 | ||||
| BX610 | D | 35.905 | 180 | 80 |
Notes: a Right ascension and declination of the measured CO(1–0) positions; b VLA array configuration used in the observations; c Observed frequency; dSynthesized beam size (major and minor axis) and position angle (P.A.); e Average noise level reached in the data cube at a velocity resolution per channel given in f.
Recently, observations of the molecular gas, through CO line emission, in optical/IR color-selected star-forming galaxies at have revealed significant molecular gas reservoirs, comparable to their stellar component ( M⊙) in systems which typically show SFRs in the range M⊙ yr-1 (Daddi et al., 2008, 2010a; Tacconi et al., 2010, 2013). This indicated that these galaxies have low star formation efficiencies and long gas depletion timescales, compared to that seen in extreme starbursting submillimeter galaxies (SMGs) and quasars, and suggest their integrated properties may follow a different star-formation law (Daddi et al., 2010b; Genzel et al., 2010). Furthermore, their implied CO luminosity to gas mass conversion factors resemble local disk galaxies (Daddi et al., 2010a; Magdis et al., 2011, 2012; Magnelli et al., 2012).
These studies, however, focused on the observation of CO line emission. One of the major assumptions encountered when observing CO lines in main-sequence galaxies has been the the adoption of an “average” constant ratio between the CO line and CO(1–0). Determination of these ratios are required in order to convert the high-J CO line luminosities into CO(1–0) luminosities, for which the conversion factors of CO luminosity to gas mass have been calibrated (Bolatto et al., 2013). Thus, observations of the CO(1–0) line in statistical samples of star-forming galaxies at are necessary for calibrating such line ratios.
As Bauermeister et al. point out, calibration of the line ratios is particularly important for the CO(3–2) line for two main reasons: (1) this line ( GHz) is shifted to the 2mm and 3mm atmospheric windows at , being directly accessible with the most powerful (sub)millimeter facilities that can easily access these kind of galaxies, namely the Atacama Large Millimeter/submillimeter Array (ALMA) and the Plateau de Bureau Interferometer (PdBI). Hence, observations of the CO(3–2) line will (and have) become routine and constitute the first direct attempt to characterize the molecular gas properties of these objects (e.g., Tacconi et al., 2010, 2013); (2) The cosmic time spanned by redshifts , 6 Gyr, corresponds to the important period when most of the stars in the Universe where created and where most of the galaxies were assembled.
To date, only a few main-sequence galaxies at cosmological distances () have observations in two or more CO lines (Dannerbauer et al., 2009; Aravena et al., 2010; Bauermeister et al., 2013), and generally only a handful of these main-sequence galaxies have spatially resolved CO observations down to kpc scales (Tacconi et al., 2013; Genzel et al., 2013). Follow-up CO(1–0) observations of three representative galaxies in the CO(1–0) line emission suggest that the molecular gas in these systems is already sub-thermally excited at the CO(3–2) transition similar to what is found in local disks (Dannerbauer et al., 2009; Aravena et al., 2010), with typical line brightness temperature ratios between both lines of . This is also similar to what is found in SMGs (Harris et al., 2010; Ivison et al., 2011; Bothwell et al., 2013), but substantially different to high-redshift QSOs, which appear to have highly excited gas with line temperature ratios close to unity (Riechers et al., 2006; Weiß et al., 2007; Ao et al., 2008; Riechers et al., 2011a; Ivison et al., 2012, e.g.,). Recent observations of disk galaxies support these findings, indicating that the molecular gas content, as traced by CO(1–0), is two times larger than expected from CO measurements, comparable to SMGs (Papadopoulos & Ivison, 2002; Harris et al., 2010; Ivison et al., 2011; Riechers et al., 2011c).
In this paper, we present observations of the CO(1-0) emission line in four main-sequence star forming galaxies at obtained with the Karl G. Jansky Very Large Array (VLA). The angular resolution of our observations for one of these sources, , allows us to spatially resolve the distribution of the molecular gas. The new correlator system at the VLA permits us to expand the bandwidth and velocity resolution of the previous CO(1–0) detections in three of our targets, and to detect the CO emission in a new object at . We adopt a standard CDM cosmology throughout (Komatsu et al., 2011).
2 Observations
2.1 BzK-21000
Observations of the 12CO(=1–0) emission line ( GHz) of this galaxy were made simultaneously while observing the CO(2–1) emission line in the bright SMG, GN20 (VLA project: AC974). Description of these observations are presented in detail in Hodge et al. (2012). In summary, observations were carried out in D and B array configuration during 2010 March-April (D-configuration) and 2011 February-April (B-configuration). At the redshift of BzK-21000, (Daddi et al., 2010a), the CO(1–0) line is shifted to 45.7184 GHz. The WIDAR correlator was configured with two spectral windows (SPWs) of 64 channels and 2 MHz per channel resolution. The SPWs were centered at 45.592 and 45.720 GHz for a total bandwidth of 246 MHz. The difference in total bandwidth with respect to MHz was due to overlapping channels, with the goal to improve the bandpass through the rejection of edge channels. The tuning offset with respect to the CO(1–0) sky frequency for BzK-21000 was chosen to cover the CO lines for 4 galaxies with the same narrow bandpass (for details see Hodge et al., 2012, 2013). Similarly, the pointing center was selected to cover all 4 galaxies, such that the flux scaling multiplicative factor needed for primary beam correction at the location of BzK-21000 was 1.33.
The nearby quasar J1302+5748 was used for gain and pointing calibration and the source J1331+3030 (3C286) served as flux and bandpass calibrator. The data was calibrated using the Astronomical Image Processing System (AIPS; Greisen, 2003) and the Common Astronomy Software Application (CASA) package (McMullin et al., 2007). Time ranges with poor visibilities as well as edge channels where the bandpass deteriorated (at each edge) were flagged. The data was imaged using the CLEAN algorithm in CASA. All images were accordingly primary beam corrected. We used a briggs weighting scheme, cleaning down to in a tight box ( in size) around our target and setting the robust parameter equals to 0.8. We tried with other weighting schemes, however, we found that most of the emission was lost when using lower values for the robust parameter. Similarly, the images were dominated by large scale structures when using robust or natural weighting. These structures were due to the combination of data of two difference configurations. Our selection is thus a compromise between obtaining good image quality without losing spatial information. A summary of the observations is presented in Table 1.
2.2 BzK-16000 and BzK-4171
| Source | a | b | c | d | e | SFR f | SFE g | h | h |
|---|---|---|---|---|---|---|---|---|---|
| (km s-1) | (Jy km s-1) | () | () | (M⊙ yr-1) | () | ||||
| BzK-21000 | 1.5204 (3) | 88 | |||||||
| BzK-4171 | 1.464 (3) | 38 | – | ||||||
| BzK-16000 | 1.524 (2) | 30 | – | ||||||
| BX610 | 2.2105 (3) | 50 | – |
Notes: a CO(1–0) redshift. The parenthesis corresponds to the uncertainty associated to the last digit in this measurement; b Measured CO line full-width at half maximum (FWHM); c Spatially and velocity integrated CO line flux ; d CO luminosity in units K km s-1 pc2; e Gas mass obtained using (K km s-1 pc, in units ; f Star formation rates (SFRs) derived from Herschel IR observations (Magdis et al., 2012), and UV/24m measurements for BX610 (Tacconi et al., 2013). The associated uncertainties amount to 30%. We assume a conversion SFR and a Chabrier (2003) Initial Mass function. g Star formation efficiency derived from the CO(1–0) observations, defined as SFE in units of (K km s-1 pc; h Observed brightness temperature line ratios between the CO(3–2) and CO(2–1) with respect to the CO(1–0) line, where and similarly for .
CO(1–0) observations of BzK-4171 and BzK-16000 were obtained in the D, and D plus C array configurations, respectively. D-array observations of both sources were performed during 2010 March and 2010 April (VLA project: AC975). C-array observations of BzK-16000 were done during 2012 April (VLA project 12A-264). At the redshifts and (Daddi et al., 2010a), the CO(1–0) line is shifted to 46.7594 GHz and 45.6537 GHz for BzK-4171 and BzK-16000, respectively.
The calibrators and correlator configuration used for the D-array data were the same as those used to observe BzK-21000. For the BzK-4171, the SPWs were centered at 46.740 and 46.822 GHz, while for BzK-16000, these were centered at 45.647 and 45.765 GHz, for a total bandwidth of 228 MHz. Similarly to the case of BzK-21000, the difference in bandwidth with respect to the nominal 256 MHz is due to overlapping channels to improve the bandpass. For the C-array data, the observations were performed with the WIDAR correlator but using its expanded capabilities. In this case, two basebands (AC and BD) of 8 contiguous SPWs each were used. Baseband AC covered the SPWs 0-7 while baseband BD covered SPWs 8-15. Each SPW was set to have 64 channels and 2 MHz per channel resolution. Both basebands were configured to overlap, with an offset of 44 channels with respect to each other and making an effective bandwidth of GHz. With this setup, the SPWs 5 and 12 covered the redshifted CO(1–0) line from BzK-16000. Hereafter, we focus on the data obtained in these SPWs. Both D- and C-array visibility datasets were concatenated and imaged accordingly. Data calibration and flagging were done with AIPS, and imaging was performed using CASA. After trying several weighting schemes, we chose Briggs weighting with a robust parameter of . This approach minimized negative noise peaks in the image when averaging channels across the CO line, while retaining good sensitivity. In the case of BzK-4171, we applied a further taper of to increase the sensitivity toward extended sources (although the actual rms of the map is higher). We used a box around the source of in size, cleaning down to . The obtained sensitivities and beam sizes are summarized in Table 1.
2.3 BX610
Observations of the CO(1–0) emission line in BX610 were performed from October 2011 to November 2011 in D-array configuration (VLA project: 11B-112), and pointed to the optical position listed in Erb et al. (2006). These observations were performed with the correlator configured in a similar fashion as the BzK-16000 C-array observations. We used two basebands formed by 8 SPWs each, and the SPWs set with 64 channels and 2 MHz per channel resolution. Both basebands overlap, with an offset of 7 channels. With this setup, the SPWs 3 and 11 covered the redshifted CO(1–0) line. At the optical redshift the CO(1–0) line is shifted to 35.9067 GHz. The source J2346+0930 was used for gain and pointing calibration. The sources J0137+3309 (3C48) and J2253+1608 (3C454.3) were used for flux and bandpass calibration, respectively. Data calibration, flagging and imaging was done using the CASA package. The data were mapped using natural weighting and cleaning down to around a tight box around the source. The final sensitivity and beam are listed in Table 1.
3 Results and Analysis
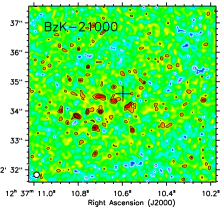
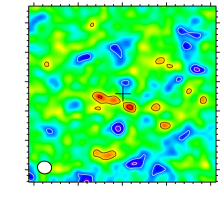
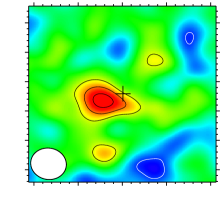
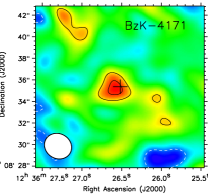
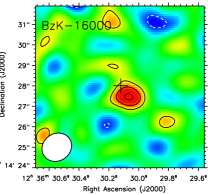
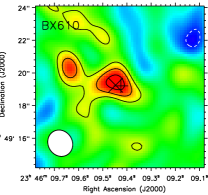
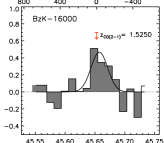
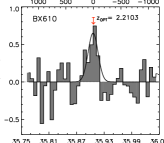
CO(1–0) line emission is detected in all galaxies in the sample. Figures 1, 2 and 3 show the obtained CO maps and respective spectra. Table 2 summarizes the results.
BzK-21000 is the only source where the resolution of the observations can probe smaller spatial scales. Here, the CO emission is resolved into several “clumps”. Given the complex structure of the CO emission, and in order to measure the full line intensity across the galaxy, we created a new CO moment-0 map, tapering at a lower resolution (; Fig. 1). While the source is still marginally resolved at this resolution, most of the internal structures are smoothed over. In the case of BzK-16000, BzK-4171 and BX-610, the emission is unresolved at the resolution and significance of the observations.
We derive total integrated line intensities from the velocity-integrated maps, by fitting Gaussians that were constrained by the position and size of the sources from the previous higher CO observations with the Plateau de Bure Interferometer (PdBI; Daddi et al., 2010a; Tacconi et al., 2013). The CO intensities are listed in Table 2. In the case of BzK-21000, this value includes a 12% correction that takes into account the part of the line that falls outside the VLA tuning. The poor significance of the detections leads to small spatial offsets between the optical and CO(1–0) positions which might affect the derived CO fluxes. In the sample of BzK galaxies, the previous CO(1–0) observations are within of the new CO intensities (Table 2) with the exception of BzK-21000, where the difference is at the level (Aravena et al., 2010). This suggests that such offsets have only a minor effect in the final CO intensities. Also, as shown in Fig. 2, the CO(1–0) peak position is in agreement with the CO(3–2) position for BX610.
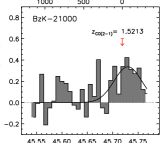
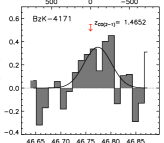
Figure 3 shows the CO(1–0) spectra obtained for all sources. In the case of BzK-21000, where the emission is clearly resolved into more than a single component, we plot the spatially integrated spectrum. Since we are not resolving the CO emission in the other objects at the significance of the detections, we show the spectra at the peak position for these cases. By fitting a single Gaussian to the spectra we find the CO redshifts and line-widths listed in Table 2. The latter compares well with the line profiles shown by Daddi et al. (2010a) and Tacconi et al. (2013), however, any difference should not significantly affect our estimate of the CO integrated intensity, as it corresponds to the integral along the spectra from the moment-0 map.
3.1 CO luminosities and gas masses
We derive CO luminosities through , where is the luminosity distance at redshift , in Mpc, is the observing frequency, in GHz, and is the line intensity in Jy km s-1 (Solomon et al., 1997). Using the measured CO line intensities, we obtain the CO luminosities listed in Table 2.
To estimate the gas masses from CO measurements, a conversion factor between CO luminosity and gas mass, is commonly used (in units [K km s-1 pc2]-1) such that . Local Ultra-Luminous Infrared Galaxies (ULIRGs) were found to be consistent with (Downes & Solomon, 1998), however, in the Milky Way this factor was found to be (e.g., Bolatto et al., 2013). The latter is consistent with recent findings that suggest in disk galaxies (Daddi et al., 2010a), however its actual value appears to be dependent on metallicity and highly uncertain (e.g., Genzel et al., 2012). Individual values of for the BzK galaxies range from with typical uncertainties of (Daddi et al., 2010a).
Since most of our targets correspond to the ones used by Daddi et al. to derive this conversion factor, we adopt throughout. The molecular gas masses obtained thereby are listed in Table 2.
3.2 Line ratios
Assuming the CO lines can be approximated in the Rayleigh-Jeans (RJ) limit, we can estimate the ratio between the CO(2–1) and CO(1–0) as , where and are the brightness temperatures of the CO(2–1) and CO(1–0) lines, correspond to the CO line intensities, and and are the rest-frame CO line frequencies. Similarly, for the ratio between CO(3–2) and CO(1–0) we have . The corresponding line ratios thereby obtained are listed in Table 2.
For local thermodynamic equilibrium (LTE) of the molecular gas, we would expect . However, in all cases we find that the ratios and are below unity, indicating that the gas is already sub-thermally excited at the CO(2–1) line. In the cases of BzK-4171 and BzK-16000, the new observations confirm within the uncertainties the previously derived values for (Dannerbauer et al., 2009; Aravena et al., 2010). In the case of BzK-21000, the larger CO(1–0) intensity measured, compared to the previous measurements (Aravena et al., 2010), imply a lower value yet still consistent with both lines being close to LTE. From these, we find a noise weighted average ratio between the 3 galaxies . For the two galaxies with CO(3–2) measurements, we derive a noise weighted average , where the quoted uncertainty includes the errors in the line ratio measurements () and the scatter around the average ratio ().
3.3 Star-formation efficiencies
The SFR per unit mass of molecular gas, or the inverse of the gas depletion timescale, is usually taken as a measure of the star formation efficiency, SFE . Given the large uncertainties in the calibrations when obtaining SFRs from IR luminosities and molecular gas masses from CO luminosities (the factor), a proxy for the SFE has also been defined as the ratio between the IR luminosity and the CO(1–0) luminosity, with SFE in units of (K km s-1 pc2)-1. The SFEs for our sample are listed in Table 2. As an effect of the revision in the line ratios in the previous section, the SFEs appear to be slightly lower than previously reported for these galaxies, yet well within the range found for local spiral galaxies with SFEs ranging from 10 to 100 (K km s-1 pc2)-1 (e.g. Leroy et al., 2008). SFE values for ULIRGs and distant SMGs typically exceed 100 (K km s-1 pc2)-1 (e.g., Yao et al., 2003; Neri et al., 2003; Greve et al., 2005; Bouché et al., 2007).
4 Discussion
4.1 Gas excitation
Even though we only have two sources with values measured, and clearly more measurements are needed, our results support the typically assumed line ratio . However, this also suggests that individual ratios can span a significant range from 0.4 to 0.6, and possibly larger given the uncertainties. Thus, while it is valid in a statistical sense to assume a constant value for this ratio, such an assumption may not necessarily be applicable to individual cases. This uncertainty can be considered to be relevant and at the same level of other involved sources of uncertainty such as low significance of CO detections, the conversion factor, etc.
Our average value compares well with the average ratio found for three disk galaxies at (Bauermeister et al., 2013), which have SFRs of 40–60 M⊙ yr-1. Such low gas excitation has also been found in some SMGs at , with an average value of (Harris et al., 2010; Ivison et al., 2011; Riechers et al., 2011b; Danielson et al., 2011; Bothwell et al., 2013; Spilker et al., 2014). However, these line ratios might be the result of CO(1–0) being more spatially extended than higher-J CO lines with the line ratios being considerably higher in their centers. Distant quasar host galaxies (and radio galaxies) appear to be mostly thermalized at the CO(3–2) line (e.g., Riechers et al., 2011a; Ivison et al., 2008, 2012), highlighting the role of AGN in molecular gas excitation in the host galaxy. This suggest that in disks and SMGs the gas excitation, and thus , might be more influenced by star formation activity that it is in quasar host galaxies where the powerful AGN may play a more important role in gas heating.
4.2 Finding clumps in CO data: BzK-21000
The high resolution achieved in the observations of BzK-21000 enables us to look for bright compact CO clumps. While the map tapered to resolution only reaches a significance of for the integrated CO emission of the galaxy, compact clumps with larger brightness temperatures () might be identified in the high resolution CO data cube.
We searched for clumps using the AIPS task SERCH, which carries out a matched-filter analysis using a Gaussian kernel to convolve the data cube along the frequency axis with an expected input line width, and thereby searches for regions with a significance over a specified limit. This method has been used for source finding in a number of studies (e.g., Hodge et al., 2012). The expected size of the molecular clumps range from 0.3–1.0 kpc based on the size of star forming and stellar clumps from observations (e.g., Swinbank et al., 2010; Jones et al., 2010; Förster Schreiber et al., 2011) and numerical simulations (e.g., Bournaud et al., 2007; Elmegreen et al., 2008; Dekel et al., 2009). We thus use a data cube in the native angular resolution of , or 1.5 kpc at (slightly larger than the expected clump size) and channel width of 52 km s-1. We searched for clumps within a region of centered at the VLA radio position of BzK-21000 (Morrison et al., 2010), utilizing Gaussian kernels in the range 50 to 200 km s-1 in steps of 2 channels ( km s-1) with a signal-to-noise cut at . As a cross check, we independently inspected the data cube and manually searched for bright knots. We find that 4 line candidates can be identified in this way. Based on the number of negative peaks in the cube, however, we expect that 2 of these candidate clumps are false detections.
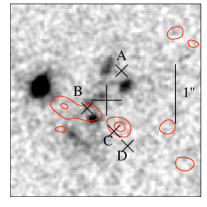
Figure 4 shows the spatial location of each of the identified CO knots in the cube compared to the optical and average CO images of BzK-21000. Figure LABEL:fig:clump_co shows the CO profiles for each of these candidates. Only one of the identified clump candidates (clump ) appears to coincide with an optical feature and with positive emission in the average CO map. In this case, however, the associated CO line profile appears to be the narrowest ( km s-1). The disagreement in position between CO and optical clumps could indicate differential obscuration within the galaxy, where optical clumps represent less obscured regions poorer in molecular gas, however at the significance of the observations it is also possible that some of the CO candidates are false. Astrometric errors are unlikely given the accuracy of the HST images to .
Using a Gaussian fit to the CO profiles, assuming a Rayleigh-Jeans approximation and accounting for redshift (factor ), we obtain brightness temperatures in the range K (rest-frame) and line FWHM in the range km s-1. Based on this, and the conservative assumption that (K km s-1 pc2)-1, much larger than the value found for giant molecular clouds in our Galaxy (; Oka et al., 1998), we obtain gas masses in the range . Together, these compact regions would make up to of the total gas mass of BzK-21000, suggesting that a significant fraction of the molecular gas is diffuse or distributed in smaller and fainter clouds within this system. Using a lower conversion factor, more appropriate for giant molecular clouds, would lead to a significantly lower contribution from these CO clumps to the total gas mass in the galaxy.
Few sub-arcsecond resolution studies have been able to search for CO clumps in high redshift galaxies (e.g., Riechers et al., 2008, 2009; Swinbank et al., 2010, 2011; Hodge et al., 2012; Freundlich et al., 2013), mostly due to limitations in bandwidth, velocity resolution and sensitivity. Gravitational lensing has helped to resolve the emission in some systems. Swinbank et al. (2011) shows clear evidence for CO clumps in the bright gravitationally lensed disk galaxy SMM J2135–0102, finding clump sizes of 100–300 pc with velocity dispersions of 40–80 km s-1. In this case, the molecular clumps constitute the total gas mass of the system (for ). Their results are similar to what is found more recently in the clump search toward the SMG GN20 (Hodge et al., 2012), and consistent with our limit for BzK-21000.
Independent of whether the candidate CO clumps are real or not in BzK-21000, it is clear that their brightness temperatures are below the average dust temperature in the galaxy of K (Magdis et al., 2011), implying that these gas clumps are either narrow in velocity ( km s-1) or have sizes that are smaller than the current spatial resolution ( kpc in size), or both.
5 Conclusions
We have presented detections of the CO(1–0) line emission in four massive star-forming galaxies in the redshift range . Our observations allow us to confirm previous measurements of the brightness temperature line ratio between the CO(2–1) to CO(1–0) lines in three BzK galaxies. We measure average line ratios of (based on the 3 BzK galaxies) and (based on two objects). These findings indicate that the molecular gas is, on-average, likely sub-thermally excited already in the CO(2–1). We find that the gas is sub-thermal in both cases at the CO(3–2) line, and support the widely assumed line ratio (Tacconi et al., 2010, 2013; Genzel et al., 2013). Since ranges from 0.4 to 0.6, we note that care must be exercised in assuming the average line ratio for individual cases.
Finally, we took advantage of the high angular resolution achieved for BzK-21000, and searched for gas clumps in the CO data cube. We found 4 clump candidates with estimated gas masses that can account for up to 40% of the total molecular gas mass of this system.
Acknowledgements
MA and this work was co-funded under the Marie Curie Actions of the European Commission (FP7-COFUND). CC thanks the Kavli Institute for Cosmology for their hospitality. The National Radio Astronomy Observatory is a facility of the National Science Foundation (NSF), operated under cooperative agreement by Associated Universities Inc.
References
- Ao et al. (2008) Ao Y., Weiß A., Downes D., Walter F., Henkel C., Menten K. M., 2008, A&A, 491, 747
- Aravena et al. (2010) Aravena M. et al., 2010, ApJ, 718, 177
- Bauermeister et al. (2013) Bauermeister A., Blitz L., Bolatto A., Bureau M., Teuben P., Wong T., Wright M., 2013, ApJ, 763, 64
- Bolatto et al. (2013) Bolatto A. D., Wolfire M., Leroy A. K., 2013, ARA&A, 51, 207
- Bothwell et al. (2013) Bothwell M. S. et al., 2013, MNRAS, 429, 3047
- Bouché et al. (2007) Bouché N. et al., 2007, ApJ, 671, 303
- Bournaud et al. (2007) Bournaud F., Elmegreen B. G., Elmegreen D. M., 2007, ApJ, 670, 237
- Carilli & Walter (2013) Carilli C. L., Walter F., 2013, ARA&A, 51, 105
- Chabrier (2003) Chabrier G., 2003, PASP, 115, 763
- Daddi et al. (2010a) Daddi E. et al., 2010a, ApJ, 713, 686
- Daddi et al. (2008) Daddi E., Dannerbauer H., Elbaz D., Dickinson M., Morrison G., Stern D., Ravindranath S., 2008, ApJ, 673, L21
- Daddi et al. (2005) Daddi E. et al., 2005, ApJ, 631, L13
- Daddi et al. (2007) Daddi E. et al., 2007, ApJ, 670, 156
- Daddi et al. (2010b) Daddi E. et al., 2010b, ApJ, 714, L118
- Danielson et al. (2011) Danielson A. L. R. et al., 2011, MNRAS, 410, 1687
- Dannerbauer et al. (2009) Dannerbauer H., Daddi E., Riechers D. A., Walter F., Carilli C. L., Dickinson M., Elbaz D., Morrison G. E., 2009, ApJ, 698, L178
- Dekel et al. (2009) Dekel A., Sari R., Ceverino D., 2009, ApJ, 703, 785
- Downes & Solomon (1998) Downes D., Solomon P. M., 1998, ApJ, 507, 615
- Elmegreen et al. (2008) Elmegreen B. G., Bournaud F., Elmegreen D. M., 2008, ApJ, 688, 67
- Erb et al. (2006) Erb D. K., Steidel C. C., Shapley A. E., Pettini M., Reddy N. A., Adelberger K. L., 2006, ApJ, 646, 107
- Förster Schreiber et al. (2009) Förster Schreiber N. M. et al., 2009, ApJ, 706, 1364
- Förster Schreiber et al. (2011) Förster Schreiber N. M. et al., 2011, ApJ, 739, 45
- Freundlich et al. (2013) Freundlich J. et al., 2013, A&A, 553, A130
- Genzel et al. (2008) Genzel R. et al., 2008, ApJ, 687, 59
- Genzel et al. (2012) Genzel R. et al., 2012, ApJ, 746, 69
- Genzel et al. (2006) Genzel R. et al., 2006, Nature, 442, 786
- Genzel et al. (2010) Genzel R. et al., 2010, MNRAS, 407, 2091
- Genzel et al. (2013) Genzel R. et al., 2013, ApJ, 773, 68
- Greisen (2003) Greisen E. W., 2003, Information Handling in Astronomy - Historical Vistas, 285, 109
- Greve et al. (2005) Greve T. R. et al., 2005, MNRAS, 359, 1165
- Harris et al. (2010) Harris A. I., Baker A. J., Zonak S. G., Sharon C. E., Genzel R., Rauch K., Watts G., Creager R., 2010, ApJ, 723, 1139
- Hodge et al. (2013) Hodge J. A., Carilli C. L., Walter F., Daddi E., Riechers D., 2013, ApJ, 776, 22
- Hodge et al. (2012) Hodge J. A., Carilli C. L., Walter F., de Blok W. J. G., Riechers D., Daddi E., Lentati L., 2012, ApJ, 760, 11
- Ivison et al. (2008) Ivison R. J. et al., 2008, MNRAS, 390, 1117
- Ivison et al. (2011) Ivison R. J., Papadopoulos P. P., Smail I., Greve T. R., Thomson A. P., Xilouris E. M., Chapman S. C., 2011, MNRAS, 412, 1913
- Ivison et al. (2012) Ivison R. J. et al., 2012, MNRAS, 425, 1320
- Jones et al. (2010) Jones T. A., Swinbank A. M., Ellis R. S., Richard J., Stark D. P., 2010, MNRAS, 404, 1247
- Komatsu et al. (2011) Komatsu E. et al., 2011, ApJS, 192, 18
- Leroy et al. (2008) Leroy A. K., Walter F., Brinks E., Bigiel F., de Blok W. J. G., Madore B., Thornley M. D., 2008, AJ, 136, 2782
- Magdis et al. (2012) Magdis G. E. et al., 2012, ApJ, 760, 6
- Magdis et al. (2011) Magdis G. E. et al., 2011, ApJ, 740, L15
- Magnelli et al. (2012) Magnelli B. et al., 2012, A&A, 548, A22
- McMullin et al. (2007) McMullin J. P., Waters B., Schiebel D., Young W., Golap K., 2007, in Astronomical Society of the Pacific Conference Series, Vol. 376, Astronomical Data Analysis Software and Systems XVI, Shaw R. A., Hill F., Bell D. J., eds., p. 127
- Morrison et al. (2010) Morrison G. E., Owen F. N., Dickinson M., Ivison R. J., Ibar E., 2010, ApJS, 188, 178
- Neri et al. (2003) Neri R. et al., 2003, ApJ, 597, L113
- Oka et al. (1998) Oka T., Hasegawa T., Hayashi M., Handa T., Sakamoto S., 1998, ApJ, 493, 730
- Papadopoulos & Ivison (2002) Papadopoulos P. P., Ivison R. J., 2002, ApJ, 564, L9
- Riechers et al. (2011a) Riechers D. A. et al., 2011a, ApJ, 739, L32
- Riechers et al. (2011b) Riechers D. A. et al., 2011b, ApJ, 733, L11
- Riechers et al. (2011c) Riechers D. A., Hodge J., Walter F., Carilli C. L., Bertoldi F., 2011c, ApJ, 739, L31
- Riechers et al. (2009) Riechers D. A. et al., 2009, ApJ, 703, 1338
- Riechers et al. (2008) Riechers D. A., Walter F., Brewer B. J., Carilli C. L., Lewis G. F., Bertoldi F., Cox P., 2008, ApJ, 686, 851
- Riechers et al. (2006) Riechers D. A. et al., 2006, ApJ, 650, 604
- Shapiro et al. (2008) Shapiro K. L. et al., 2008, ApJ, 682, 231
- Solomon et al. (1997) Solomon P. M., Downes D., Radford S. J. E., Barrett J. W., 1997, ApJ, 478, 144
- Spilker et al. (2014) Spilker J. S. et al., 2014, arXiv:1403.1667
- Swinbank et al. (2011) Swinbank A. M. et al., 2011, ApJ, 742, 11
- Swinbank et al. (2010) Swinbank A. M. et al., 2010, Nature, 464, 733
- Tacconi et al. (2010) Tacconi L. J. et al., 2010, Nature, 463, 781
- Tacconi et al. (2013) Tacconi L. J. et al., 2013, ApJ, 768, 74
- Weiß et al. (2007) Weiß A., Downes D., Neri R., Walter F., Henkel C., Wilner D. J., Wagg J., Wiklind T., 2007, A&A, 467, 955
- Yao et al. (2003) Yao L., Seaquist E. R., Kuno N., Dunne L., 2003, ApJ, 588, 771