Do cement nanoparticles exist in space?
Abstract
The calcium-silicate-hydrate is used to model properties of cement on Earth. We study cementitious nanoparticles and propose these structures as components of cosmic dust grains. Quantum density functional theory methods are applied for the calculation of infrared spectra of Ca4Si4O14H4, Ca6Si3O13H2, and Ca12Si6O26H4 clusters. We find bands distributed over the near, mid and far-infrared region. A specific calcium-silicate-hydrate spectral feature at 14 m, together with the bands at 10 and 18 m which exist for other silicates as well, could be used for a detection of cosmic cement. We compare calculated bands with the 14 m features in the spectra of HD 45677, HD 44179, and IRC+10420 which were observed by Infrared Space Observatory and classified as remaining. High abundance of oxygen atoms in cementitious nanoparticles could partially explain observed depletion of this element from the interstellar medium into dust grains.
keywords:
astrochemistry – methods: numerical – infrared: general – ISM: dust, extinction – ISM: abundances1 Introduction
Dust is produced in supernova explosions and the outflows of stars (Draine, 2011; Tielens, 2013). It is very important in the evolution of stars and galaxies. Dust grains act as a substrate for the formation of H2 and many other astrophysical molecules, including prebiotic ones. It is accepted today that cosmic dust consists of silicates and carbonaceous materials with impurities from several chemical elements. Using infrared spectroscopy both silicates and carbon based grains have been observed in various environments: close to Earth and exoplanets, in the interstellar medium, in comets, around stars, and active galactic nuclei. The light from cosmic objects heats dust grains, which is followed by a dust emission in the infrared spectral region. Absorption features in the infrared produced by dust are also observed. The size of grains is from the length of one molecule, up to several hundred micrometers. It is known that 10 per cent of grains are ultra-small, with the size around 1.5 nm or less (Li & Draine, 2001).
Cosmic dust mainly forms from the most abundant elements, such as silicon, carbon, oxygen, iron, and magnesium. Calcium is one of chemical elements that are produced in supernova explosions. It belongs to the group of twenty most abundant chemical elements in the Universe. The Ca II absorption was one of the first lines discovered in the interstellar space (Hartmann, 1904). It has been proposed that compounds which contain calcium exist in space. For example, spectra of Ca-poor and Ca-rich pyroxenes have been measured in the mid and far-infrared wavelengths in laboratories on Earth (Koike et al., 2001). It has been suggested that the amorphous diopside, CaMgSi2O6, contributes to the far-infrared spectrum of the planetary nebulae NGC 6302. Calcium has been measured in meteorites and rocks of Mars where it is a component in the calcium-aluminum-rich inclusions and chondrules (Simon, DePaolo & Moynier, 2009).
Calcium compounds are the main constituents of cement, which is one of the most used materials on Earth (Allen, Thomas & Jennings, 2007; Pellenq et al., 2009; Skinner et al., 2010; Masoero et al., 2012). The cement paste is formed when the cement powder, consisting mainly of alite (Ca3SiO5) and belite (Ca2SiO4), is mixed with water. The calcium-silicate-hydrate has a granular complex structure. Its chemical composition is variable, being characterized by the CaO:SiO2 ratio in the range from 0.7 to 2.3 (Manzano, Ayuela & Dolado, 2007). It has been found that temperatures above 350 K are necessary for the reaction between H2O gas molecules and silicates in the outflows of stars (Grossman & Larimer, 1974). However, silicate cosmic dust grains are often covered with water ice mantles. H2O from mantles could react with silicates and calcium atoms and form a cosmic cement paste. We expect that cementitious materials could be produced as a dust component around oxygen-rich stars where silicates are dominant. The presence in space of various minerals in the form of hydrous silicates (for example, talc Mg3[Si4O(OH)2] and montmorillonite (Mg,Al)2[Si4O(OH)2](Na,K,Ca)nH2O) has been under discussion for some time (Whittet et al., 1997; Hofmeister & Bowey, 2006; Mutschke et al., 2008).
Infrared spectroscopy is used in the field of solid state astrophysics (Jager et al., 2011), and astronomical observations are compared with spectra measured in laboratories. For example, spectra between 2.4 and 195 m for 17 oxygen-rich circumstellar dust shells were observed using the Short and Long Wavelength Spectrographs on the Infrared Space Observatory (ISO) and compared with laboratory measurements (Molster et al., 2002; Molster, Waters & Tielens, 2002). Although many bands were fitted with measured spectra of Mg-rich olivines and pyroxenes, 20 per cent of the spectral features were not identified. The Spitzer and Herschel missions collected many infrared spectra of dust grains (Watson et al., 2009; Ciesla et al., 2014). In laboratory measurements, in order to model various cosmic conditions, spectra of materials are studied from very low temperatures up to 1000 K. However, the interpretation of measured infrared spectra of complex materials can often be involved. Infrared spectroscopy of nanoparticles is even more demanding in comparison with measurements of the bulk material. Computational infrared studies of dust materials provide a connection between the microscopic structure and spectral properties. This is very important in astrophysics. For example, because of astronomical emissions at 3.3, 6.2, 7.7, 8.6, 11.2, and 12.7 m, infrared spectra of polycyclic aromatic hydrocarbons (PAHs) have been calculated and assembled in a spectroscopic database (Bauschlicher et al., 2010; Boersma et al., 2014). Recently, spectra of PAHs clusters have been calculated (Ricca, Bauschlicher & Allamandola, 2013). Infrared spectra of a dust grain model in the form of the bare nanopyroxene cluster Mg4Si4O12, as well as of its hydrogenated and oxygenated forms, have also been calculated by quantum computational methods (Goumans & Bromley, 2011).
Various crystalline and amorphous forms of silicates with different sizes, shapes and chemical compositions could form under diverse conditions in space (Henning, 2010). We have selected three clusters which consist of Ca, Si, O, and H atoms. Using these nanoparticles we model the crystalline and amorphous states of possible ultra-small cosmic dust grains with the structure of cement paste. Density functional theory computational methods (Martin, 2004) are used to study structural properties of these nanoparticles, calculate vibrational modes, and explore important features in their infrared spectra.
2 Computational methods
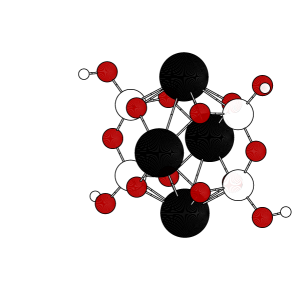
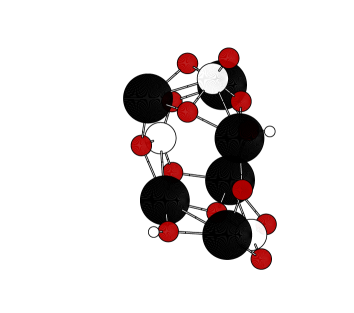
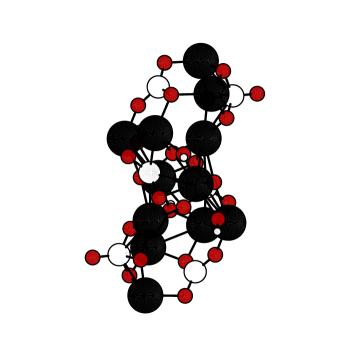
The accepted model of cosmic silicates is an arrangement of small silicate particles of different sizes (Henning, 2010). We study three nanoparticles which exhibit the typical bonding and small scale structure of the cement paste. These three models of ultra-small cosmic particles are selected to represent crystalline and amorphous cosmic silicates, both found in cosmic dust. One cluster, Ca4Si4O14H4 (labelled as C1 in the following text), is chosen to model a crystalline state of any possible cosmic cement. This cluster has been modelled on the previous Hartree-Fock calculation on the formation of cementitious nanoparticles (Manzano, Ayuela & Dolado, 2007). The structure of C1 has been proposed by Manzano et al as a common precursor of both tobermorite and jennite bulk crystal structures of the calcium-silicate-hydrate. The same C1 structure, but in the narrower spectral region, has been studied using the semi-empirical MNDO and density functional theory methods (Bhat & Debnath, 2011). We also study two amorphous nanoparticles, Ca6Si3O13H2 (C2 in the following text) and Ca12Si6O26H4 (labelled as C3). They have been cut from the bulk of the calcium-silicate-hydrate presented in the Materials Project (Jain et al., 2013). The clusters are characterized by the CaO:SiO2 ratio of 1 (in C1) and 2 (in C2 and C3). One (in C2) and two (in C1 and C3) units of water (2H and O) are present.
We have used the real-space GPAW density functional program package (Enkovaara et al., 2010) and its ASE (Atomistic Simulation Environment) user interface (Bahn & Jacobsen, 2002). The PBE generalized gradient approximation (GGA) exchange-correlation functional (Perdew, Burke & Ernzerhof, 1996), and the PAW (projector augmented wave) pseudopotentials (Mortensen, Hansen & Jacobsen, 2005) are applied. The C1 cluster is globally optimized. We use the Monte Carlo basin-hopping algorithm (Wales & Doye, 1997; Wales & Scheraga, 1999) as implemented in ASE. All interactions in this optimization are treated within GPAW, at the same density functional theory level (i.e., using the GGA functional and the PAW pseudopotentials). It is known that the Monte Carlo basin-hopping algorithm method is very successful in finding minima of clusters (Bilalbegovic, 2003; Goumans & Bromley, 2011; Jiang & Walter, 2011). Infrared spectra are calculated using the finite difference approximation, both for the dynamical matrix and the gradient of the dipole momentum of the system (Porezag & Pederson, 1996; Frederiksen et al., 2007). In this method the infrared intensity of the mode is calculated from
| (1) |
where is the particle density, is the velocity of light, is the electric dipole momentum, and is the coordinate of the normal mode. The GPAW code and the PBE GGA functional have been recently employed to calculate the infrared spectrum of thiol-stabilized gold nanoclusters (Hulkko et al., 2011). These results have been compared with measurements and a very good agreement is found. Our results for the crystalline C1 cluster agree with the calculations of Bhat and Debnath, which have been carried out at local density approximation (LDA) and GGA BLYP levels (Bhat & Debnath, 2011). Two bands in spectra of amorphous clusters C2 and C3 agree with laboratory measurements on calcium silicate smoke samples in the mid-infrared region (Kimura & Nuth, 2005).
3 Results and Discussion
Optimized structures for the cementitious clusters we have studied are shown in Fig. 1. We have found that clusters C2 and C3 are less stable than the crystalline precursor C1. A small displacement of atoms from the structures of C2 and C3, corresponding to the their local minima, quickly leads to bigger forces between atoms. Potential energies are: -6.771 eV/atom (C1), -6.668 eV/atom (C3), and -6.476 eV/atom (C2). When compared to C2, the cluster C3 has all numbers of atoms doubled. However, C2 is less stable than C3. Clusters C2 and C3 represent amorphous nanoparticles that could form under various conditions of temperatures, pressures, radiations, and shock waves in space. In contrast, the structure of C1 is very stable - which confirms the idea of Manzano et al (Manzano, Ayuela & Dolado, 2007) that this cluster is a building block of cement on Earth. Clusters C2 and C3 are examples of many possible amorphous silicate nanoparticles in space. We have calculated that, in addition to the specific cement band at 14 m, amorphous clusters C2 and C3 exhibit the typical bands of amorphous cosmic silicates at 10 and 18 m. This shows that our models of amorphous cement nanoparticles are reliable. Both amorphous and crystalline silicates have been observed in cosmic dust (van Boekel et al., 2005). Amorphous silicates are typical for the interstellar medium, whereas in circumstellar disks both crystalline and amorphous silicates exist. Crystalline silicates are also found in comets and dust particles in the Solar system. Infrared spectra are used for the analysis of these various forms of silicate cosmic dust (Kessler-Silacci et al., 2006; Henning, 2010; Draine, 2011).
In the majority of bulk silicates the Si atom is positioned in the tetrahedra of oxygen atoms. In the mineralogy of silicates several complex structures are known, for example two tetrahedra sharing one oxygen atom (as in gehlenite Ca2Al2SiO7), or tetrahedra that form rings (as in the beryl Be3Al2Si6O18). Several other arrangements of chains and rings exist in various silicates. Hydrous silicates belong to the group of phyllosilicates where layers of silicates and OH layers appear. Higher coordination numbers in silicates are also known. For example, the octahedral configuration of Si occurs under high pressures, or in the mineral thaumasite, Ca3Si(OH)6(CO3)(SO4)12H2O. Thaumasite sometimes forms in cements when their main components are exposed to sulphates (Nobst & Stark, 2003). We have found that in the C1 cluster all silicon atoms are tetrahedrally coordinated. In C2 two Si atoms are surrounded by three oxygens, and one with four O atoms. Four Si atoms are tetrahedrally coordinated, and two silicon atoms have three nearest oxygen neighbours in the C3 cluster.
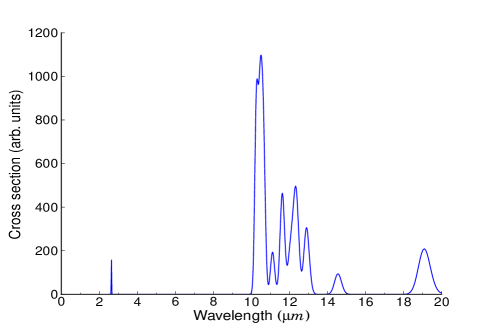
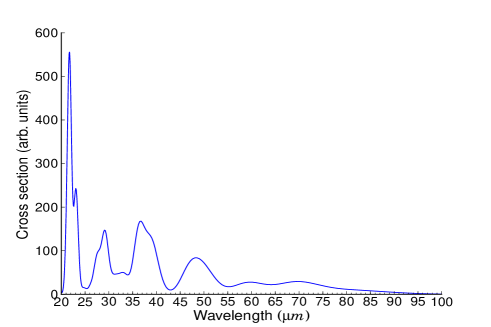
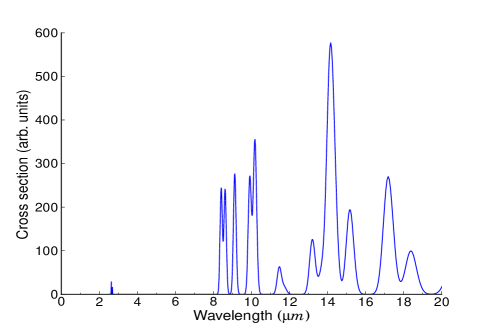
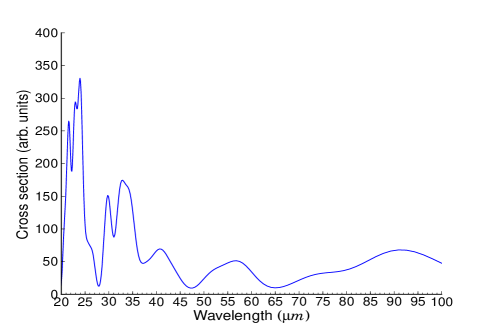
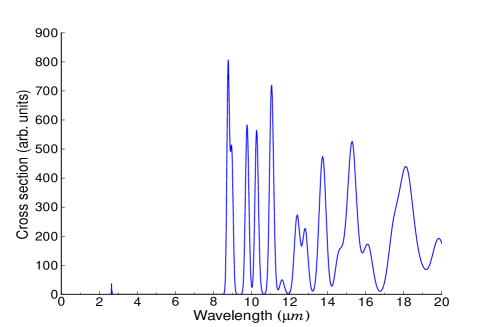
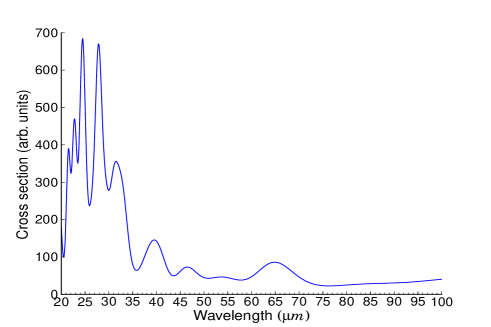
Infrared spectra (calculated for nanostructures presented in Fig. 1) are shown in Figs. 2-4. Theoretical results for infrared spectra consist only of vertical lines. In contrast, in measured astronomical IR spectra these lines are broad and reflect conditions of observed objects (Bauschlicher et al., 2010). It is a common practice to broaden theoretical lines. We use the Lorentzian band profiles with FWHM of 20 cm-1. Bands with higher intensities, calculated using Eq.1, are shown in Table 1.
The lines with a small intensity exist in the near-infrared region at 2.62, 2.64, and 2.65 m for C1 (Fig. 2), 2.63 and 2.69 m for C2 (Fig. 3), 2.64, 2.66, and 2.67 m for C3 (Fig. 4). Bhat and Debnath for C1 calculated 2.63 (in LDA) and 2.67 m (in GGA BLYP) (Bhat & Debnath, 2011). A spectral region at (2 – 4) m is known as the water ice band (Gibb et al., 2004). The interval (2.6 – 2.8) m corresponds to vibrations of O-H in hydrated silicates. The water ice band has been studied in the astrophysical context because of various hydrosilicate minerals (Whittet et al., 1997; Hofmeister & Bowey, 2006; Mutschke et al., 2008), or H2O trapped and adsorbed in the SiO condensate (Wada, Sakata & Tokunaga, 1991).
Bands in the near and beginning of mid-infrared region have been found in laboratory measurements of CaO and Ca(OH)2 grains and the measured line at 6.8 m has been proposed to explain this feature in the spectra of young stellar objects (Kimura & Nuth, 2005). Typical features of amorphous silicates in mid-infrared are broad bands at 10 and 18 m which correspond to the Si-O stretching and O-Si-O bending modes. Silicate bands in the far infrared also exist and they are attributed to metal-oxygen modes.
In the mid-infrared region of the C1 cluster (Fig. 2 and Table 1) we found five close bands at 10 m: 10.26, 10.29, 10.40, 10.47, and 10.63 m. In addition, we have calculated several bands of a smaller intensity between 11 and 13 m, as well as at 14.44, 14.55 and 19.08 m. Several bands appear above 20 m, the strongest ones at 21.73 and 23.11 m. The far-infrared spectrum is broad and with a small intensity. Main bands in this region are 36.44 and 38.76 m. Bhat and Debnath for the mid-infrared region of C1 also did not find any lines below 10 m in their GGA BLYP approximation, but such lines appear in LDA (Bhat & Debnath, 2011). Our other calculated lines in mid-IR are in good agreement with their results. They did not calculate bands above 22 m.
In the mid-infrared spectral region of the C2 cluster (Fig. 3 and Table 1) bands appear also slightly below 10 m: 8.41, 8.61, 9.12, and 9.91 m. There are strong bands at 10.18, 14.32 and 17.18 m. Several other bands of a smaller intensity exist between 10 and 20 m. For the C2 cluster many bands appear above 20 m. The strongest bands in this region are: 22.90, 24.03, 29.9, and 34.47 m. In the mid-infrared spectral region of the C3 cluster (Fig. 4 and Table 1) stronger bands are close to 8, 9, 10, 11, 12, 13, 14, 15, 16, 17, 18, 19, 21, 22, 24, 27, 29, and 30 m. Weaker bands exist above 30 m. A rather strong band (with the intensity of 71.98 km/mol) is calculated at 64.93 m. The calcium-silicate compound diopside CaMgSi2O6, proposed as a contributor to the far-infrared spectrum of the planetary nebulae NGC6302, shows the band at 65 m (Koike et al., 2001).
| C1 | C2 | C3 | |||
|---|---|---|---|---|---|
| Band (m) | Intensity (km/mol) | Band (m) | Intensity (km/mol) | Band (m) | Intensity (km/mol) |
| 2.64 | 70.19 | 8.41 | 243.78 | 8.77 | 493.45 |
| 10.26 | 820.40 | 8.61 | 240.98 | 8.92 | 264.52 |
| 10.40 | 93.81 | 9.12 | 277.37 | 8.99 | 282.56 |
| 10.47 | 786.97 | 9.91 | 269.79 | 9.74 | 382.20 |
| 10.63 | 671.12 | 10.18 | 354.15 | 9.81 | 262.97 |
| 11.11 | 183.01 | 11.46 | 62.57 | 10.27 | 558.72 |
| 11.61 | 136.73 | 13.20 | 126.10 | 11.05 | 721.71 |
| 11.62 | 249.77 | 14.10 | 434.48 | 12.34 | 153.84 |
| 12.04 | 178.55 | 14.32 | 257.23 | 12.46 | 152.52 |
| 12.23 | 179.10 | 15.17 | 195.06 | 12.82 | 221.98 |
| 12.35 | 127.78 | 17.18 | 252.09 | 13.63 | 183.52 |
| 12.38 | 240.04 | 18.38 | 99.73 | 13.79 | 343.60 |
| 12.89 | 291.28 | 20.60 | 64.24 | 14.58 | 130.18 |
| 14.55 | 89.18 | 21.53 | 106.24 | 15.23 | 282.64 |
| 19.08 | 208.14 | 21.64 | 140.84 | 15.38 | 252.60 |
| 21.22 | 99.59 | 22.90 | 225.48 | 16.16 | 152.34 |
| 21.73 | 456.31 | 24.03 | 266.20 | 17.55 | 159.32 |
| 23.11 | 194.16 | 29.90 | 111.93 | 18.02 | 252.91 |
| 27.51 | 75.10 | 32.52 | 82.82 | 18.29 | 189.30 |
| 29.22 | 135.31 | 34.47 | 128.14 | 19.84 | 185.78 |
| 36.44 | 126.24 | 21.47 | 144.24 | ||
| 21.50 | 162.64 | ||||
| 22.86 | 289.28 | ||||
| 24.18 | 141.95 | ||||
| 24.30 | 143.60 | ||||
| 24.59 | 324.46 | ||||
| 27.84 | 496.63 | ||||
| 29.42 | 158.36 | ||||
| 30.95 | 164.26 |
Infrared spectroscopy is utilized for a characterization of bulk cementitious systems, but results depend on the variable chemical and structural composition of these materials (Yu et al., 1999; Garbev et al., 2007). Belite (Ca2SiO4) is one of the most important components of the cement paste. In -Ca2SiO4 a symmetrical stretching vibration of SiO4 tetrahedra is assigned to bands measured at 11.57 and 11.74 m (Bensted, 1976). In alite (Ca3SiO5), which is also a major component of cement, weak bands exist at 6.42, 6.79 and 7.04 m, and strong ones at 10.64, 11.01, 11.32, 12.30, 18.98, and 22.08 m (Delgado, Paroli & Beaudoin, 1996). In the hydrated cement paste, where the ratio CaO/SiO2 is 1.5, stronger bands appear at 30.03 (Ca-O lattice vibrations), 22.47 (O-Si-O bending vibrations in SiO4), 14.88 (assigned to the bending of two connected SiO4 tetrahedra), and 11.25 and 9.78 m (both assigned to the symmetric stretching of SiO4 tetrahedra) (Garbev et al., 2007). Bands in the near-infrared region (at 6.1, 2.89, 2.81 and 2.76 m) that correspond to the OH stretching vibrations in water and Ca(OH)2 also exist in the spectra of hydrated cement paste. The most intense peak of cement is at 14.88 m. This is the dominant and specific band for all hydrated cement paste compositions, i.e., for the ratios CaO/SiO2 between 0.2 and 1.5 (Garbev et al., 2007).
Spectral features at 9.2 and 21.7 m have been measured for calcium silicate smoke grains prepared in the laboratory by vapour phase condensation in the study of CaO and Ca(OH)2 cosmic dust (Kimura & Nuth, 2005). Close bands exist for C2 (9.12 and 21.64 m ) and C3 (8.99 and 21.50 m). A specific 14 m band of the bulk cement paste is present in the spectra of clusters. We have found that bands at 14.44 and 14.55 m (Fig. 2) exist for the most stable nanoparticle C1. This should be compared with the strong band for C2 at 14.10 m (Fig. 3), and at 14.58 m for C3 (Fig. 4). There is a strong band for C3 at 11.05 m, whereas in this region the weak band at 11.46 m exists for C2, and at 11.62 m for C1. Bands at 18 m are also typical for amorphous cosmic silicates. For amorphous clusters bands appear at 18.38 m (C2) and at 18.02, 18.29, 18.58, and 18.99 m (C3). Bands at 18 m do not exist for the crystalline precursor C1. While bands around (10–11) and 18 m appear in spectra of other silicates, features at 14 m can be used to characterize cement nanoparticles.
Bands at 14 m have been observed by the Infrared Space Observatory in the spectra of objects from a sample of 17 oxygen-rich circumstellar dust shells (Molster et al., 2002; Molster, Waters & Tielens, 2002). Weak features at 13.8 and 14.2 m have been measured and classified as remaining bands or ‘(partly) instrumental’. For example, bands at 13.5, 13.8, and 14.3 m in the spectrum of HD 45677 have been clearly detected. Other examples of band observations around 14 m in the same sample are from the objects HD 44179, Roberts 22, and IRC+10420. However, silicate bands at 10 and 11 m have not been observed for Roberts 22 (Molster et al., 2002). A silicate band at 18 m exists for this object. In contrast, silicate bands in both regions have been found in the spectra of HD 45677, HD 44179 and IRC+10420. We expect that exact positions of cement bands could vary with the composition and size of nanoparticles. To facilitate a comparison, in Table 2 the typical silicate and cement bands for the nanoparticles we studied are presented, together with the corresponding silicate and unidentified bands in the spectra of HD 45677, HD 44179 and IRC+10420 (Molster et al., 2002). In Table 3, bands above 19 m are compared. Bands for cement nanoparticles of various compositions and sizes cover all region of observed features in these stellar objects. In addition, HD 44179 was studied by Spitzer and unknown mid-infrared resonances in the 13–20 m range were observed (Markwick-Kemper, Green & Peeters, 2005). A broad peak at 13-17 m was found and a mixture of Mg-Fe-oxides with unknown material was proposed as a carrier (Markwick-Kemper, Green & Peeters, 2005). It is possible that cement nanoparticles contribute to this peak.
| Object | Bands (m) |
|---|---|
| C1 | 10.26, 10.29, 10.40, 10.47, 10.63, 11.02, 11.11, 11.34, 11.59, 11.61, 11.62, 11.75, 14.44, 14.55 |
| C2 | 9.91, 10.18, 11.46, 11.73, 13.71, 14.10, 14.32, 18.38 |
| C3 | 9.74, 9.81, 10.27, 10.40, 11.05, 11.28, 11.60, 11.61, 13.63, 13.79, 14.58, 14.94, 18.02, 18.29, 18.58, 18.99 |
| HD 45677 | 9.81, 9.99, 10.57, 11.06, 11.50, 13.54, 13.77, 14.3, 18.06, 18.88 |
| HD 44179 | 10.8?, 13.58, 14.19, 18.03, 18.97 |
| IRC+10420 | 10.6, 10.7?, 11.04, 13.51, 13.76, 14.15, 18.2 |
| Object | Bands (m) |
|---|---|
| HD 45677 | 19.43, 20.67, 21.59, 22.41, 22.95, 23.67, 24.52, 25.04, 26.07, 26.93, 27.75, 28.30, 29.37, |
| 30.61, 32.33, 32.79, 33.65, 34.5, 35.6, 38.21, 39.87, 40.64, 41.70, 42.95, 43.60, 44.90 | |
| HD 44179 | 19.65, 20.77, 21.59, 22.86, 23.81, 24.65, 24.99, 26.08, 27.69, 28.26, 29.44, 30.77, 32.51, |
| 33.03, 33.70, 34.35, 35.28, 36.02, 36.53, 40.46, 43.5, 48.0, 56.6, 65.6, 69.02 | |
| IRC+10420 | 20.70, 21.45, 22.96, 23.73, 24.16, 26.01, 27.48, 27.97, 32.56, 32.99, 33.54, 34.82, 35.95, |
| 40.37, 41.5, 43.00, 44.39, 47.83, 49.07, 54.9, 61.6 | |
| C1 | 19.08, 21.22, 21.73, 21.96, 22.96, 23.11, 24.76, 26.25, 27.51, 28.16, 29.22, 31.22, 33.01, 33.60, |
| 35.92, 36.44, 36.86, 38.76, 39.40, 46.31, 47.68, 48.39, 50.48, 50.89, 58.74, 60.51, 69.06 | |
| C2 | 20.60, 20.92, 21.53, 21.64, 22.53, 22.90, 23.69, 24.03, 24.82, 25.49, 26.59, 29.42, 29.90, |
| 32.16, 32.52, 33.05, 34.47, 37.08, 37.93, 39.55, 41.24, 43.43, 52.32, 57.04, 58.58 | |
| C3 | 19.84, 20.68, 21.47, 21.50, 22.40, 22.86, 23.76, 24.18, 24.30, 24.59, 24.88, 25.96, 26.43, |
| 26.69, 27.68, 27.84, 28.98, 29.42, 30.95, 31.34, 32.14, 32.65, 33.35, 39.69, 41.09, 64.93 |
Oxygen is one of chemical elements for which depletion in the gas phase has been observed over many sight lines (Jenkins, 2009; Whittet, 2010; Jenkins, 2014). It is known that in cosmic dust O atoms exist in silicates and metallic oxides. However, depletion of O atoms is much higher than, for example, of Mg, Si, or Fe, and can be even greater by a factor of 16 (Jenkins, 2009). Existing dust grain composition models cannot explain this. The ratio of numbers of O atoms and MgSi atoms even in the oxygen-rich MgSiO3 is 1.5. The ratio O/(CaSi) in our clusters C1, C2, and C3 is 1.75, 1.44, and 3.25 respectively. Therefore, the number of oxygen atoms in cementitious nanoparticles is large, and could help in the explanation of its depletion in the interstellar medium. A similar conclusion for the nanopyroxene cluster Mg4Si4O12 has been reached by Goumans and Bromley (Goumans & Bromley, 2011).
4 Conclusions
Silicates are one of main components of cosmic dust grains. However, their precise chemical composition is not known. To the pool of possible silicate materials in cosmic dust we have added cement. We have studied one crystalline and two amorphous Ca-Si-H-O clusters which represent the chemical composition and bonding of cement at the nanoscale. Their infrared spectra are calculated, and it is found that bands are distributed over the entire infrared spectrum. We propose that the features at 14 m, measured by the Infrared Space Observatory in the dust shells of several oxygen-rich stars and currently classified as unidentified (Molster et al., 2002; Molster, Waters & Tielens, 2002), are the cement bands. From the abundance of Ca and other chemical elements we do not expect that cement nanoparticles are a dominant species in cosmic dust. However, cementitious nanoparticles, because of the many oxygen atoms they consist of, could act as an additional reservoir of O in cosmic dust and help in the solution of its depletion in the interstellar medium. With a recent detection of Ca-rich supernovae that produce much larger amounts of calcium then previously expected (Perets et al., 2010; Kawabata et al., 2010), as well as after discoveries of water everywhere in Space by the Spitzer and Herschel missions (van Dishoeck, Herbst & Neufeld, 2013), all the necessary ingredients for the formation of cement nanoparticles in space are readily available.
Acknowledgments
This work has been done using the computer cluster “Isabella” at the University of Zagreb Computing Centre SRCE. GB acknowledges the support of the University of Zagreb research fund, grant “Physics of Stars and Cosmic Dust”. We are grateful to Goran Baranović for useful discussions. We thank the editor, Keith Smith, and the anonymous referee for their constructive comments and suggestions which have much improved the clarity of this manuscript.
References
- Allen, Thomas & Jennings (2007) Allen A. J., Thomas J. J., Jennings H. M., 2007, Nature Materials, 6, 311
- Bahn & Jacobsen (2002) Bahn S., Jacobsen K. W., 2002, Comput. Sci. Eng., 4, 56
- Bauschlicher et al. (2010) Bauschlicher C. W. et al., 2010, ApJS, 189, 341
- Bensted (1976) Bensted J., 1976, J. Am. Ceram. Soc., 59, 140
- Bhat & Debnath (2011) Bhat P. A., Debnath N. C., 2011, J. Phys. Chem. Sol., 72, 920
- Bilalbegovic (2003) Bilalbegovic G., 2003, Phys. Lett. A, 308, 61
- Boersma et al. (2014) Boersma C. et al., 2014, ApJS, 211, 8
- Ciesla et al. (2014) Ciesla L. et al., 2014, ArXiv e-print:1402.3597
- Delgado, Paroli & Beaudoin (1996) Delgado A. H., Paroli R. M., Beaudoin J. J., 1996, Appl. Spectrosc., 50, 970
- Draine (2011) Draine B. T., 2011, Physics of the interstellar and intergalactic medium. Princeton University Press
- Enkovaara et al. (2010) Enkovaara J. et al., 2010, J. Phys.: Condens. Matter, 22, 253202
- Frederiksen et al. (2007) Frederiksen T., Paulsson M., Brandbyge M., Jauho A. P., 2007, Phys. Rev. B, 75, 205413
- Garbev et al. (2007) Garbev K., Stemmermann P., Black L., Breen C., Yarwood J., Gasharova B., 2007, J. Am. Ceram. Soc., 90, 900
- Gibb et al. (2004) Gibb E. L., Whittet D. C. B., Boogert A. C. A., Tielens A. G. G. M., 2004, ApJS, 151, 35
- Goumans & Bromley (2011) Goumans T. P. M., Bromley S. T., 2011, MNRAS, 414, 1285
- Grossman & Larimer (1974) Grossman L., Larimer J. W., 1974, Rev. Geophys., 12, 71
- Hartmann (1904) Hartmann J., 1904, ApJ, 19, 268
- Henning (2010) Henning T., 2010, ARAA, 48, 21
- Hofmeister & Bowey (2006) Hofmeister A. M., Bowey J. E., 2006, MNRAS, 367, 577
- Hulkko et al. (2011) Hulkko E., Lopez-Acevedo O., Koivisto J., Levi-Kalisman Y., Kornberg R. D., Pettersson M., Hakkinen H., 2011, J. Am. Chem. Soc., 133, 3752
- Jager et al. (2011) Jager C., Posch T., Mutschke H., Zeidler S., Tamanai A., de Vries B. L., 2011, in Proceedings of the International Astronomical Union, “The Molecular Universe”, Vol. 280, p. 416
- Jain et al. (2013) Jain A. et al., 2013, APL Materials, 1, 011002
- Jenkins (2009) Jenkins E. B., 2009, ApJ, 700, 1299
- Jenkins (2014) Jenkins E. B., 2014, ArXiv e-print: 1402.4765
- Jiang & Walter (2011) Jiang D., Walter M., 2011, Phys. Rev. B, 84, 193402
- Kawabata et al. (2010) Kawabata K. S. et al., 2010, Nature, 465, 326
- Kessler-Silacci et al. (2006) Kessler-Silacci J. et al., 2006, ApJ, 639, 275
- Kimura & Nuth (2005) Kimura Y., Nuth J. A., 2005, ApJ, 630, 637
- Koike et al. (2001) Koike C. et al., 2001, AA, 363, 1115
- Li & Draine (2001) Li A., Draine B. T., 2001, ApJ, 550, L213
- Manzano, Ayuela & Dolado (2007) Manzano H., Ayuela A., Dolado J. S., 2007, J. Computer-Aided Mater Des, 14, 45
- Markwick-Kemper, Green & Peeters (2005) Markwick-Kemper F., Green J. D., Peeters E., 2005, ApJ, 628, L119
- Martin (2004) Martin R. M., 2004, Electronic Structure. Cambridge University Press, Cambridge
- Masoero et al. (2012) Masoero E., Gado E. D., Pellenq R. J. M., Ulm F. J., Yip S., 2012, Phys. Rev. Lett., 109, 155503
- Molster, Waters & Tielens (2002) Molster F. J., Waters L. B. F. M., Tielens A. G. G. M., 2002, AA, 382, 222
- Molster et al. (2002) Molster F. J., Waters L. B. F. M., Tielens A. G. G. M., Barlow M. J., 2002, AA, 382, 184
- Mortensen, Hansen & Jacobsen (2005) Mortensen J. J., Hansen L. B., Jacobsen K. W., 2005, Phys. Rev. B, 71, 035109
- Mutschke et al. (2008) Mutschke H., Zeidler S., Posch T., Kerschbaum F., Baier A., Henning T., 2008, AA, 492, 117
- Nobst & Stark (2003) Nobst P., Stark J., 2003, Cem. Concr. Compos., 25, 899
- Pellenq et al. (2009) Pellenq R. J. M., Kushima A., Shahsavari R., van Vliet K. J., Buehler M. J., Yip S., Ulm F. J., 2009, Proc. Nat. Acad. Sci. USA, 106, 16102
- Perdew, Burke & Ernzerhof (1996) Perdew J. P., Burke K., Ernzerhof M., 1996, Phys. Rev. Lett., 77, 3865
- Perets et al. (2010) Perets H. B. et al., 2010, Nature, 465, 322
- Porezag & Pederson (1996) Porezag D., Pederson M. R., 1996, Phys. Rev. B, 54, 7830
- Ricca, Bauschlicher & Allamandola (2013) Ricca A., Bauschlicher C. W., Allamandola L. J., 2013, ApJ, 776, 31
- Simon, DePaolo & Moynier (2009) Simon J. I., DePaolo D. J., Moynier F., 2009, ApJ, 702, 707
- Skinner et al. (2010) Skinner L. B., Chae S. R., Benmore C. J., Wenk H. R., Monteiro P. J. M., 2010, Phys. Rev. Lett., 104, 195502
- Tielens (2013) Tielens A. G. G. M., 2013, Rev. Mod. Phys., 85, 1021
- van Boekel et al. (2005) van Boekel R., Min M., Waters L. B. F. M., de Koter A., Dominik C., van den Ancker M. E., Bouwman J., 2005, AA, 437, 189
- van Dishoeck, Herbst & Neufeld (2013) van Dishoeck E. F., Herbst E., Neufeld D. A., 2013, Chem. Rev., 113, 9043
- Wada, Sakata & Tokunaga (1991) Wada S., Sakata A., Tokunaga A. T., 1991, ApJ, 375, L17
- Wales & Doye (1997) Wales D. J., Doye J. P. K., 1997, J. Phys. Chem. A, 101, 5111
- Wales & Scheraga (1999) Wales D. J., Scheraga H. A., 1999, Science, 285, 1368
- Watson et al. (2009) Watson D. M. et al., 2009, ApJS, 180, 84
- Whittet (2010) Whittet D. C. B., 2010, ApJ, 710, 1009
- Whittet et al. (1997) Whittet D. C. B. et al., 1997, ApJ, 490, 729
- Yu et al. (1999) Yu P., Kirkpatrick R. J., Poe B., McMillan P. F., Cong X., 1999, J. Am. Ceram. Soc., 82, 742