Dynamical Transition and Heterogeneous Hydration Dynamics in RNA
Abstract
Enhanced dynamical fluctuations of RNAs, facilitated by a network of water molecules with strong interactions with RNA, are suspected to be critical in their ability to respond to a variety of cellular signals. Using atomically detailed molecular dynamics simulations at various temperatures of purine (adenine)- and preQ1 sensing riboswitch aptamers, which control gene expression by sensing and binding to metabolites, we show that water molecules in the vicinity of RNAs undergo complex dynamics depending on the local structures of the RNAs. The overall lifetimes of hydrogen bonds (HBs) of surface bound waters are more than at least 1–2 orders of magnitude longer than bulk water. Slow hydration dynamics, revealed in non-Arrhenius behavior of the relaxation time, arises from high activation barriers to break water hydrogen bonds with a nucleotide and by reduced diffusion of water. The relaxation kinetics at specific locations in the two RNAs show a broad spectrum of time scales reminiscent of glass-like behavior, suggesting that the hydration dynamics is highly heterogeneous.
Both RNAs undergo dynamic transition at K as assessed by the mean square fluctuation of hydrogen atoms , which undergoes an abrupt harmonic-to-anharmonic transition at . The near universal value of found for these RNAs and previously for tRNA is strongly correlated with changes in hydration dynamics as is altered.
Hierarchical dynamics of waters associated with the RNA surface, revealed in the motions of distinct classes of water with well-separated time scales, reflects the heterogeneous
local environment on the molecular surface of RNA. At low temperatures slow water dynamics predominates over structural transitions.
Our study demonstrates that the complex interplay of dynamics between water and local environment in the RNA structures could be a key determinant of the functional activities of RNA.
Keywords: hydrogen bond; riboswitch aptamers; surface water; relaxation kinetics; Vogel-Fulcher-Tamman (VFT) equation; Arrhenius equation
INTRODUCTION
Water, the most abundant constituent in living organisms, is an essential determinant of the structure and dynamics, and hence the functions of biomolecules Dickerson1982 ; Doster1989 ; Rupley1991 ; Daniel2003 ; Roh2006 ; Caliskan2006 ; Roh2009 . In the well understood case of proteins the thermodynamic driving force that minimizes the free energy of proteins arises from the simultaneous requirements to sequester hydrophobic residues from water, and increase the extent of hydration of the surface-exposed hydrophilic residues. Interactions of hydrophilic residues with water enhance the dynamical fluctuation of proteins, promoting enzymatic activity Doster1989 ; Rupley1991 ; Fitter1996PNAS ; Reat2000PNAS ; Daniel2003 ; Roh2006 . Dynamic fluctuations of solvated folded proteins, quantified by the motion of hydrogen atoms using neutron scattering measurement, in aqueous D2O solution exhibit qualitative difference from dry proteins, the latter of which can be experimented in a dry powder form, in glycerol solvent Tsai00BJ , or in cryosolvent CD3OD/D2O, DMSO/D2O mixed in various proportions Reat2000PNAS . Temperature dependence of protein fluctuation shows that at low temperature mean square displacement (MSD) of hydrogen atoms in both wet and dry proteins increases in an identical fashion, but of wet proteins begins to deviate from its linear temperature dependence at the so called dynamical transition temperature K, which coincides with the temperature range where functions of most hydrated proteins begin to emerge Reat2000PNAS ; Ramunssen92Nature . Although the origin of enhanced amplitude of motion of above continues to be debated, it is clear that there is correlation between enzyme activity and abrupt increase in above .
Although not as extensively investigated as proteins, there are a number of studies on the hydration effects on DNA, focusing on hydration-induced conformational change from A- to B-form as well as on the variation in conductivity Dickerson1982 ; tao1989BP ; denisov1997JMB ; Endres2004 . In contrast, much less is known about the nature of water dynamics on RNA molecules and its role in modulating their functions. Despite a few early studies Egli96Biochem ; Auffinger1997 the potential similarities and differences in hydration effects between proteins and RNA were first pointed out using a combination of quasi-elastic neutron scattering experiments complemented by preliminary simulations Caliskan2006 ; Roh2009 . These and more recent experimental Chen08PRE ; Chu13JPCL and simulation studies on tRNA Roh2009 and hairpin ribozyme Zhang13JPCL have emphasized the role of relaxation of water localized at the surface of RNA in inducing the dynamical transition at .
There are many reasons to undertake a detailed study of the impact of water on the native state fluctuations of RNA. First, in executing many of their functions RNA accesses low lying excitations, which often might involve local melting of bases as a function of temperature. For example, in prokaryotes there are temperature sensitive elements in the 5′ untranslated regions (UTRs) which form base pair with ribosome recognition sites (Shine-Dalgarno sequences) at low temperatures, thus suppressing translation. Recent NMR experiments Rinnenthal10NAR ; Nikolova10RNA suggest that the melting of these strategically located RNA sequences in response to elevation in temperature, needed for initiating translating, involves potential pre-melting of the hydration shell. Second, the versatile functional capacity of RNA can be attributed to their ability to access low free energy conformational excitations, as demonstrated by probing site specific motions in two regulatory forms of RNAs from HIV-1 Zhang06Science . By undergoing such motions on time scales on the order of a few nanoseconds RNA molecules adopt a heterogeneous ensemble of conformations, which poises them to recognize and bind a diverse set of ligands. The key study on RNAs from HIV-1 shows that the ability to access such states on a relatively short time scale shows the ability of RNA to adapt to changing environmental stimuli, and is encoded in the sequence. Thirdly, binding of metabolites to riboswitches to control gene expression is likely linked to local fluctuations in specific regions of co-transcriptionally folded UTR regions of mRNA. In all these examples hydration of RNA is likely to play an important role.
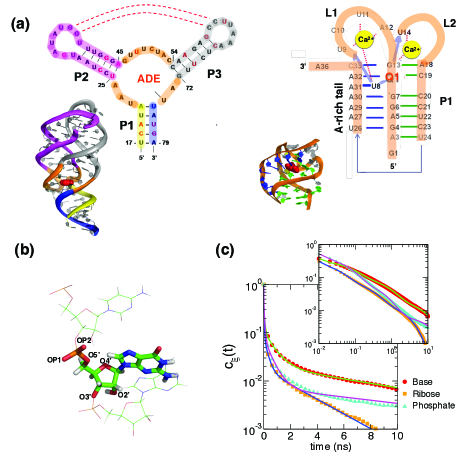
We expect that the unique capacity of a single RNA to change conformations rapidly (plasticity of RNA) should lead to complex solvent dynamics of water Yoon13JACS ; Roh2009 ; Kuhrova14JCTC and counterions WoodsonJMBII01 ; MisraPNAS01 ; Chen09JMB ; kirmizialtin10JPCB ; Kirmizialtin12BJ ; Hayes12JACS that strongly interact with RNA surface. RNA, which has almost an identical chemical composition with DNA except for an additional hydroxyl group in the 2’-position of ribose ring, displays far more complex structure and dynamics than DNA. Unlike double-stranded DNA, characterized with a homogeneous repeat of Watson-Crick base pairs, structures of RNA in native state are highly heterogeneous, which could give rise to a great amount of variations in dynamics of water Caliskan2006 ; Roh2009 and ions WoodsonJMBII01 ; MisraPNAS01 ; Krasovska06BJ ; kirmizialtin10JPCB ; Kirmizialtin12BJ ; Hayes12JACS depending on the location on RNA surface. In order to elucidate this aspect and to establish the “universal” structural basis of, particularly, the water-induced dynamical transition in RNA, we focus our study on water dynamics near RNA using two RNA molecules, purine- Mandal2003Cell ; Mandal2003NSMB ; Serganov2004 ; Winkler2005 ; Cheah2007 ; Montange2008 and preQ1-riboswitches Yoon13JACS . Because the water dynamics at the RNA surface is at least 2 orders of magnitude faster than dynamics of monovalent counterions, water dynamics occurs effectively on a static electrostatic environment. Due to their small size both riboswitch aptamers, containing key structural elements (kissing interactions, non-canonical base pairs, and pseudoknot), are ideal systems to simulate and to address general features of temperature dependent changes in RNA hydration dynamics. Besides usual secondary structural elements such as stack and loop, the purine riboswitch has a three-way junction motif where three helices intersect (Fig.1a, left). Binding of a purine metabolite into the junction motif consolidates these three helices into a compact structure. Similarly, preQ1 ligand and Ca2+ ions forge the preQ1-riboswitch into a compact conformation that adopt H-type pseudoknot in which the nucleobases, composing the main helix (P1), stabilize the adenine-rich 3’-tail via Hoogsteen interaction (Fig.1a, right) Zhang11JACS ; Yoon13JACS .
In this study, we investigate the water dynamics at various locations in the vicinity of folded RNA surface as a function of temperature () in the range of 100 K 310 K using atomically detailed molecular dynamics simulations. To study the relaxation dynamics of water molecules, we computed the number of water hydrogen bonds (HBs) made with each part of RNA structure, and calculated the correlation function to quantify the kinetics and time constant of relaxation () at each temperature. To establish the universality of , we calculated the -dependence of (see Methods) and showed that RNAs also undergo dynamic transition at K. Over the broad range of temperature above the relaxation time of water HB, , obeys the Arrhenius relation, which allows us to extract the corresponding activation energy and attempt frequency for the hydrated water around RNA. The dynamics of water fluctuations near the riboswitches is highly heterogeneous, reminiscent of glass-like behavior, and is suggestive of low free energy of excitations around the putative folded state. By comparing these parameters from the Arrhenius-fit with those of bulk water, we show that there are distinct classes of water molecules (not all waters are the same!) near RNA surface. The heterogeneous behavior of RNA dressed with water molecules, with dynamics in the nanosecond time scale, might have functional importance.
RESULTS & DISCUSSIONS
Population of water and water hydrogen bond on the surface of RNA: Before addressing the hydration dynamics on RNA, we calculated the average number of water molecules coordinating the riboswitch aptamers after equilibrating the entire system composing of RNA and solvent at K. We find that within 3.5 Å from the surface (non-hydrogen heavy atoms) of the purine riboswitch there are on average N water molecules (water oxygens), which corresponds to n waters per nucleotide. For preQ1-riboswitch, N361 and n10.0. These water molecules can be defined as those in the first hydration shell around the aptamers. We find that in our simulations that the hydration level, , defined as the amount of hydrated water in gram per 1 g of RNA, is for the purine riboswitch, and 0.56 for preQ1 riboswitch. The relation indicates that preQ1 riboswitch is more compact than purine riboswitch. The calculated values of are similar to the experimentally measured value for hydrated tRNA () Roh2009 . Thus, generic aspects of hydration dynamics can be inferred from our simulations.
To reveal dynamic features of water near the RNA surface in further detail, we counted the average number of water HBs formed with the riboswitch aptamers. Although there are many ways of defining hydrogen bonds Kumar07JCP , we use a geometric criterion, which is often used to analyze hydrogen bonds in proteins and RNA structures. We assume that a hydrogen-bond is formed when, in addition to the distance criterion ( Å), the angle between the hydrogen donor-acceptor axis and the donor-hydrogen bond (O-H/N-H) is . With this definition, there are N 543 HBs formed between water molecules and the purine-riboswitch during the simulations, which corresponds to n 7.7 water HBs per nucleotide. For preQ1-riboswitch, we find N 252 and n 7.0. Our previous simulations of tRNAPhe Roh2009 , whose size is comparable to add-riboswitch, showed a similar value for the number.
We find that the formation of HB with RNA is heterogeneous. In particular, the propensity to make H-bond with water varies depending on the position of a given atom in the nucleotide.
In the native state,
(i) the O1P and O2P atoms of phosphate group (Fig. 1b), which are the most exposed parts of the nucleotide to the solvent, form about hydrogen
bonds with water molecules.
(ii) In most of the residues, atoms O3’, O4’, and O5’ in the ribose group are less solvent accessible, and form only about 0.5, 0.5, and 0.3 HBs, respectively, whereas O2’ atoms form HB with water hydrogens (Fig.1b).
(iii) In the base groups, unprotonated nitrogen and oxygen (N/O) atoms form about 0.5-1 HB with water hydrogens,
but the protonated nitrogen and oxygen (NH/OH) form HBs with water oxygen.
As expected, the average number of HBs with water for protonated sites are smaller than unprotonated sites
because many protonated sites participate in the formation of base pairs.
Kinetics of water hydrogen bond near RNA surface: The abundance of water molecules around phosphate group is easily anticipated because phosphate groups are not only negatively charged, but are also the most exposed to the solvent environment in both the native and unfolded states. Thus, it may be tempting to conclude that the residence time of water molecules near phosphate groups should be longer than ribose or base groups. However, our simulations show that water dynamics around RNA is considerably more complicated reflecting complex structure of RNA. Surprisingly, it turns out that instead of phosphate groups, water exhibits the slowest relaxation dynamics near bases. To elucidate the complex water dynamics near the surface of RNA, we quantify the relaxation dynamics of the number of water HBs as a function of time using the time correlation function () (see Methods).
As shown in Fig.1c, the relaxation kinetics of water HB at K with different nucleotide groups (B:base, R:ribose, P:phosphate) of purine riboswitch aptamer can be described using a multi-exponential function with , B, R, and P. (It is possible to fit using stretched exponential function. However, we find that depending on the fit might require more than one stretched exponential function, making the interpretation difficult.) The multi-phasic kinetics implies that various types of interactions with distinct time scales govern the dynamics of water molecules with nucleotides. In Fig.1c, up to the 99.9 % of the decay of can be described with N=4. Among the four phases, the time scales of relaxation and the corresponding weights satisfy an inequality with . The values of , satisfying and ps, indicate that most of water H-bond dynamics ( 90 %) occur on the time scale of ps. The correlation function (or survival probability) of water H-bonds drops below when time is greater than 100 ps. At short times ( ps), hydrogen bonding of phosphate groups with water has a longer relaxation time than that of ribose or base with water, but at longer times ( ps) slow water dynamics is dominated by water molecules trapped near base and ribose although such contribution is made by less than 10 % of the hydrated water population. From , the average lifetime of water H-bond at each group is calculated as ps, ps, and ps. It is worth emphasizing that the lifetime of water H-bond with base group is twice longer than that with ribose or phosphate group. Compared with the lifetime of HBs in bulk water ( ps) at 310 K (see Fig.4c), the overall relaxation time of hydrogen bonds between nucleotides and water is orders of magnitude longer, which suggests that the slow dynamics of water near RNA is due to stronger interactions with the nucleotide or reduced diffusion constant of water on the RNA surface. Although counterions also play a central role in modulating RNA structure kirmizialtin10JPCB ; Kirmizialtin12BJ ; Hayes12JACS and binding or release dynamics of Na+ ions at the surface of RNA would certainly perturb the water environment, the time scales of such events are far slower than the time scale of hydration. The relaxation time of counterion dynamics at the surface of RNA is ns, ns, and ns, which are more than two orders of magnitude slower than that of water molecules, the details of which we will report elsewhere. Due to the large time scale separation between water and ion dynamics, the hydration dynamics around RNA is expected to occur effectively in a static quenched counterion environment.
The hierarchy of time scales needed to describe the slow hydration dynamics is reminiscent of glassy dynamics. As stated above, it is also possible to fit the relaxation data using stretched exponential.
Nevertheless, the multi-phasic kinetics, originating from the heterogeneity of conformations that RNA samples on fast time time scales facilitated by water (acting as a lubricant), should be distinguished from glass-like behavior in highly supercooled materials at low temperatures (see below, Fig.4).
At =310 K, we show that the majority (90 %) of water HB dynamics are well described by considering double exponential function with two distinct time scales.
Just like proteins Williams94ProtSci ; Tarek00BJ , water molecules interacting with RNA exist in diverse forms, which leads to a broad temporal scale in dynamics.
Based on the well-separated time scales describing the decay of we classify water molecules into
bulk ( ps),
surface ( ps),
cleft ( ps),
and
buried water ( ps) denisov1997JPCB groups.
Hydrogen bond dynamics varies in different RNA regions: For adenine riboswitch we performed a similar analysis of HB relaxation dynamics by focusing on the paired helices P1, P2, P3 and the junction region (Fig.1a left). The relaxation kinetics of hydrogen bond at K can be quantitatively fit using,
| (1) |
where is in the unit of ps, which gives
ps, ps, ps, and ps.
Longer lifetime of water H-bond kinetics in the junction region (, , ) implies a greater population of water molecules trapped around the junction region, which is stabilized by the three helices through binding of the purine metabolite.
Due to the stronger electrostatic potential and the extent of water molecules being buried at the junction where the three helices meet, the dynamics of waters at the junction are less dynamic than on the paired helices.
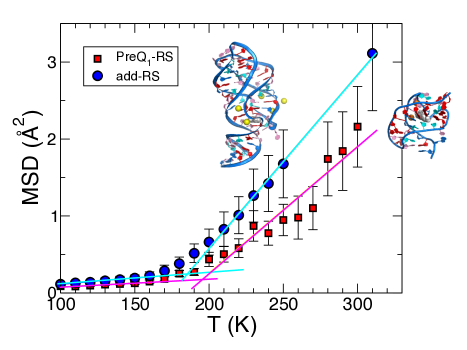
Dynamical Transition of RNA at around 200 K: A number of studies have confirmed the existence of dynamic transition of proteins at K, above which the temperature response of of proteins changes from harmonic to anharmonic Fitter1996PNAS ; oostenbrink04JCC ; Reat2000PNAS . Similarly, starting with our early studies it is now known that RNA molecules also undergo a similar transition at . It is likely that the transition in RNA is induced by the solvent Caliskan2006 ; Zhang13JPCL although there are differences in the dependence of on the extent of hydration (). In order to establish the universality of the previous findings, established for tRNA, we calculated MSD of hydrogen atom using the time scale of 0.1 ns for both purine- and preQ1 riboswitches. In accord with the previous study using t-RNA Caliskan2006 , our simulations also confirm that the dynamical transition at (Fig.2). At low temperature range ( K), MSD for both riboswitches increase almost linearly with the identical amplitude, but there is an onset of deviation between the two MSDs at K. The amplitude of MSD for purine riboswitch (71 nt) is larger than that of preQ1 riboswitch (36 nt), which is consistent with an expectation of .
The harmonic-to-anharmonic transition of MSD in response to an increasing temperature is reminiscent of the interpretation for proteins that the folded protein samples alternate conformations in the rugged free energy landscape
Fenimore02PNAS . In the case of RNAs, it is well known that their folding landscape is rough implying that there are easily accessible (on the time scale of nanoseconds) excitations around the native state Thirum05Biochem . Thus, it is likely that the mobility of the water molecules in the vicinity of the RNA surface at enables structural relaxation Auffinger02BiophysChem .
Recent experimental studies using dielectric and two-dimensional infrared spectroscopies that directly probe both the hydration and protein dynamics provide evidence that protein dynamics is slaved to the surrounding solvent environment king2012JACS ; Khodadadi2011JPCB .
For proteins, the structural interpretation of the change in dynamics at has been controversial with some ascribing it to the rotational motion of methyl group lee2001Nature , while others argue that it is due to solvent dynamics.
In contrast to the dynamics of proteins, the situation in RNA is simpler. Nucleic acids do not contain methyl groups, and hence it does not seem plausible that the change in the dynamics at is mediated solely by structural transition in RNA. It is likely that the dynamical transition RNA is “induced” by a change in water dynamics Caliskan2006 .
The hypothesis that the dynamical transition of both protein and RNA is water-induced is also supported by the observation that the H-bond relaxation time of bulk water undergoes dynamic transition at K, which is comparable to the dynamic transition temperature of surface water (Fig.4c, see below).
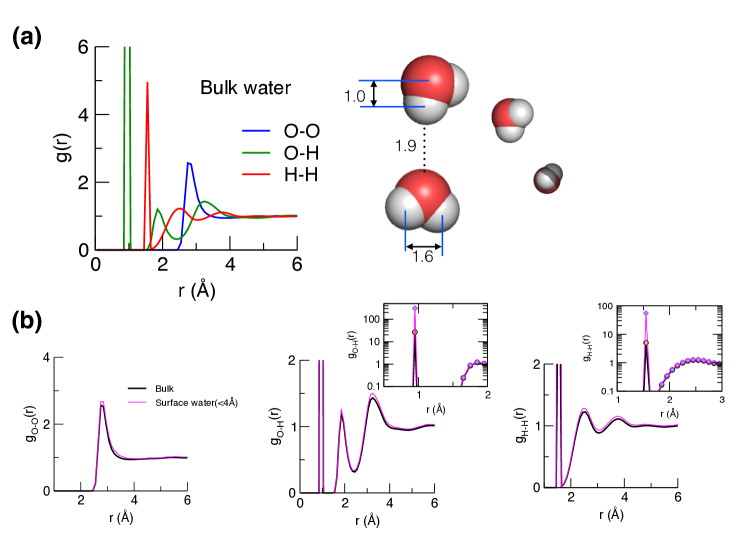
Enhanced ordering of surface water:
Even at K, compared with radial distribution function (RDF) of bulk water, the first peaks of surface water O-H and H-H RDFs display significantly sharpened peaks (Fig.3),
suggesting that there is an enhanced ordering in the surface water.
The first peaks of surface water RDF, corresponding to the intramolecular bond and geometry of water (O-H and H-H), have an order of magnitude greater amplitude than those of bulk water (Fig.3b), whereas the first peak of O-O pair distribution, which is due to purely intermolecular interactions with bulk water molecules, has almost no difference.
The enhanced ordering of surface water is due to stronger interaction with specific atoms on the RNA surface resulting in suppression of the fluctuations of water molecule directly coordinated to the nucleotides. This static picture of water RDF with sharpened peak, is indicative of the enhanced ordering of surface water molecule, also manifests itself in the water dynamics near the surface (see below).
Heterogeneity of water dynamics on RNA surface: Electrostatic potential (Fig.4a) calculated on the solvent accessible RNA surface reveals that charge balance on RNA surface is heterogeneous, which should result in the dynamics of hydrated water varying depending on the local structure of RNA. Using the native structure of preQ1-riboswitch aptamer and the electrostatic potential calculated by numerically solving nonlinear Poisson Boltzmann equation in 150 mM-monovalent salt condition as a reference (Fig.4a), we probe the water dynamics around 24U, 29A, 33C and 35A. In 29A and 33C, the phosphate groups, fully exposed to the solvent environment, have a small electrostatic potential at the water-contacting surface due to screening by counterions. The base groups are hidden deep inside the neighboring base-stacks, and are not easily accessible to the solvent. In 24U and 35A, the base groups are accessible to the solvent although the base group of 35A is located in the interior of the pocket formed with the L1 loop Yoon13JACS , and hence has high negative charge (Fig.4a). By studying the relaxation dynamics around these nucleotides with differing local environment, we establish that water dynamics is heterogeneous.
Fig.4b shows the correlation function () of water HB in the bulk (left) and around 35A (right) at various temperatures. Similar to the calculated for B, R, P group of nucleotides at , both in the bulk and near the nucleotides 35A and 33C are well described by multi-phasic kinetics, i.e., . For water hydrogen-bond both in the bulk and near 35A and 33C, at high temperature, population of fast dynamics is dominant, but as temperature decreases the influence of slow dynamics grows (see Appendix and Fig.A1 for the bulk water and the caption of Fig.4 for the waters near 35A and 33C).
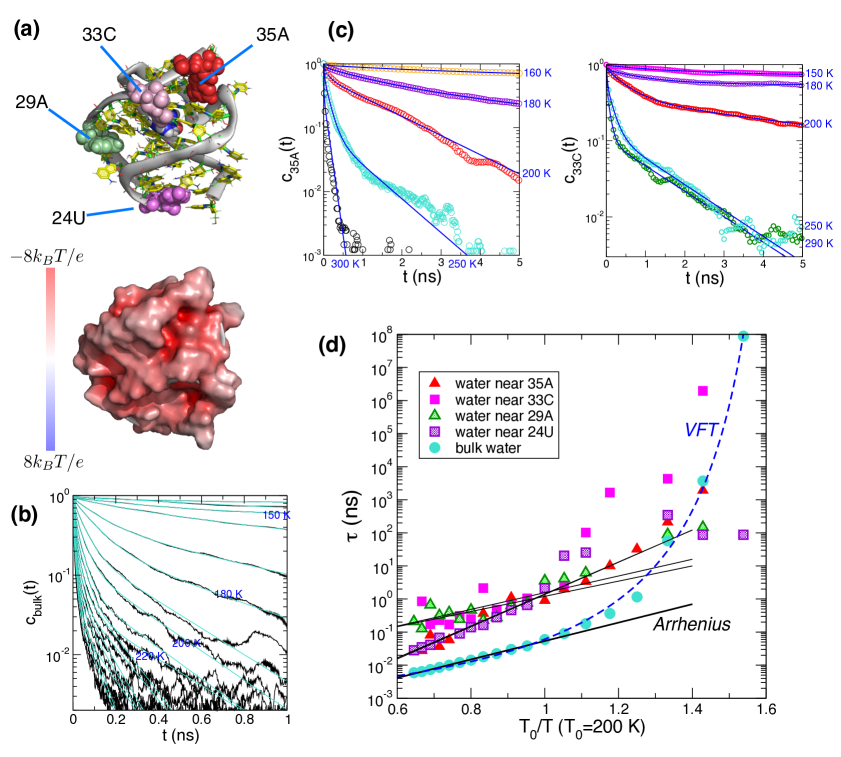
Dynamics of bulk water: Aside from the water dynamics near the surface of biopolymers, dynamical behavior of bulk water as a function of temperature is also a complex topic. Thus, it would be useful to discuss the bulk water property prior to discussing the behavior surface water. The correlation times of HB for supercooled water in the bulk are described either with multi-phasic kinetics up to % of the population (the left panel on the Fig.4b) or conventionally with stretch exponentials Gallo1996PRL . The time scale for the slow relaxation mode reaches ps at K. The water dynamics, governed by short time dynamics ( ps), is most dominant at high temperature, K (see APPENDIX), but the anomalies of water dynamics, characterized by long relaxation times, are further amplified as temperature is decreased. This observation signifies that motions of water is governed by very different types of phenomenology depending on the time scale of observation, such as short-time free diffusion, intermediate dynamics due to cage effect, followed by long-time free diffusion. It is noteworthy that even at low temperatures the contribution of fast relaxation mode ( ps), which could be considered as the bulk water property at high temperatures, does not completely vanish but still remains finite at relatively long times.
As long as K, when the average relaxation time of water HB () is calculated using , the dependence of on the inverse temperature () can be described using “Arrhenius-like” kinetics (Fig.4c). The linear regression using , made for the data points with K, i.e., , results in with and ps. Of particular note is that the value of is similar to Eyring’s transition theory estimate ps EyringJCP35 . The HB relaxation time of supercooled water can be described over the entire temperature range ( K) by using the Vogel-Fulcher-Tamman (VFT) equation often used to analyze temperature dependence of shear viscosity in glass forming materials. When the vs plot for bulk water is fitted to Vogel-Fulcher-Tammann (VFT) equation, (dashed line in Fig.4c), we obtain , , and ps. The small value of suggests that bulk water may be a strong liquid at low temperatures.
Dynamics of surface water: Compared with bulk water, the dynamics of water molecules near RNA is slower by 1-2 orders of magnitude in the studied temperature range (Figs.4b, c). Water molecules hydrated near RNA surface, however, also have a hierarchical structure in dynamical property (Fig.4). At K, the water HB dynamics is well fit using , suggesting that the water HB dynamics is governed by the time scale of ps with the contribution from bulk water-like property being only %. It would be more appropriate to interpret the hydrated water near RNA surface with longer time scale by using, RNA structure-dependent description such as, “surface”, “cleft”, and “buried”-water instead of “cage effect” in supercooled water in the bulk. As temperature is decreased, the contribution of the “bulk”-water ( ps) diminishes and the contributions from “surface”, “cleft”, and “buried”-water becomes more dominant in the population of water interacting with RNA.
The relaxation dynamics of HB for surface water can also be analyzed using Arrhenius equation over the temperature range K (Fig.4c): (i) suggests that the activation energies associated with breaking water H-bond from 24U and 35A are twice larger than those associated with 29A, 33C or bulk waters; (ii) Each class of , , ps) and , ( ps) has the time constant in a similar range. Note that 24U and 35A have a base group accessible to the solvent environment, while 29A and 33C do not. The similarity of time constants of 24U and 35A with that of the bulk water indicates that the diffusional property of water interacting with 24U and 35A are effectively identical to that of bulk water. Therefore, the above analysis allows us to divide the water dynamics near RNA at least into two classes. One is the class in which activation barrier for water HB disruption is increased but the time constant for vibration remains identical to bulk water (water around 24U, 35A); the other is the class in which activation barrier remains identical but the time constant for vibration is reduced by two orders of magnitude from that of bulk water (water around 29A, 33C).
CONCLUDING REMARKS
Despite fundamental difference between the chemical composition of RNA and proteins (for example RNA with limited chemical diversity in the nucleotides is highly charged along the phosphodiester backbone whereas there is considerable diversity in the makeup of natural protein sequences), we find that globally there are some similarities in the hydration dynamics in these biopolymers. Similar to proteins, RNA displays a dynamical transition signaling a harmonic-to-anharmonic change in the MSD at the near universal dynamical temperature, K. This near universal value for suggests that the dynamical transition has more to do with solvent dynamics than with any conformational fluctuations associated with RNA or protein, as this study and others previously have surmised Tournier03BiophysJ ; Caliskan2006 .
Water molecules interacting with RNA surface exhibit a broad spectrum of time scales, reflecting the underlying architecture of the folded RNA. At the ambient temperature, dynamics of bulk water occurs on the time scale of ps as assessed in terms of hydrogen bond formation and disruption Luzar96PRL . In sharp contrast, near RNA surface the time scale of water HB with nucleotides exceeds ps. Although bulk and surface water molecules constitute the major population near RNA surface, there is non-negligible population of water molecules whose time scale of interaction with nucleotide extends beyond nsec. From the simulation trajectories we find that these water molecules are either trapped in the narrow space formed between base-base stack, coordinated with multiple phosphate oxygens simultaneously or with specifically bound multivalent counterions Allner2012JCTC . Fluctuations in these regions, which clearly require coordinated motion of several water molecules, must play an important role in ligand recognition by RNA, as suggested by NMR experiments Zhang06Science . We classify these as functional water molecules because the dynamics associated with these discrete waters might be responsible for the motions identified in experiments Rinnenthal10NAR ; Nikolova10RNA .
Our focus here was restricted to the elucidation of very slow dynamics associated with surface waters and those discrete molecules in the cleft of RNA, which remains folded. An intriguing question is: what role do these water molecules play in the folding process? It is known that the persistence length of RNA decreases dramatically as RNA folds Caliskan05PRL ; Roh11JACS . This implies that the ordered state of RNA is more flexible than the unfolded state, which is drastically different compared to proteins. Based on the present study, we speculate that in the unfolded state, with exposed phosphate and bases, the dynamics of water associated with RNA is also slow, perhaps even more so than when RNA is folded. In this case, we expect that water molecules have to disorder to some extent before ions can stabilize the folded state. Thus, in the folding of RNA water molecules should exhibit rich dynamics.
The dynamics of nucleic acids spans far greater time scales than proteins. Consequently, over a period of time RNA samples a larger class of conformations with ease because of the small stability gap Thirum05Biochem separating the folded states and alternate structures. As a result it is likely that RNA, even in the functional state, exhibits persistent heterogeneity or molecule-to-molecule variations AlHashimi08COSB ; Solomatin10Nature ; Hyeon2012NatureChem . It is plausible that in conjunction with ion dynamics, temporal scale spanned by water in association with RNA also stretches out over many orders of magnitude. If this were the case then discrete water molecules whose motions are coordinated with RNA structural transitions might be involved in function as well.
Structural motions lubricated by the discrete water molecules associated with RNA are pivotal in facilitating molecular interactions with cosolvents as well as with ligands or metabolites. Recently, we showed that water molecules are critical for “inducing” the base pair fluctuations, so that urea molecule can interact more easily with nucleobases Yoon13JACS . In the absence of surface water, the urea concentration required for denaturing nucleic acids rises to as high as 10 M Herskovits63Biochemistry . Similarly, dehydration of water around RNA due to stabilizing osmolytes such as TMAO involves interplay of interactions between water and cosolvents Denning13BiophysChem . These aspects are worthy of future investigations.
METHODS
All-atom Molecular Dynamics (MD) Simulation: We used the molecular dynamics package NAMD Philips2005 to perform atomically detailed simulations for the 71-nt adenine riboswitch (PDB code: 1Y26) Serganov2004 and 36-nt preQ1 riboswitch (PDB code: 2L1V) Yoon13JACS aptamers under CHARMM27 force field. For adenine riboswitch containing five bound Mg2+ ions, we added 60 sodium ions by placing each ion around the phosphate group of RNA backbone, to make the whole system charge neutral. The system is then solvated using the SOLVATE program in the VMD package Humphrey1996 in an explicit TIP3P water solvent box. A buffer of water are added around the molecule for at least 15 Å in all directions, resulting in total 63,632 atoms in the system. PreQ1 riboswitch is solvated in a 60 Å 60 Å 60 Å box containing 6267 TIP3P water. To neutralize the charges on the phosphates and the two Ca2+-bound to the aptamer we placed 51 Na+ and 20 Cl- ions, which results in 150 mM salt concentration in the bulk, randomly in the box. The resulting system was equilibrated as described elsewhere Yoon13JACS . Non-bonded interactions are smoothly switched to zero between 10 and 12 Å yielding a cutoff radius of 12 Å. The systems are periodically replicated. The particle-mesh Ewald algorithm is used for treating long-range electrostatic interactions with a grid spacing smaller than 1 Å Darden1993 . The integration time step is 2 fs with the SHAKE method being used Ryckaert1977 . The energy of the system is first minimized and gradually heated to the desired temperature. We generated a ns production run at each temperature under constant , , and conditions.
Despite inaccuracies (especially for divalent cations such as Mg2+) in the current force field for nucleic acids Allner2012JCTC ; Chen13PNAS , our simulation and analysis on hydration dynamics show semi-quantitative agreements with experimental measurements. Our conclusion on water dynamics near RNA surface as well as at the bulk still holds.
Mean square displacement or fluctuation of hydrogen atoms: The operational definition of is,
| (2) |
where is the position of -th hydrogen atom, is the total number of hydrogen atoms in a molecule, is the length of trajectory, and is the time interval used to compute the MSD.
Correlation function to probe water hydrogen-bond kinetics: To probe the dynamics of water HB at the surface of RNA quantitatively, we calculate the correlation function defined as follows Chandler1996
| (3) |
The function describes whether a HB is formed between
an atom in RNA and a water molecule at time .
If a HB is formed, the value of is 1, otherwise, .
The symbol , which is explicitly written in the second line, denotes a time average along the trajectory and an ensemble average over the number of HBs () we are interested in.
The correlation function corresponds to the survival probability of the HB at time
, given that it is intact at time 0.
Acknowledgements: C.H. thanks Korea Institute for Advanced Study for providing computation resources. D.T. acknowledges a grant from the National Science Foundation (CHE 09-10433).
APPENDIX
For completeness we analyzed the relaxation kinetics of hydrogen bonds of water in the bulk. Tri-exponential function fits at various temperatures to the hydrogen-bond dynamics of bulk water in Fig.4b. In the correlation functions below the time is in ps unit.
,
,
,
,
,
,
,
,
,
,
,
,
,
,
,
,
,
,
.

References
- (1) Dickerson, R. E.; Drew, H. R.; Conner, B. N.; Wing, R. M.; Fratini, A. V.; Kopka, M. L.; The anatomy of A-, B-, and Z-DNA; Science 1982, 216, 475–485.
- (2) Doster, W.; Cusack, S.; Petry, W.; Dynamical transition of myoglobin revealed by inelastic neutron scattering; Nature 1989, 337, 754–756.
- (3) Rupley, J. A.; Careri, G.; Protein hydration and function; Adv. Protein Chem. 1991, 41, 37–172.
- (4) Daniel, R. M.; Dunn, R. V.; Finney, J. L.; Smith, J. C.; The role of dynamics in enzyme activity; Annu. Rev. Biophys. biomol. Struct. 2003, 32, 69–92.
- (5) Roh, J. H.; Curtis, J. E.; Azzam, S.; Novikov, V. N.; Peral, I.; Chowdhuri, X.; Gregory, R. B.; Sokolov, A. P.; Influence of hydration on the dynamics of lysozyme; Biophys. J. 2006, 91, 2573–2588.
- (6) Caliskan, G.; Briber, R. M.; Thirumalai, D.; Garcia-Sakai, V.; Woodsen, S. A.; Sokolov, A. P.; Dynamics transition in tRNA is solvent induced; J. Am. Chem. Soc. 2006, 128, 32–33.
- (7) Roh, J. H.; Briber, R. M.; Damjanovic, A.; Thirumalai, D.; Woodsen, S. A.; Sokolov, A. P.; Dynamics of tRNA at different levels of hydration; Biophys. J. 2009, 96, 2755–2762.
- (8) Fitter, J.; Lechner, R.; Buldt, G.; Dencher, N.; Internal molecular motions of bacteriorhodopsin: hydration-induced flexibility studied by quasielastic incoherent neutron scattering using oriented purple membranes; Proc. Natl. Acad. Sci. U.S.A. 1996, 93(15), 7600–7605.
- (9) Réat, V.; Dunn, R.; Ferrand, M.; Finney, J. L.; Daniel, R. M.; Smith, J. C.; Solvent dependence of dynamic transitions in protein solutions; Proc. Natl. Acad. Sci. U.S.A. 2000, 97(18), 9961–9966.
- (10) Tsai, A. M.; A.Neumann, D.; Bell, L. N.; Molecular Dynamics of Solid-State Lysozyme as Affected by Glycerol and Water: A Neutron Scattering Study; Biophys. J. 2000, 79, 2728–2732.
- (11) Rasmussen, B. F.; Stock, A. M.; Ringe, D.; Petsko, G. A.; Crystalline ribonuclease A loses function below the dynamical transition at 220 K; Nature 1992, 357, 423 – 424.
- (12) Tao, N.; Lindsay, S.; Rupprecht, A.; Structure of dna hydration shells studied by raman spectroscopy; Biopolymers 1989, 28(5), 1019–1030.
- (13) Denisov, V. P.; Carlström, G.; Venu, K.; Halle, B.; Kinetics of DNA hydration; J. Mol. Biol. 1997, 268(1), 118–136.
- (14) Endres, R. G.; Cox, D. L.; Singh, R. R. P.; Colloquium: The quest for high-conductance DNA; Rev. Mod. Phys. 2004, 76, 195–214.
- (15) Egli, M.; Portmann, S.; Usman, N.; RNA hydration: a detailed look; Biochemistry 1996, 35(26), 8489–8494.
- (16) Auffinger, P.; Westhof, E.; RNA hydration: Three nanoseconds of multiple molecular dynamics simulations of the solvated tRNA anticoden hairpin; J. Mol. Biol. 1997, 269, 326–341.
- (17) Chu, X.-Q.; Fratini, E.; Baglioni, P.; Faraone, A.; Chen, S.-H.; Observation of a dynamic crossover in rna hydration water which triggers a dynamic transition in the biopolymer; Phys. Rev. E. 2008, 77(1), 011908.
- (18) Chu, X.-Q.; Mamontov, E.; O’Neill, H.; Zhang, Q.; Temperature dependence of logarithmic-like relaxational dynamics of hydrated trna; J. Phys. Chem. Lett. 2013, 4(6), 936–942.
- (19) Zhang, H.; Khodadadi, S.; Fiedler, S. L.; Curtis, J. E.; Role of Water and Ions on the Dynamical Transition of RNA; J. Phys. Chem. Lett. 2013, 4(19), 3325–3329.
- (20) Rinnenthal, J.; Klinkert, B.; Narberhaus, F.; Schwalbe, H.; Direct observation of the temperature-induced melting process of the Salmonella fourU RNA thermometer at base-pair resolution; Nucleic Acids Research 2010, 38(11), 3834–3847.
- (21) Nikolova, E. N.; Al-Hashimi, H. M.; Thermodynamics of RNA melting, one base pair at a time; RNA 2010, 16(9), 1687–1691.
- (22) Zhang, Q.; Sun, X.; Watt, E. D.; Al-Hashimi, H. M.; Resolving the motional modes that code for rna adaptation; Science 2006, 311(5761), 653–656.
- (23) Yoon, J.; Thirumalai, D.; Hyeon, C.; Urea-induced denaturation of preQ1-riboswitch; J. Am. Chem. Soc. 2013, 135, 12112–12121.
- (24) Kührová, P.; Otyepka, M.; Sponer, J.; Banas, P.; Are Waters around RNA More than Just a Solvent?–An Insight from Molecular Dynamics Simulations; J. Chem. Theor. Comp. 2013, 10(1), 401–411.
- (25) Heilman-Miller, S. L.; Pan, J.; Thirumalai, D.; Woodson, S. A.; Role of Counterion Condensation in Folding of Tetrahymena Ribozyme II. Counterion-dependence of Folding Kinetics; J. Mol. Biol. 2001, 309, 57–68.
- (26) Misra, V. K.; Draper, D. E.; A thermodynamic framework for Mg2+ binding to RNA; Proc. Natl. Acad. Sci. U.S.A. 2001, 98(22), 12456–12461.
- (27) Chen, A. A.; Draper, D. E.; Pappu, R. V.; Molecular simulation studies of monovalent counterion-mediated interactions in a model RNA kissing loop; J. Mol. Biol. 2009, 390(4), 805–819.
- (28) Kirmizialtin, S.; Elber, R.; Computational exploration of mobile ion distributions around RNA duplex; J. Phys. Chem. B 2010, 114(24), 8207–8220.
- (29) Kirmizialtin, S.; Pabit, S. A.; Meisburger, S. P.; Pollack, L.; Elber, R.; RNA and its ionic cloud: solution scattering experiments and atomically detailed simulations; Biophys. J. 2012, 102(4), 819–828.
- (30) Hayes, R. L.; Noel, J. K.; Mohanty, U.; Whitford, P. C.; Hennelly, S. P.; Onuchic, J. N.; Sanbonmatsu, K. Y.; Magnesium fluctuations modulate RNA dynamics in the SAM-I riboswitch; J. Am. Chem. Soc. 2012, 134(29), 12043–12053.
- (31) Krasovska, M. V.; Sefcikova, J.; Réblová, K.; Schneider, B.; Walter, N. G.; Šponer, J.; Cations and hydration in catalytic RNA: molecular dynamics of the hepatitis delta virus ribozyme; Biophys. J. 2006, 91(2), 626–638.
- (32) Mandal, M.; Boes, B.; Barrick, J. E.; Winkler, W. C.; Breaker, R. R.; Riboswitches control fundamental biochemical pathways in Bacillus subtilis and other bacteria; Cell 2003, 113, 577–586.
- (33) Mandal, M.; Breaker, R. R.; Adenine riboswitches and gene activation by disruption of a transcription terminator; Nat. Struct. Mol. Biol. 2003, 11, 29–35.
- (34) Serganov, A.; Yuan, Y. T.; Pikovskaya, O.; Polonskaia, A.; Malinina, L.; Phan, A. T.; Hobartner, C.; Micura, R.; Breaker, R. R.; Patel, D.; Structural basis for discriminative regulation of gene expression by adenine- and guanine-sensing mRNAs; J. Chem. Biol. 2004, 11, 1729–1741.
- (35) Winkler, W. C.; Breaker, R. R.; Regulation of bacterial gene expression by riboswitches; Annu. Rev. Microbiol. 2005, 59, 487–517.
- (36) Cheah, M. T.; Wachter, A.; Sudarsan, N.; Breaker, R. R.; Control of alternative RNA splicing and gene expression by eukaryotic riboswitches; Nature 2007, 447, 497–500.
- (37) Montange, R. K.; Batey, R. T.; Riboswitches: emerging themes in RNA structure and function; Annu. Rev. Biophys. 2008, 37, 117–133.
- (38) Zhang, Q.; Kang, M.; Peterson, R. D.; Feigon, J.; Comparison of Solution and Crystal Structures of PreQ1 Riboswitch Reveals Calcium-Induced Changes in Conformation and Dynamics; J. Am. Chem. Soc. 2011, 133, 5190–5193.
- (39) Kumar, R.; Schmidt, J. R.; Skinner, J. L.; Hydrogen bonding definitions and dynamics in liquid water; J. Chem. Phys. 2007, 126, 204107.
- (40) Williams, M. A.; Goodfellow, J. M.; Thornton, J. M.; Buried waters and internal cavities in monomeric proteins; Protein Sci. 1994, 3, 1224–1235.
- (41) Tarek, M.; Tobias, D. J.; The Dynamics of Protein Hydration Water: A Quantitative Comparison of Molecular Dynamics Simulations and Neutron-scattering Experiments; Biophys. J. 2000, 79, 3244–3257.
- (42) Denisov, V. P.; Venu, K.; Peters, J.; Hörlein, H. D.; Halle, B.; Orientational disorder and entropy of water in protein cavities; J. Phys. Chem. B. 1997, 101(45), 9380–9389.
- (43) Oostenbrink, C.; Villa, A.; Mark, A.; Van Gunsteren, W.; A biomolecular force field based on the free enthalpy of hydration and solvation: The GROMOS force-field parameter sets 53A5 and 53A6; J. Comp. Chem. 2004, 25(13), 1656–1676.
- (44) Fenimore, P. W.; Frauenfelder, H.; McMahon, B. H.; Parak, F. G.; Slaving: solvent fluctuations dominate protein dynamics and functions; Proc. Natl. Acad. Sci. U.S.A. 2002, 99(25), 16047–16051.
- (45) Thirumalai, D.; Hyeon, C.; RNA and Protein folding: Common Themes and Variations; Biochemistry 2005, 44(13), 4957–4970.
- (46) Auffinger, P.; Westhof, E.; Melting of the solvent structure around a RNA duplex: a molecular dynamics simulation study; Biophys. Chem. 2002, 95(3), 203–210.
- (47) King, J. T.; Kubarych, K. J.; Site-specific coupling of hydration water and protein flexibility studied in solution with ultrafast 2D-IR spectroscopy; J. Am. Chem. Soc. 2012, 134(45), 18705–18712.
- (48) Khodadadi, S.; Curtis, J.; Sokolov, A. P.; Nanosecond relaxation dynamics of hydrated proteins: Water versus protein contributions; J. Phys. Chem. B. 2011, 115(19), 6222–6226.
- (49) Lee, A. L.; Wand, A. J.; Microscopic origins of entropy, heat capacity and the glass transition in proteins; Nature 2001, 411(6836), 501–504.
- (50) Gallo, P.; Sciortino, F.; Tartaglia, P.; Chen, S.-H.; Slow dynamics of water molecules in supercooled states; Phys. Rev. Lett. 1996, 76(15), 2730.
- (51) Eyring, H.; The activated complex in chemical reactions; J. Chem. Phys. 1935, 3, 107–115.
- (52) Tournier, A.; Xu, J.; Smith, J.; Translational hydration water dynamics drives the protein glass transition; Biophys. J. 2003, 85, 1871–1875.
- (53) Luzar, A.; Chandler, D.; Effect of environment on hydrogen bond dynamics in liquid water; Phys. Rev. Lett. 1996, 76, 928–931.
- (54) Allnér, O.; Nilsson, L.; Villa, A.; Magnesium ion–water coordination and exchange in biomolecular simulations; J. Chem. Theory Compt. 2012, 8(4), 1493–1502.
- (55) Caliskan, G.; Hyeon, C.; Perez-Salas, U.; Briber, R. M.; Woodson, S. A.; Thirumalai, D.; Persistence Length Changes Dramatically as RNA Folds; Phys. Rev. Lett. 2005, 95, 268303.
- (56) Roh, J. H.; Tyagi, M.; Briber, R. M.; Woodson, S. A.; Sokolov, A. P.; The Dynamics of Unfolded versus Folded tRNA: The Role of Electrostatic Interactions; J. Am. Chem. Soc. 2011, 133, 16406–16409.
- (57) Al-Hashimi, H.; Walter, N.; RNA dynamics: it is about time; Curr. Opin. Struct. Biol. 2008, 18(3), 321–329.
- (58) Solomatin, S. V.; Greenfeld, M.; Chu, S.; Herschlag, D.; Multiple native states reveal persistent ruggedness of an RNA folding landscape; Nature 2010, 463, 681–684.
- (59) Hyeon, C.; Lee, J.; Yoon, J.; Hohng, S.; Thirumalai, D.; Hidden complexity in the isomerization dynamics of holliday junctions; Nature Chem. 2012, 4, 907–914.
- (60) Herskovits, T. T.; Nonaqueous Solutions of DNA; Denaturation by Urea and Its Methyl Derivatives; Biochemistry 1963, 2(2), 335–340.
- (61) Denning, E. J.; Thirumalai, D.; MacKerell Jr, A. D.; Protonation of trimethylamine N-oxide (TMAO) is required for stabilization of RNA tertiary structure; Biophys. Chem. 2013, 184, 8–16.
- (62) Philips, J. C.; Braun, R.; Wang, W.; Gumbart, J.; Tajkhorshid, E.; Villa, E.; Chipot, C.; Skeel, R. D.; Kale, L.; Schulten, K.; Scalable molecular dynamics with NAMD; J. Comp. Chem. 2005, 26, 1781–1802.
- (63) Humphrey, W.; Dalke, A.; Schulten, K.; VMD: visual molecular dynamics; J. Mol. Graphics 1996, 14, 33–38.
- (64) Darden, T.; York, D.; Pedersen, L.; Particle mesh Ewald: An method for Ewald sums in large systems; J. Chem. Phys. 1993, 98(12), 10089–10092.
- (65) Ryckaert, J.-P.; Ciccotti, G.; Berendsen, H. J.; Numerical integration of the cartesian equations of motion of a system with constraints: molecular dynamics of -alkanes; J. Comp. Phys. 1977, 23(3), 327–341.
- (66) Chen, A. A.; García, A. E.; High-resolution reversible folding of hyperstable RNA tetraloops using molecular dynamics simulations; Proc. Natl. Acad. Sci. U.S.A. 2013, 110(42), 16820–16825.
- (67) Luzar, A.; Chandler, D.; Hydrogen-bond kinetics in liquid water; Nature 1996, 379, 55–57.
- (68) Baker, N. A.; Sept, D.; Joseph, S.; Holst, M. H.; McCammon, J. A.; Electrostatics of Nanosystems: Application to microtubules and the ribosome; Proc. Natl. Acad. Sci. U.S.A. 2001, 102, 13070–13074.