Robustness of determination at intermediate redshifts
Abstract
The most recent Hubble constant ( estimates from local methods (), km s-1 Mpc-1, and the one from high redshifts km s-1 Mpc-1, are discrepant at confidence level. Within this context, Lima & Cunha (LC) derived a new determination of using four cosmic probes at intermediate redshifts () based on the so-called flat CDM model. They obtained km s-1 Mpc-1, in full agreement with local measurements. In this Letter, we explore the robustness of the LC result searching for systematic errors and its dependence from the cosmological model used. We find that the value from this joint analysis is very weakly dependent on the underlying cosmological model, but the morphology adopted to infer the distance to galaxy clusters changes the result sizeably, being the main source of systematic errors. Therefore, a better understanding of the cluster morphology is paramount to transform this method into a powerful cross-check for .
keywords:
cosmological parameters – cosmology: observations – cosmology: theory – dark energy – distance scale – large-scale structure of Universe.1 Introduction
The new controversy in the value of the Hubble constant determined from local and global measurements raised a lot of activity to pin down evidence of new physics or unaccounted systematic errors. While a local measurement with Cepheids and Type Ia supernovae (SNe Ia) derived km s-1 Mpc-1 (Riess et al., 2011), the Planck Collaboration (planck) determined km s-1 Mpc-1 within a flat cold dark matter (CDM) model from temperature anisotropies in the cosmic microwave background (CMB).
Many systematic errors may be responsible for the difference. Concerning local measurements, the first rung in the distance ladder is crucial for measurements. Depending on what method is used to calibrate SNe Ia distances, a variety of values is derived for . For example, Riess et al. (2011) used three distance indicators to calibrate the SNe Ia: a geometric distance to NGC 4258 based on a megamaser measurement; parallax measurements to Milky Way Cepheids (MWC) and Cepheids observations and a revised distance to the Large Magellanic Cloud (LMC). Revising the distance to NGC 4258 from Humphreys et al. (2013), with only this indicator Efstathiou (2014) used Riess et al. (2011) data to get km s-1 Mpc-1, while combining the three indicators the value is km s-1 Mpc-1, alleviating the tension. On the other hand, calibrating the SNe with the tip of the red giant branch (TGRB) Tammann & Reindl (2013) obtained km s-1 Mpc-1. This is very intriguing since many local determinations obtained higher values for (see Table 1).
The systematic errors may also come from the CMB analysis. For example, Spergel et al. (2013) claim that the 217 217 GHz detector can be responsible for some part of the tension, where its removal provides km s-1 Mpc-1. Moreover, an inconsistency of the Planck data with a flat CDM model was claimed by (2014), where a lack of power for high and low multipoles may indicate new physics or systematic errors.
On the new physics side, it could be just cosmic variance (Marra et al., 2013; Wojtak et al., 2014); if we live in a ‘Hubble bubble’ we would infer a higher local value for compared to the global one. This possibility requires a very unlikely size for the void, although it is compatible with observations (Keenan et al., 2013). Other possibilities include extensions of the cosmic concordance model (Salvatelli et al., 2013; Xia et al., 2013) or massive neutrinos (Wyman et al., 2014).
One way to avoid local effects is to go to intermediate redshifts. Based on a non-parametric reconstruction of data, Busti et al. (2014) extrapolated the reconstruction to redshift 0 and obtained km s-1 Mpc-1, independent of a cosmological model. Conversely, by adopting a flat CDM model, Lima & Cunha (2014, hereafter LC)111Following a long series of determinations within a cosmological model, (e.g. Cunha et al. (2007); Lima et al. (2009); Busti et al. (2012); Holanda et al. (2012)). used four different probes at intermediate redshifts, namely, angular diameter distances (ADD) from galaxy clusters, 11 ages of old high-redshift galaxies (OHRG), 18 data points and baryon acoustic oscillations (BAOs) peak. They obtained km s-1 Mpc-1. While the former value is consistent with Planck, the latter points to an internal inconsistency inside the CDM model, since both Planck and LC values were derived assuming the same model. It is worth mentioning that LC used the Bonamente et al. (2006) galaxy clusters sample, modelled by a non-isothermal spherical double model. However, the standard spherical geometry has been severely questioned, since Chandra and XMM-Newton observations have shown that galaxy clusters exhibit preferably an elliptical X-ray surface brightness (Fox & Pen 2002; Jing & Suto 2002; Sereno et al. 2006; Morandi et al. 2010; Limousin et al. 2013). Moreover, this sample was found to be inconsistent with the so-called cosmic distance duality (DD) relation (Holanda, Lima & Ribeiro 2010,2011,2012; Meng et al. 2012).
Therefore, the goal of this paper is to analyse the robustness of LC results by performing two kinds of tests. First, we search for systematic errors considering a sample where the morphology of galaxy clusters, used to derive their distances, was assumed as isothermal spherical and elliptical. Also, we test different assumptions for the incubation time used in the OHRG analysis to see the impact to . Secondly, we change the cosmological model to see its dependence on the results, where we consider a curved CDM model and a flat XCDM model. As we shall see, the value is very weakly dependent on the cosmological model. In contrast, the cluster morphology changes the result sizeably, being the main source of systematic errors, which means that this source must be controlled in order to claim that this method is a powerful cross-check for .
The Letter is organized as follows. In Sec. 2 we introduce the mathematical background and the models adopted in this work. Sec. 3 is devoted to a description of the samples used in the statistical analyses. Sec. 4 presents the results and Sec. 5 closes the paper with the conclusions.
2 Basic Equations and Models
In this Letter, we consider two cosmological scenarios: (1) the so-called CDM model, but allowing deviations from flatness, and, (2) the flat XCDM model, where the universe is flat and driven by CDM plus a dark energy component with constant equation-of-state (EoS) parameter . Throughout we use units such that the light speed .
By considering the Universe described by a homogeneous and isotropic Friedmann–Lemaître–Robertson–Walker (FLRW) geometry, the angular diameter distance is given by
| (1) |
with km s-1 Mpc-1, the function is the dimensionless Hubble parameter defined by the specific cosmology adopted, is the density curvature parameter and , for , , respectively.
On the other hand, the age-redshift relation, , is given by . For the cosmological models adopted in this Letter, reads , where . We consider two cases: a CDM model with and a flat XCDM model with .
3 Samples
In order to have a reliable comparative study with the LC results, the only difference between their and our cosmological probes it is the addition of the De Filippis et al. sample (2005). Summarizing, in this Letter we use the following.
(a) Three samples of ADD from galaxy clusters obtained from their Sunyaev–Zel’dovich and X-ray observations (the so-called ESZ/X-ray technique). The first one, used in LC, composed of 38 ADD in redshift range compiled by Bonamente et al. (2006) where the cluster plasma and dark matter distributions were analysed assuming a non-isothermal spherical double model. This model generalizes the single model proposed by Cavaliere & Fusco-Fermiano (1978). Summarizing, the cluster plasma and dark matter distributions were analysed assuming a hydrostatic equilibrium model and spherical symmetry, accounting for radial variations in density, temperature and including the possible presence of cooling flow. The new samples used here are formed by 18 galaxy clusters from De Filippis et al. (2005) in the redshift range . These authors re-analysed archival X-ray data of the XMM-Newton and Chandra satellites of two samples (Mason et al. 2001; Reese et al. 2002) for which combined X-ray and SZE analysis have already been reported. In the reanalysis were used two models to describe exactly the same clusters: the isothermal elliptical and spherical models, providing two ADD samples, named from now on, samples i and ii, respectively.
It is important to comment that, in general, different cluster gas profiles do not affect the inferred central surface brightness () or central Sunyaev–Zel’dovich decrement (), but give different (the core radius). De Filippis et al. (2005) found, for instance, (in first approximation), where and are the core radius obtained by using an isothermal elliptical model and an isothermal spherical model, respectively, and is the axial ratio of the major to the minor axes of the projected isophotes. Since , different core radius affect the ESZ/X-ray distances and, consequently, the estimates (see fig. 1 in De Filippis et al. 2005). Thus, for these single models, obtained by the spherical model is overestimated compared with the elliptical one.
(b) 18 Hubble parameter versus redshift data points, , from cosmic chronometers and BAOs in redshift range (Simon et al. 2005, Gaztanaga et al. 2009, Stern et al. 2010).
(c) The inferred ages of 11 OHRG . These 11 data points are subsamples from Ferreras et al. (2009) and Longhetti et al. (2007) catalogues. As argued by LC, the selected data set provides accurate and restrictive galaxy ages (see fig. 1 in their paper).
(d) The BAOs peak at . As it is largely known, the relevant distance measure is the dilation scale that can be modelled as the cube root of the radial dilation times the square of the transverse dilation, at the typical redshift of the galaxy sample, (Eisenstein et al. 2005):
| (2) |
However, the BAO quantity that we use is the independent BAO datum given by
| (3) |
4 analyses and results
We perform the statistics combining the four tests discussed above such as (LC)
| (4) | |||||
The quantities with subscript ’obs’ are the observational quantities, is the uncertainty in the individual distance, is the incubation time error. For the galaxy cluster samples, the common statistical contributions are SZE point sources , X-ray background , galactic NH , for cluster asphericity, kinetic SZ and for CMB anisotropy . The term is the incubation time, defined by the amount of time interval from the beginning of structure formation process in the Universe until the formation time of the object itself. The complete set of parameters is given by . Following LC, we have considered initially Gyr.
4.1 CDM
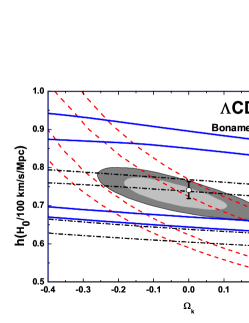
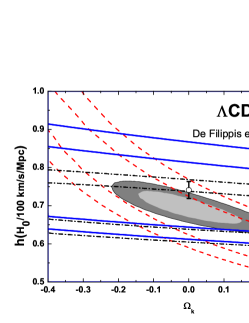
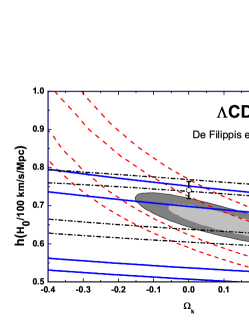
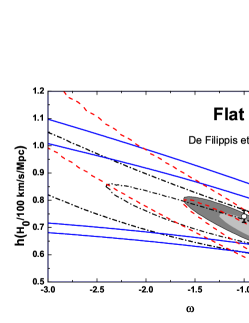
In Figs 1(a)-(c) we display the plane. Here and in the flat XCDM analyses, the red-dashed and black dash-dotted lines correspond to 1 and 2 limits obtained by using OHRG+BAO and , respectively. The blue solid lines correspond to limits from galaxy clusters samples: Bonamente et al. and De Filippis et al. samples i and ii, respectively. For CDM model, there is a degeneracy between and for all cosmological probes, and, therefore, the possible values for are weakly constrained by data separately. The filled central regions correspond to the joint analysis. The open circle with its error bar is that one from LC analysis.
From the joint analysis by using the galaxy clusters (Bonamente et al. sample)+OHRG+BAO+ we obtain in figure (1a) for two free parameters: , and at % (c.l.) . This estimate is in full agreement with the LC value, being the constraints on independent of a flat universe assumption. However, by using the other galaxy cluster samples in the joint analysis, we obtain in the figures (1b) and (1c): , and and , and , respectively.
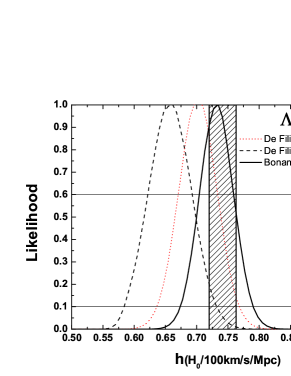
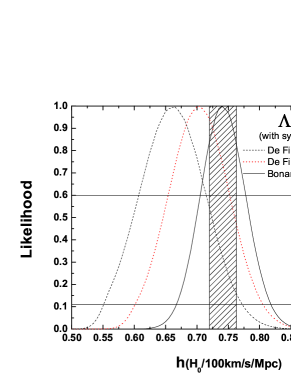
In fig. 3(a) we display the likelihood function of the parameter. To obtain this we marginalized over and parameters. The horizontal lines are cuts in the probability regions of and per cent. For this case we obtain, at 1, , and for Bonamente et al. and De Filippis et al. samples i and ii, respectively. The shaded region corresponds to 1 interval derived by LC. We also performed the analysis by using the De Filippis et al. samples in a flat CDM, obtaining and for samples i and ii, respectively, incompatible at least in 1 with the one obtained by LC ().
4.2 Flat XCDM
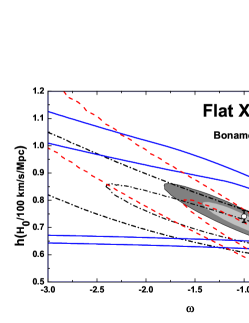
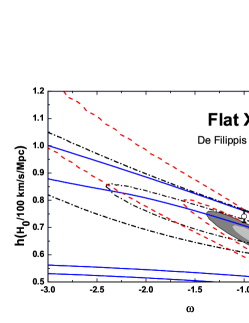
In Figs 2(a)-(c) we display the plane. There is a strong dependence between and for all cosmological probes. The filled central regions correspond to the joint analyses. Again, the open circle with its error bar is that one from LC analysis.
From the joint analysis by using the galaxy clusters+OHRG+BAO+ we obtain in fig. 2(a) for two free parameters , and at % (c.l.). This estimate is in agreement with the LC value, being, therefore, the constraints on independent of assumption. However, again, from the joint analyses in the figures 2(b) and (c), we obtain , and and , and , respectively. As one may see, it is strongly dependent on the model used to describe the galaxy clusters.
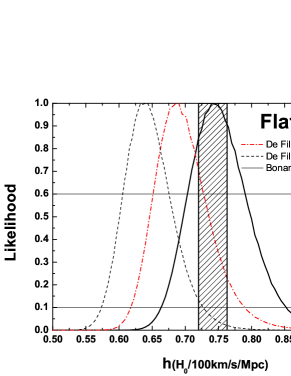
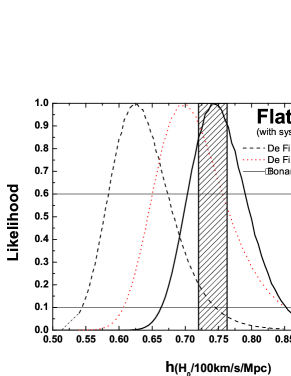
In Fig. 3(b) we display the likelihood function of the parameter. To obtain this graph we have marginalized over and parameters. The horizontal lines are cuts in the probability regions of and per cent. For this case we obtain, at 1, , and for Bonamente et al. and De Filippis et al. samples i and ii, respectively. The shaded region corresponds to the 1 interval derived by LC for a flat CDM model.
As one may see, regardless of cosmological model used, the values obtained here by using the Bonamente et al. sample are in agreement with that one from Lima & Cunha (2014) performed in a flat CDM model. Moreover, the estimates from De Filippis et al. samples also are independent of the underlying cosmological model used. However, the estimates in all cases are dependent on the model used to describe the galaxy clusters with a mild tension between Bonamente et al. sample and De Filippis et al. sample ii.
4.3 Systematic errors
Besides the cluster morphology, there are other sources of systematic errors which can affect the constraints. Therefore, we redid all analyses including the systematic errors in quadrature (see Figs 4a and b) used in LC analysis, they are per cent on and per cent on OHRG ages, moreover, from SZE/X-ray technique we have SZ calibration per cent, X-ray flux calibration per cent, radio haloes per cent and X-ray temperature calibration per cent. As a matter of fact, one may show that typical systematic errors amount for nearly per cent (details can be found in Bonamente et al. 2006). We obtain at 1 for Bonamente et al. and De Filippis et al. samples i and ii, respectively: (1) CDM: , and ; (2) flat XCDM: , and . We also performed the analysis by using the De Filippis et al. samples in a flat CDM, obtaining and for samples i and ii, respectively. Thus, for all cases, the tension between LC analysis and the De Filippis et al. sample ii is still at least 1, with the last one preferring low value in agreement with Busti et al. 2014. On the other hand, the results by using De Filippis et al. sample i are in full agreement with that one from 9-year Wilkinson Microwave Anisotropy Probe (WMAP9; see Table 1). It is important to comment that numerical simulations (Sulkanen 1999) showed that a spherical model fit to triaxial X-ray and SZE clusters should provide an unbiased estimate of when a large ensemble of clusters are used (since elongated clusters give underestimated), which is not the case at the moment. Moreover, we also explored a possible dependence on estimates arising from the chosen incubation time. Thus, we changed the incubation time to and Gyr and redid our analyses. The influence found was negligible.
| Reference | Method | () |
|---|---|---|
| Chen & Ratra 2011 | Median Statistics | |
| Hinshaw et al. 2013 | WMAP9 | |
| Freedman et al. 2012 | SNe Ia/Cepheid | |
| Ade et al. (2013) | Planck | |
| Busti et al. 2014 | ||
| LC (flat CDM) | Comb1 | |
| This Letter (flat CDM) | Comb2 | |
| This Letter (flat CDM) | Comb3 | |
| This Letter (CDM) | Comb1 | |
| This Letter (CDM) | Comb2 | |
| This Letter (CDM) | Comb3 | |
| This Letter (flat XCDM) | Comb1 | |
| This Letter (flat XCDM) | Comb2 | |
| This Letter (flat XCDM) | Comb3 |
5 Conclusions
In this work we have discussed the robustness of determination of the Hubble constant by using the following cosmic probes at intermediate redshifts: (i) angular diameter distances for galaxy clusters, (ii) the inferred ages of OHRG, (iii) measurements of the Hubble parameter and (iv) the BAO signature. In the angular diameter distances we consider three samples of galaxy clusters from Bonamente et al. (2006) and De Filippis et al. (2005), which use different assumptions on the galaxy clusters properties. As emphasized by LC, the combination of these four independent phenomena at intermediate redshifts is independent of any calibrator usually adopted in the determinations of the distance scale.
From our results, we conclude that the estimates present a negligible dependence on dark energy models and the incubation time of the OHRG analysis. However, even taking into account statistical and systematic errors, the galaxy clusters data proved to be an important source of systematic errors (see Table 1), making this technique at the moment unable to discriminate between the local value obtained by Riess et al. (2011) and the global value determined by Planck as claimed by LC.
Acknowledgements
RFLH is supported by INCT-A and CNPq (no. 478524/2013-7). VCB is supported by CNPq - Brazil through a fellowship within the program Science without Borders, and GPdS is supported by CAPES.
References
- Bonamente et al. (2006) Bonamente M., Joy M. K., LaRoque S. J., Carlstrom J. E., Reese E. D., Dawson K. S., 2006, ApJ, 647, 25
- Busti et al. (2012) Busti V. C., Guimarães R. N., Lima J. A. S., 2012, preprint(arXiv:1201.1260)
- Busti et al. (2014) Busti V. C., Clarkson C., Seikel M., 2014, MNRAS, 441, L11 [preprint(arXiv:1402.5429)]
- Cavaliere & Fusco-Fermiano (1978) Cavaliere A., Fusco-Fermiano R., 1978, A&A, 677, 70
- Chen & Ratra (2011) Chen G., Ratra B., 2011, PASP, 123, 1127
- Cunha et al. (2007) Cunha J. V., Marassi L., Lima J. A. S., 2007, MNRAS, 379, L1
- De Filippis et al. (2005) De Filippis E., Sereno M., Bautz M. W., Longo G., 2005, ApJ,625, 108
- Efstathiou (2014) Efstathiou G., 2014, MNRAS, 440, 1138
- Eisenstein et al. (2005) Eisenstein D. J. et al., 2005, Apj, 633, 560
- Ferreras et al. (2009) Ferreras I. et al., 2009, ApJ, 706, 158
- Fox & Pen (2002) Fox D. C., Pen U.-L., 2002, Apj, 574, 38
- Freedman et al. (2012) Freedman W. L., Madore B. F., Scowcroft V., Burns C., Monson A., Persson S. E., Seibert M., Rigby J., 2012, ApJ, 758, 24
- Gaztanaga et al. (2009) Gaztanaga E., Cabre A., Hui L., 2009, MNRAS, 399, 1663
- (14) Hazra D. K., Shafieloo A., 2014, J. Cosmol. Astropart. Phys., 1, 43
- Hinshaw et al. (2013) Hinshaw G. et al.,2013, ApJS, 208, 19
- Holanda et al. (2012) Holanda R. F. L., Cunha J. V., Marassi L., Lima J. A. S., 2012, J. Cosmol. Astropart. Phys., 2, 35
- Holanda et al. (2010) Holanda R. F. L., Lima J. A. S., Ribeiro M. B., 2010, ApJ, 722, L233
- Holanda et al. (2011) Holanda R. F. L., Lima, J. A. S., Ribeiro M. B.,2011, A&A, 528, L14
- Holanda et al. (2012) Holanda R. F. L., Lima J. A. S., Ribeiro M. B., 2012, A&A, 538, 131
- Humphreys et al. (2013) Humphreys E. M. L., Reid M. J., Moran J. M., Greenhill L. J., Argon A. L., 2013, ApJ, 775, 13
- Keenan et al. (2013) Keenan R. C., Barger A. J., Cowiee L. L., 2013, ApJ, 775, 62
- Jing & Suto (2002) Jing Y. P., Suto, Y., 2002, ApJ, 574, 538
- Lima et al. (2009) Lima J. A. S., Jesus J. F., Cunha J. V., 2009, ApJ, 690, L85
- Lima & Cunha (2014, hereafter LC) Lima J. A. S., Cunha J. V., 2014, ApJ, 781, L38
- Limousin et al. (2013) Limousin M., Morandi A., Sereno M., Meneghetti M., Ettori S., Bartelmann M., Verdugo T., 2013, Space Sci. Rev., 177, 155
- Longhetti et al. (2007) Longhetti M. et al., 2007, MNRAS, 374, 614
- Marra et al. (2013) Marra V., Amendola L., Sawicky I., Valkenburg W., 2013, Phys. Rev. Lett., 110, 241305
- Mason et al. (2001) Mason B. S., Myers S. T., Readhead A. C. S., 2001, ApJ, 555, L11
- Meng et al. (2012) Meng X.-L, Zhang T.-J, Zhan H., Wang X., 2012, ApJ, 745, 98
- Morandi et al. (2010) Morandi A., Pedersen K., Limousin M., 2010, ApJ, 713, 491
- Planck collaboration (2010) Planck Collaboration XVI, 2013, preprint (arXiv:1303.5076)
- Reese (2002) Reese E. D., Carlstrom J. E., Joy M., Mohr J. J., Grego L., Holzapfel W. L., 2002, ApJ, 581, 53
- Riess et al. (2011) Riess A. G. et al., 2011, ApJ, 730, 119
- Salvatelli et al. (2013) Salvatelli V., Marchini A., Lopez-Honores L., Mena O., 2013, Phys. Rev. D, 88, 023531
- Sereno et al. (2006) Sereno M., De Filippis E., Longo G., Bautz M. W., 2006, ApJ, 645, 170
- Simon et al. (2005) Simon J., Verde L., Jimenez R., 2005, Phys. Rev. D, 71, 123001
- Spergel et al. (2013) Spergel D., Flauger R., Hlozek R., 2013, preprint(arXiv:1312.3313)
- Stern et al. (2010) Stern D., Jimenez R., Verde L., Kamionkowski M., Stanford S. A., 2010, J. Cosmol. Astropart. Phys., 2, 8
- Sulkanen (1999) Sulkanen M. E., 1999, ApJ, 522, 59
- Tammann & Reindl (2013) Tammann G. A., Reindl B., 2013, A&A, 549, 136
- Xia et al. (2013) Xia J.-Q., Li H., Zhang X., 2013, Phys. Rev. D, 88, 063501
- Wojtak et al. (2014) Wojtak R., Knebe A., Watson W. A., Iliev I. T., Hess S., Rapetti D., Yepes G., Gottloeber S., 2014, MNRAS, 438, 1805
- Wyman et al. (2014) Wyman M., Rudd D. H., Vanderveld A., Hu W., 2014, Phys. Rev. Lett., 112, 051302