Magnetic order and spin dynamics in La2O2Fe2OSe2 probed by 57Fe Mössbauer,
139La NMR, and muon spin relaxation spectroscopy
Abstract
We present a detailed local probe study of the magnetic order in the oxychalcogenide La2O2Fe2OSe2 utilizing 57Fe Mössbauer, 139La NMR, and muon spin relaxation spectroscopy. This system can be regarded as an insulating reference system of the Fe arsenide and chalcogenide superconductors. From the combination of the local probe techniques we identify a non-collinear magnetic structure similar to Sr2F2Fe2OS2. The analysis of the magnetic order parameter yields an ordering temperature and a critical exponent of , which is close to the 2D Ising universality class as reported in the related oxychalcogenide family.
pacs:
74.70.Xa,76.80.+y,76.60.-k,76.75.+iI Introduction
One of the important issues to understand the iron based superconductors is the role of electron correlations. The antiferromagnetically (AFM) ordered state of the parent compounds of RFeAsO (R = rare earth)de la Cruz et al. (2008); Klauss et al. (2008) and BaFe2As2 Rotter et al. (2008) pnictide superconductors can be understood either as a spin density wave order of an itinerant multiband Fermi surface,Mazin (2010) or due to a frustrated - interaction of localized spins.Si (2009); Fernandes et al. (2012) Strongly localized systems with layered transition metal (Tm) pnictide or (oxy-) chalcogenide structures serve as reference systems to understand the properties of the iron based superconductors. Moreover, due to the interplay of three different intraplane exchange interactions of Tm ions, the oxychalcogenide systems show a rich variety of magnetically ordered ground states. G-type AFM order with magnetic Mn moments aligned along the crystallographic -axis is reported for La2O2Mn2OSe2.Ni et al. (2010) A non-collinear arrangement of magnetic moments parallel to the - plane is concluded for Sr2F2Fe2OS2 [Fig. 10(e)] and a different one for La2O2Co2OSe2 [with a possible magnetic structure according to the model in Fig. 10(d)]. Zhao et al. (2013); Fuwa et al. (2010a)
The R2O2Tm2OCh2 and A2F2Tm2OCh2 oxychalcogenides exist in a rich variety of compositions: systems with R = La, Ce, Pr, Nd, Sm; A = Sr, Ba; Tm = Fe, Co, Mn; and Ch = Se, S are reported.Mayer et al. (1992); Kabbour et al. (2008); Fuwa et al. (2010b); Ni et al. (2010); Free et al. (2011); Landsgesell et al. (2013); Lei et al. (2012) Among these isostructural materials with symmetry, all reported systems with Tm = Fe exhibit a transition to antiferromagnetic order near = 100 K. Non-metallic and antiferromagnetic properties in La2O2Fe2OCh2 and Sr2F2Fe2OS2 are consistent with theoretical studies indicating Mott-insulating behavior. Zhu et al. (2010); Wang et al. (2011); Zhao et al. (2013) 57Fe Mössbauer studies on Nd2O2Fe2OSe2 and Sr2F2Fe2OS2 found critical exponents close to the 2D Ising universality class, indicating anisotropical, dominantly 2D magnetic exchange interactions. Kabbour et al. (2008); Fuwa et al. (2010b); Zhao et al. (2013)
In these systems, within a Fe2OCh2 layer, three different magnetic exchange interactions of ions are considered: A diagonal nearest neighbor (nn) interaction and two next nearest neighbor (nnn) interactions and via or two ions, respectively [Fig. 10(b)].Kabbour et al. (2008) The nature of the magnetic interactions and possible models of magnetic order in the iron based oxychalcogenides had been studied extensively.Kabbour et al. (2008); Fuwa et al. (2010b); Free and Evans (2010); Wang et al. (2011); Zhao et al. (2013); Zhu et al. (2010)
The magnetic ground state of La2O2Fe2OSe2 was proposed to obey a plaquette AFM order for on-site Hubbard interaction eV or eV, and the Neel state for eV. Zhu et al. (2010) From this the deduced interactions are reported to be FM for the Fe--Fe pathway, AFM for the Fe-O-Fe interaction, and AFM for the nearest neighbor coupling . The transition from plaquette AFM order () to the Neel state () is driven by the parameter . While in the plaquette state two nn Fe magnetic moments are aligned parallel and two antiparallel, with stronger in the Neel state all AFM nn interactions are satisfied, but not the AFM mediated by oxygen ions.
A neutron diffraction study on La2O2Fe2OSe2 concluded a collinear and columnar AFM order below K. Free and Evans (2010) In this model non of the three interactions is satisfied for all nn and nnn Fe moments. For one axis of the basal plane the Fe magnetic moments are aligned parallel along Fe-O-Fe and Fe--Fe chains and antiparallel along the other. Again two nn Fe magnetic moments are aligned parallel and two antiparallel.
In contrast, Fuwa et al. introduced two different non-collinear models of magnetic order for Nd2O2Fe2OSe2.Fuwa et al. (2010b) These models are consistent with a axial anisotropy of magnetic Fe moments, aligned along perpendicular O-Fe-O chains in the Fe2OSe2 layer. One of these models was found to describe non-collinear magnetic order in Sr2F2Fe2OS2. Zhao et al. (2013) In Fig. 10(b)-(d) the three magnetic structures consistent with AFM interaction and an orientation of magnetic moments along O-Fe-O chains are shown.
Recently it was shown that a collinear and columnar AFM order and the non-collinear order concluded for Sr2F2Fe2OS2 are indistinguishable in elastic neutron scattering on La2O2Fe2OSe2 powder, whereas inelastic experiments are only consistent with the non-collinear model.McCabe et al. (2014) Moreover, gapped ( meV) and confined (below meV) magnetic excitation was reported.
In this study we present 57Fe Mössbauer, 139La NMR, and muon spin relaxation (SR) experiments on polycrystalline La2O2Fe2OSe2. We find long-range magnetic order below K and deduce a critical exponent . The magnetic order is deduced to obey a non-collinear structure according to a ferromagnetic (FM) interaction [Fig. 10(d)]. We first give a brief introduction to the experimental setup in section II. In section III we present our results of 57Fe Mössbauer spectroscopy. 139La NMR field-swept and SR spectra are presented in section IV and V. Finally we give a summary in section VI.
II Experimental Details
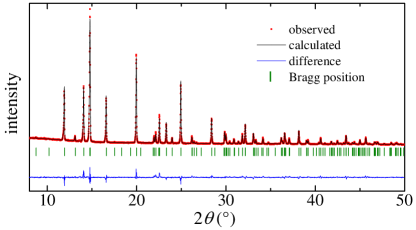
Polycrystalline samples of La2O2Fe2OSe2 were prepared by the solid-state reaction method using stoichiometric amounts of , Fe, and Se. The resulting powder were ground in an argon glove box, pressed into a pellet, and placed inside a quartz ampoule under vacuum. The pellet was heated by following the routine described in the reference. Free and Evans (2010) The single phase of La2O2Fe2OSe2 was confirmed by X-ray powder diffraction experiments performed on a STOE Stadi P powder diffractometer with radiation () at 293 K. The diffractometer is equipped with a curved Ge(111) monochromator and a -linear position sensitive detector. The structural analysis was carried out by Rietveld refinement utilizing the FullProf software package.Rietveld (1969); Roisnel and Rodriguez-Carvajal (2001) The refined structural parameters are presented in table 1 and are in good agreement with earlier studies. Mayer et al. (1992); Free et al. (2011)
| La | Fe | Se | O(1) | O(2) | |
| Wykoff position | |||||
| 0 | |||||
| 0 | 0 | 0 | |||
| 0.1845(1) | 0 | 0.0966(1) | 0 | ||
| space group , , , | |||||
| , , | |||||
All experimental work presented here were done on one single batch of crushed polycrystalline material.
For 57Fe Mössbauer spectroscopy a thin absorber of 2.6 mg/cm2 Fe area density was prepared by evaporation of a methanol suspension of the powdered sample. A Wissel spectrometer was operated in sinusoidal mode and photons were detected with a KeTek-SDD detector.
139La NMR experiments in a temperature range of K K were performed by conventional pulsed NMR techniques with the duration of a -pulse equal to 6 s. The NMR data were recorded in a 8 T superconducting magnet system with a 4He variable temperature insert, using a Tecmag LapNMR spectrometer. The polycrystalline powder was placed in a glass tube inside a Cu coil with a frequency of the resonant circuits of 44.0 MHz and 25.5 MHz. The spin-lattice relaxation rate was measured by using the saturation recovery method.
An extensive search was carried out to resolve the 77Se signal, however without success. Since the crystallographic Se site is located much closer to the Fe than the La site, a strong magnetic hyperfine coupling can lead to a nuclear relaxation too fast to be measured.
Zero magnetic field SR spectra were recorded using the GPS instrument at the PSI Villigen, Switzerland, in a temperature range K. The data were analyzed using the free software package MUSRFIT.Suter and Wojek (2012)
III 57Fe Mössbauer spectroscopy
57Fe Mössbauer spectroscopy allows to study microscopically the strength and alignment of ordered Fe magnetic moments with respect to the electric field gradient (EFG) principal axis within the distorted FeO2Se4 octahedra. Moreover it is sensitive to temperature dependent changes of the electronic surrounding via the electric quadrupole interaction.
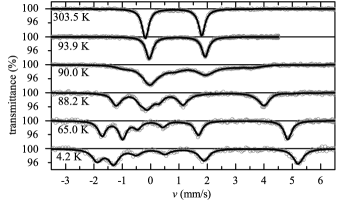
Figure 2 shows the 57Fe Mössbauer spectra at selected temperatures. In the paramagnetic regime down to K we find a single asymmetric doublet with a quadrupole splitting of mm/s (Fig. 4). This corresponds to a principal EFG component of and is close to the values found in earlier studies.Fuwa et al. (2010b); Lei et al. (2012) The asymmetric absorption intensity of the doublet is interpreted in terms of texture caused by the flaky shape of the crystallites. These flakes are suspected to be oriented flat on the bottom of the sample holder, resulting in a preferred orientation of the -axis parallel to the -beam. With decreasing temperature below a sextet is developed, indicating long range magnetic ordering. Due to the symmetry of the 57Fe site an asymmetric electric field gradient, with asymmetry , is expected. The analysis of the spectra is done by diagonalization of the full static hyperfine hamiltonian
with nuclear spin operators , , and . is the hyperfine field at the 57Fe site. , , and denote the nuclear quadrupole moment, g-factor, and magneton. The polar angle and the azimuthal angle describe the orientation of the Fe hyperfine field with respect to the EFG -axis. Due to the preferred orientation of the sample flakes parallel to the bottom of the sample holder, i.e. the preferred orientation of the -beam parallel to the -axis, a texture function
| (2) |
is introduced to account for corrections of the line intensities with respect to the geometrical setup. Here the polar angle and the azimuthal angle describe the orientation of the -beam with respect to the EFG -axis. Additionally the equivalent description by the angle between the crystallographic -axis and the -beam is given. With this the preferred orientation can be smoothly tuned by the model parameter .
In the AFM ordered state we find constant and within error bars. While a simple point charge model calculation estimates in La2O2Fe2OSe2, a smaller value was reported for Nd2O2Fe2OSe2 (). Fuwa et al. (2010b)

| (K) | (T) | |||||
|---|---|---|---|---|---|---|
| La2O2Fe2OSe2 ∗ | 90. | 1 | 20. | 3 | 0. | 133 |
| La2O2Fe2OSe2 Fuwa et al. (2010b) | - | 21 | - | |||
| Nd2O2Fe2OSe2 Fuwa et al. (2010b) | 88. | 3 | 20 | 0. | 104 | |
| Sr2F2Fe2OS2 Kabbour et al. (2008) | 106. | 2 | 20. | 65 | 0. | 15 |
| Ba2F2Fe2OSe2 Kabbour et al. (2008) | 83. | 6 | 20. | 4 | 0. | 118 |
and are fixed for further analysis of and . While decreasing the temperature the magnetic volume fraction increases rapidly. At 88 K the sample is 100% magnetic. At the lowest measured temperature K the spectrum is described by a Zeeman splitting with maximum hyperfine field T. All spectra are fitted with a single Fe site. The isomer shift of 0.82 mm/s at room temperature is typical for a high spin state of Fe2+. Shirane et al. (1962) The absolute value of the 57Fe hyperfine field at low temperatures is close to that of other oxychalcogenide systems (Tab. 2). For Sr2F2Fe2OS2 a saturation field T and the low temperature ordered Fe magnetic moment is reported.Kabbour et al. (2008); Zhao et al. (2013) Taking into account the very similar local coordination of the Fe ions in La2O2Fe2OSe2 and Sr2F2Fe2OS2, the same conversion factor between the 57Fe hyperfine field and the ordered magnetic moment, as calculated from the Sr2F2Fe2OS2 values, is valid for both materials. From this a low temperature ordered Fe magnetic moment of in La2O2Fe2OSe2 is deduced from the saturation field.
Mössbauer spectroscopy clearly shows that in the magnetically ordered regime, i.e. the magnetic hyperfine field is oriented parallel to the -axis of the EFG principal axis system (Fig. 3). Considering that the EFG strongest component is aligned along the O-Fe-O chains (also calculated in a LSDA+U approach), Fuwa et al. (2010b) this proves that the ordered Fe magnetic moments are oriented parallel to O-Fe-O chains, resulting in a non-collinear magnetic order. This was already concluded for the Nd-system. Fuwa et al. (2010b) Considering AFM intraplane exchange interactions, three different models of non-collinear order are possible (see Fig. 10).
Fitting the sublattice magnetization for temperatures above , yields a transition temperature K. The critical exponent is close to that of the magnetic square planar Ising model ().
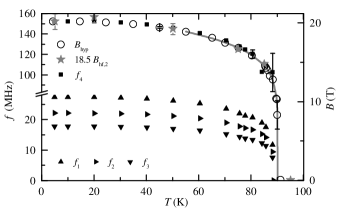
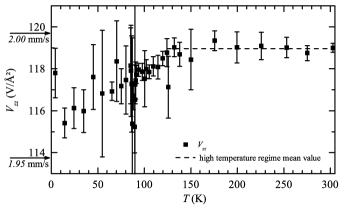
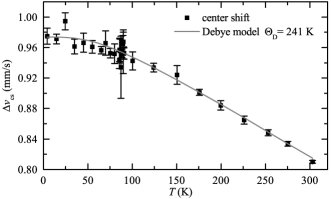
Figure 4 shows the temperature dependence of the EFG component . is constant at high temperatures above 120 K and then decreases gradually below. This onset temperature is in accordance with an anomaly of the thermal expansion along the -axis, detected in neutron scattering experiments.Free and Evans (2010) The Debye-Waller-factor as well as the quadratic Doppler shift can be described in the Debye model (Fig. 5). For both datasets a Debye temperature K is obtained and no anomaly is found below 120 K.
IV 139La NMR
In this section we present field-swept 139La NMR spectra and spin-lattice relaxation data. Figure 7 shows 139La spectra at different temperatures.
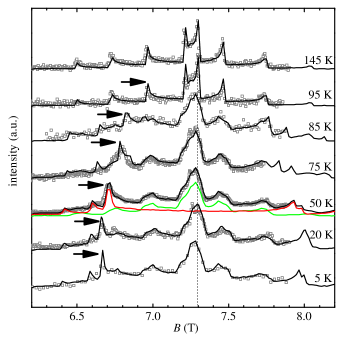
At high temperatures a typical nuclear spin powder line shape is observed. For the spectra consist of a splitted central transition and three pairs of satellites. Note that the most outer satellite at the high field side was not observed at 44.0 MHz, but has been verified in measurements at a frequency of 25.5 MHz. In the paramagnetic state the deduced quadrupole frequency is MHz and the asymmetry parameter . Due to the local symmetry of La, a vanishing is reasonable and the EFG principal -axis is assumed to match the crystallographic -axis. These values are fixed for the analysis of the magnetically ordered regime , where two effects lead to more complex spectra: 1. A significant broadening of the central transition and the satellites is attributed to static hyperfine fields. 2. Additional 139La intensity appears at 85 K, near 6.8 T and strongly shifts to lower fields, when cooling the sample. Since there is only one crystallographic La position in the unit cell, the NMR experiments show two magnetically non-equivalent sites.
To analyze the field-swept spectra, the nuclear Hamiltonian
| (3) |
was diagonalized for 25000 random orientations of the external field , with respect to the EFG principal -axis, at each sweep step (). and are hyperfine fields parallel and perpendicular to the - plane. Transitions of nuclear sublevels corresponding to 44.0 MHz (in a window of 70 kHz corresponding to the signals FWHM) provide the intensity for a given field point.
While the modeled spectra yield an accurate description of the experimental data without any additional internal field ( mT and mT) at temperatures , two local fields and at magnetically non-equivalent 139La sites must be introduced to describe the observed spectra in the ordered state.
Site 1: Choosing parallel to the - plane results in a broadening of the simulated spectra. The green lines in Fig. 7 and 8 are simulations with 35 mT and reproduce some features of NMR line broadening at 50 K. Any additional component parallel to the -axis will impair the simulation and we find 0 mT.
Site 2: To describe the second signal, a simulation with is shown as red line. Here mT at 50 K. Additional components of the hyperfine field parallel to the - plane, in the order of mT, will not interfere the simulation.
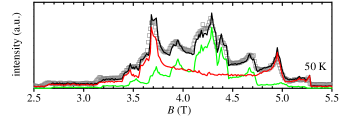
Black lines are spectral sums of equal weighting for both 139La sites and model our field-swept data very well in the magnetically ordered regime. The temperature dependency of is shown in Fig. 6. Additional field-swept spectra at a resonance frequency of 25.5 MHz yields similar results and confirm the magnetic origin of line broadening and shifting (Fig. 8).
We calculated the hyperfine coupling constants at the 139La sites, using localized Fe magnetic dipole moments for three non-collinear models of magnetic order (Fig. 10). For each model (c) and (d), equivalent values of hyperfine coupling parallel and perpendicular to the -axis are obtained at all 139La sites. Therefore those models cannot describe our NMR field swept spectra in the magnetically ordered state. Only model (e) results in magnetically non-equivalent 139La sites:
Site 1: For site 1 the small hyperfine coupling is parallel to the - plane. The value of the components reads mT and mT. The parallel component primarily arises due to the nnn FeO2 plane, while all contributions from the nn plane cancel with respect to the symmetry.
Site 2: For site 2 a strong hyperfine coupling is essentially parallel to the -axis. The value of the components is mT and mT. The strong component parallel to the -axis primarily arises due to the coupling to Fe magnetic dipolar moments located in the nn FeO2 plane. Again the parallel component is dominantly due to the nnn FeO2 plane.
This model is identified to be consistent with our experimental results.
Comparing the hyperfine fields deduced from the NMR field-swept experiment to the ordered magnetic Fe moment deduced from Mössbauer spectroscopy, we obtain a hyperfine coupling parallel to the - plane of for site 1 and for site 2 . The dipolar model yields a good qualitative description of our field-swept spectra for both sites. For site 1 also a good quantitative agreement is found (37% difference between experimental and calculated hyperfine coupling). For site 2 the experimental value is approximately four times larger than the calculated . This shows a limitation of the dipole approximation which does not take into account additional contributions of transfered hyperfine coupling.
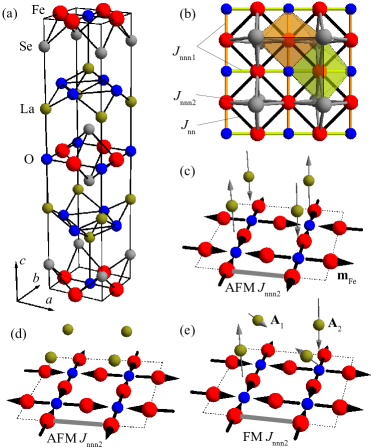
(b) Magnetic exchange interactions in the layer. Green and orange distorted octahedra sketch the coordination of Fe ions along perpendicular Fe-O-Fe chains. Green and orange lines symbolize the super exchange pathway along these chains. Gray and black lines represent and . For AFM and moments aligned along O-Fe-O chains there are three realizations of magnetic structure as discussed in the literature.
(c)-(e) Sketches of the plane for the three different non-collinear models of magnetic structure. Additionally representative La sites are shown. The gray arrows indicate the calculated dipolar hyperfine coupling.
(c) AFM yields strong hyperfine fields at all sites.
(d) AFM yields no hyperfine fields at all sites.
(e) Ferromagnetic interaction results in the model of magnetic order as described for Sr2F2Fe2OS2 and yields magnetically non-equivalent 139La sites.
The 139La spin-lattice relaxation rate was measured by conventional saturation recovery method, exciting the central transition line at 44.0 MHz, and 7.297 T (marked by the vertical dash-dotted line in Fig. 7). Recovery curves are fitted by
taking into account magnetic transition probabilities for a relaxation of a spin nuclei central transition. is the value of the nuclear magnetization at a time after the saturation pulse and the equilibrium magnetization.
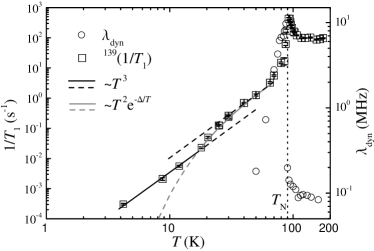
Figure 9 shows the vs plot together with the dynamic relaxation rate of the muon-spin-polarization. For , monitors the slowing down of magnetic fluctuations while approaching with respect to equivalent 139La sites. For the experiments at 7.297 T mainly probe site 1 and the spin-lattice relaxation is strongly reduced within an interval of 5 K. For K we find close to a power law. In the ordered state of AFM insulators the relaxation of nuclear spins in the presence of a gap in the magnetic excitation spectrum is mainly driven by Raman processes.Moriya (1956) For a behavior of the spin-lattice relaxation rate is expected for a dominating two-magnon process, while a three-magnon process will result in a power law.Beeman and Pincus (1968) The deviations of from the law towards lower temperatures indicates the crossover to the regime , where the thermal activation of gapped excitations will lead to . The gray line in Fig. 9 refers to K, which is close to the observed gap in the reference.McCabe et al. (2014) In the low temperature regime the relaxation due to the gapped excitations is rapidly suppressed. For K it is dominated by a process which again reveals a power law .
V Zero field SR experiments
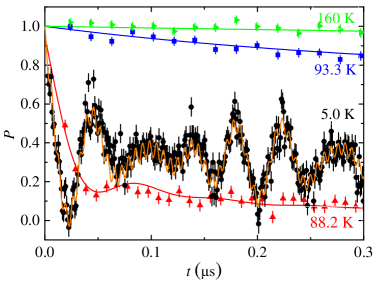
In zero field SR experiments the time dependent polarization of an initially polarized muon-spin ensemble is obtained. After implantation, the positive muons thermalize very fast and come to rest at interstitial lattice sites. The muon decays into two neutrinos and a positron which is detected. Because the direction of the positron emission is favored along the direction of the muon spin at the moment of the decay, an ensemble average of several million decays provides . Representative spectra on powder samples of La2O2Fe2OSe2 at selected temperatures are shown in Fig. 12.
For the polarization is described by an exponential relaxation with two fractions :de Réotier and Yaouanc (1997)
| (4) |
and denote relaxation rates of the time dependent muon spin polarization. For K we find , indicating magnetically equivalent muon sites in the paramagnetic regime.
In accordance with the onset temperature of the reduction and the corresponding anomaly of the thermal expansion we identify a second fraction below K. This fraction exhibits a rather strong relaxation MHz . We attribute this fraction of the SR signal to muons affected by a large hyperfine coupling constant which are therefore probably located at an interstitial site close to a magnetic Fe moment. This conclusion will later be reinforced by the observation of an equivalent signal fraction probing a strong static internal magnetic field in the low temperature, long range ordered magnetic phase (see below).
is shown in Fig. 9 and monitors the slowing down of magnetic fluctuations while approaching in the paramagnetic regime.
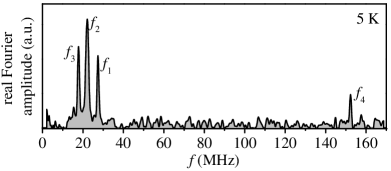
In the magnetically long range ordered regime internal fields at the muon sites develop and therefore spontaneous muon-spin precession is observed. Taking into account the powder average, the polarization is described by 2/3 oscillating and 1/3 non-oscillating fractions. A magnetic five site model for the oscillating fraction is identified from a Fourier transformation of the polarization (Fig. 11), which displays four well defined frequencies and a fast relaxing contribution. The non-oscillating part of the polarization is described by an effective two site model, with 85% dynamically depolarizing and 15% non-depolarizing fractions:de Réotier and Yaouanc (1997)
| (5) |
Here describe the depolarization of the oscillating signal fractions. The fast depolarization of fraction with MHz prohibits a determination of . We find signal fractions , and at lowest measured temperature and fix them for the analysis of the magnetically ordered regime. The obtained precession frequencies , and are shown in Fig. 6. In our analysis the ratios of the frequencies and are determined from the 5 K spectrum and fixed for the further analysis. The high frequency oscillation nicely scales with the order parameter determined from 57Fe Mössbauer and 139La NMR experiments within error bars. In correspondence to the presented analysis of the 57Fe Mössbauer order parameter the frequencies and yield a consistent critical exponent and transition temperature .
Fraction is nearly equal to and indicates strong hyperfine coupling due to a close vicinity to magnetic Fe moments. We identify and as stemming from crystallographically equivalent muon sites. Spontaneous precession frequencies due to internal magnetic fields probe the magnetic order parameter. We find proportional to deduced from Mössbauer spectroscopy and deduced from 139La NMR experiments (Fig. 6).
We interpret the multiplicity of precession frequencies - as due to magnetically non-equivalent sites in the ordered regime. Compared to the magnetic twofold splitting of 139La spectra, a reduced symmetry of interstitial muon sites will lead to a more complex splitting of muon-spin precession frequencies.
Below the dynamic depolarization is reduced strongly. Finally for K only small residual depolarization MHz is fitted (not shown in Fig. 9). Here the relaxation of the different muon fractions successively drops below the sensitivity of the method near 50 K.
VI Summary
We have investigated magnetic order and spin dynamics in La2O2Fe2OSe2 by means of 57Fe Mössbauer spectroscopy, 139La NMR, and muon spin relaxation. The analysis of the Mössbauer spectra puts the system close to related oxychalcogenide systems (Tab. I). The spectra reveal the presence of magnetically equivalent Fe moments with non-collinear alignment parallel to O-Fe-O chains in the ordered state. This is in contrast to the collinear order model concluded in a neutron spectroscopy study but consistent with former theoretical predictions. The transition temperature to magnetic order is K. The critical exponent of the magnetic order parameter is close to that of the 2D Ising universality class.
In NMR field-swept experiments we find two magnetically non-equivalent 139La sites in the magnetically ordered state. This is shown to be consistent with only one model of non-collinear magnetic order discussed in the literature, i.e. the model shown in Fig. 10(d). This model was already suggested as one possible model for Nd2O2Fe2OSe2 and was recently found to describe magnetic order in Sr2F2Fe2OS2.
The observation of four muon-spin precession frequencies and a fast depolarizing signal in the ordered state in La2O2Fe2OSe2 is interpreted in terms of two different muon sites and the complex model of magnetic order.
Dynamic depolarization of the muon-spin ensemble and 139La spin-lattice relaxation reveal a slowing down of magnetic fluctuations while approaching the long range ordered state. For magnetic fluctuations are strongly suppressed. In the temperature range data probes the cross over to the gapped regime , in consistence with inelastic neutron scattering data. McCabe et al. (2014) For the strong reduction of spin-lattice relaxation rate due to the excitation gap is finally dominated by another source of relaxation, again leading to a power law behavior . This is indicative for the presence of low energy magnetic excitations below the gap energy. In the magnetically ordered state of La2O2Fe2OSe2 a small residual dynamic depolarization hides the signature of the spin excitation band. McCabe et al. (2014)
Due to the peculiar local in-plane coordination auf Fe atoms by oxygen, the magnetism in La2O2Fe2OSe2 is more anisotropic then in Fe pnictides. In the crystal electric field the strongly localized high spin states of form two orthogonal 2D-Ising-like magnetic sublattices along O-Fe-O bonds. From the observed magnetic order we conclude AFM interaction via oxygen and FM interaction via selenium . La2O2Fe2OSe2 is the second compound along with Sr2F2Fe2OS2 were this particular order is observed.
VII Acknowledgments
This work has been financially supported by the Deutsche Forschungsgemeinschaft (DFG) through the priority programm SPP 1458 (projects KL 1086/10-1 and BU 887/15-1) and the Research Training Group GRK 1621. R. Sarkar is thankful to DFG for the financial support with grant no. DFG SA 2426/1-1. This work was supported by Korea NRF Grants (No. 2012-046138 and No. 2012M7A1A2055645). Part of this work was performed at the Swiss Muon Source (Villigen, Switzerland).
References
- de la Cruz et al. (2008) C. de la Cruz, Q. Huang, J. W. Lynn, J. Li, W. R. II, J. L. Zarestky, H. A. Mook, G. F. Chen, J. L. Luo, N. L. Wang, et al., Nature (London) 453, 899 (2008), URL http://dx.doi.org/10.1038/nature07057.
- Klauss et al. (2008) H.-H. Klauss, H. Luetkens, R. Klingeler, C. Hess, F. J. Litterst, M. Kraken, M. M. Korshunov, I. Eremin, S.-L. Drechsler, R. Khasanov, et al., Phys. Rev. Lett. 101, 077005 (2008), URL http://link.aps.org/doi/10.1103/PhysRevLett.101.077005.
- Rotter et al. (2008) M. Rotter, M. Tegel, D. Johrendt, I. Schellenberg, W. Hermes, and R. Pöttgen, Phys. Rev. B 78, 020503 (2008), URL http://link.aps.org/doi/10.1103/PhysRevB.78.020503.
- Mazin (2010) I. I. Mazin, Nature (London) 464, 183 (2010), URL http://dx.doi.org/10.1038/nature08914.
- Si (2009) Q. Si, Nat. Phys. 5, 629 (2009), URL http://dx.doi.org/10.1038/nphys1394.
- Fernandes et al. (2012) R. M. Fernandes, A. V. Chubukov, J. Knolle, I. Eremin, and J. Schmalian, Phys. Rev. B 85, 024534 (2012), URL http://link.aps.org/doi/10.1103/PhysRevB.85.024534.
- Ni et al. (2010) N. Ni, E. Climent-Pascual, S. Jia, Q. Huang, and R. J. Cava, Phys. Rev. B 82, 214419 (2010), URL http://link.aps.org/doi/10.1103/PhysRevB.82.214419.
- Zhao et al. (2013) L. L. Zhao, S. Wu, J. K. Wang, J. Hodges, C. Broholm, and E. Morosan, Phys. Rev. B 87, 020406(R) (2013), URL http://link.aps.org/doi/10.1103/PhysRevB.87.020406.
- Fuwa et al. (2010a) Y. Fuwa, T. Endo, M. Wakeshima, Y. Hinatsu, and K. Ohoyama, J. Am. Chem. Soc. 132, 18020 (2010a), URL http://pubs.acs.org/doi/abs/10.1021/ja109007g.
- Mayer et al. (1992) J. M. Mayer, L. F. Schneemeyer, T. Siegrist, J. V. Waszczak, and B. Van Dover, Angew. Chem., Int. Ed. Engl. 31, 1645 (1992), URL http://dx.doi.org/10.1002/anie.199216451.
- Kabbour et al. (2008) H. Kabbour, E. Janod, B. Corraze, M. Danot, C. Lee, M.-H. Whangbo, and L. Cario, J. Am. Chem. Soc. 130, 8261 (2008), URL http://dx.doi.org/10.1021/ja711139g.
- Fuwa et al. (2010b) Y. Fuwa, M. Wakeshima, and Y. Hinatsu, J. Phys.: Condens. Matter 22, 346003 (2010b), URL http://stacks.iop.org/0953-8984/22/i=34/a=346003.
- Free et al. (2011) D. G. Free, N. D. Withers, P. J. Hickey, and J. S. O. Evans, Chem. Mater. 23, 1625 (2011), URL http://pubs.acs.org/doi/abs/10.1021/cm1035453.
- Landsgesell et al. (2013) S. Landsgesell, E. Blumenröther, and K. Prokeš, J. Phys.: Condens. Matter 25, 086004 (2013), URL http://stacks.iop.org/0953-8984/25/i=8/a=086004.
- Lei et al. (2012) H. Lei, E. S. Bozin, A. Llobet, V. Ivanovski, V. Koteski, J. Belosevic-Cavor, B. Cekic, and C. Petrovic, Phys. Rev. B 86, 125122 (2012), URL http://link.aps.org/doi/10.1103/PhysRevB.86.125122.
- Zhu et al. (2010) J.-X. Zhu, R. Yu, H. Wang, L. L. Zhao, M. D. Jones, J. Dai, E. Abrahams, E. Morosan, M. Fang, and Q. Si, Phys. Rev. Lett. 104, 216405 (2010), URL http://link.aps.org/doi/10.1103/PhysRevLett.104.216405.
- Wang et al. (2011) G. Wang, M. Zhang, L. Zheng, and Z. Yang, Solid State Communications 151, 1231 (2011), URL http://www.sciencedirect.com/science/article/pii/S0038109811002924.
- Free and Evans (2010) D. G. Free and J. S. O. Evans, Phys. Rev. B 81, 214433 (2010), URL http://link.aps.org/doi/10.1103/PhysRevB.81.214433.
- McCabe et al. (2014) E. E. McCabe, C. Stock, E. E. Rodriguez, A. S. Wills, J. W. Taylor, and J. S. O. Evans, Phys. Rev. B 89, 100402 (2014), URL http://link.aps.org/doi/10.1103/PhysRevB.89.100402.
- Rietveld (1969) H. M. Rietveld, J. Appl. Crystallogr. 2, 65 (1969), URL http://dx.doi.org/10.1107/S0021889869006558.
- Roisnel and Rodriguez-Carvajal (2001) T. Roisnel and J. Rodriguez-Carvajal, Mater. Sci. Forum 378-381, 118 (2001), URL http://www.scientific.net/MSF.378-381.118.
- Suter and Wojek (2012) A. Suter and B. M. Wojek, Phys. Procedia 30, 69 (2012), URL http://dx.doi.org/10.1016/j.phpro.2012.04.042.
- Shirane et al. (1962) G. Shirane, D. E. Cox, and S. L. Ruby, Phys. Rev. 125, 1158 (1962), URL http://link.aps.org/doi/10.1103/PhysRev.125.1158.
- Moriya (1956) T. Moriya, Prog. Theor. Phys. 16, 23 (1956), URL http://dx.doi.org/10.1143/PTP.16.23.
- Beeman and Pincus (1968) D. Beeman and P. Pincus, Phys. Rev. 166, 359 (1968), URL http://journals.aps.org/pr/pdf/10.1103/PhysRev.166.359.
- de Réotier and Yaouanc (1997) P. D. de Réotier and A. Yaouanc, J. Phys.: Condens. Matter 9, 9113 (1997), URL http://stacks.iop.org/0953-8984/9/i=43/a=002.