Peculiar Radio Structures in the Central Regions
of Galaxy Cluster Abell 585
Abstract
In this paper we analyze the peculiar radio structure observed across the central region of the galaxy cluster Abell 585 (). In the low-resolution radio maps, this structure appears uniform and diffuse on angular scales of ′, and is seemingly related to the distant () radio quasar B3 0727+409 rather than to the cluster itself. However, after a careful investigation of the unpublished archival radio data with better angular resolution, we resolve the structure into two distinct arcmin-scale features, which resemble typical lobes of cluster radio galaxies with no obvious connection to the background quasar. We support this conclusion by examining the spectral and polarization properties of the features, demonstrating in addition that the analyzed structure can hardly be associated with any sort of a radio mini-halo or relics of the cluster. Yet at the same time we are not able to identify host galaxies of the radio lobes in the available optical and infrared surveys. We consider some speculative explanations for our findings, including gravitational wave recoil kicks of SMBHs responsible for the lobes’ formation in the process of merging massive ellipticals within the central parts of a rich cluster environment, but we do not reach any robust conclusions regarding the origin of the detected radio features.
keywords:
radiation mechanisms: non-thermal — galaxies: active — galaxies: clusters: individual: Abell 585 — galaxies: jets — quasars: individual: B3 0727+409 — radio continuum: galaxies1 Introduction
During merging processes leading to the formation of clusters of galaxies, large amounts of gravitational energy are released on timescales of the order of Gyr. Most of this energy is contained in hot (temperatures keV) X-ray–emitting plasma which constitutes, along with the dark matter, the dominant fraction of the intracluster medium (ICM; e.g., Sarazin 1986). In addition to the thermal gas, however, G magnetic fields and ultrarelativistic electrons are present within the ICM as well, manifesting most clearly in extended diffuse radio structures such as giant and mini radio halos in the central parts of clusters, or radio relics at cluster peripheries (see the reviews by Carilli & Taylor 2002; Ferrari et al. 2008; Feretti et al. 2012). These non-thermal constituents of the ICM are believe to be related to the energy dissipation processes enabled by large-scale shocks formed at the outskirts of merging systems, and/or turbulence driven by various mechanisms at early post-merger stages of a cluster lifetime. The presence of (or rather the amount of) hadronic cosmic rays in the diffuse cluster environment is still an open question, being currently probed with new-generation -ray instruments (see, e.g., Aharonian et al. 2009; Ackermann et al. 2010; Aleksic et al. 2010).
Besides radio halos and relics, extended lobes and plumes of radio galaxies make up yet another class of diffuse non-thermal structures often found in the ICM. These are formed due to the jet activity of accreting supermassive black holes (SMBHs) hosted by the cluster galaxies. The large-scale morphologies of such lobes are rarely regular or symmetric, unlike in the case of ‘classical doubles’ typical for poorer (galaxy group) environments. Instead, lobes of cluster radio galaxies are often bent (‘tailed’ radio sources), irregular, or even amorphous, reflecting the dramatic impact of high-pressure ambient medium, high peculiar velocities of parent galaxies, and highly intermittent jet activity of cluster SMBHs (e.g., Miley 1980; see also the discussion in § 5.3 below). Such structures may therefore be considered as useful probes of the dynamical state and structure of the ICM, or even as effective tracers of galaxy clusters at moderate and high redshifts (see, e.g., Mao et al. 2010). Since they are best characterized at low radio frequencies, the operation of the next generation of low-frequency interferometers like the LOw Frequency ARray (van Haarlem et al., 2013) and the Murchison Widefield Array (Tingay et al., 2013) are in this context much anticipated.
Recently, much attention has been given to radio sources located within the central parts of galaxy clusters, since the mechanical energy output of radio-loud active galactic nuclei (AGN) which are hosted by central elliptical (cD) galaxies is widely believed to be responsible for suppressing the cluster cooling flows, quenching the star-formation in cD systems and the growth of their SMBHs (see, e.g., Fabian 1994; Begelman 2004; McNamara & Nulsen 2007). In order to investigate the details of such feedback processes, a precise spectral and morphological characterization of central radio structures and of their surroundings is however obligatory, and this requires deep high-resolution exposures with various instruments operating from radio to X-ray bands. Without such extensive dataset, the physics of the lobes-ICM interactions may remain elusive.
In this paper we analyze the peculiar radio structure observed in the direction of the central parts of the galaxy cluster Abell 585 (). The paper is organized as follows. The galaxy cluster Abell 585 is briefly introduced in § 2. Multi-frequency data for the system are analyzed in § 3, and discussed further in § 4. The interpretation of the obtained observational results is presented in § 5, and the summary of the studies is given in § 6. In the paper we assume modern cosmology with km s-1 Mpc-1, , and (Spergel et al., 2003). All source positions are given in the J2000.0 coordinate system.
2 Galaxy Cluster Abell 585
The cluster of galaxies Abell 585 (another designation ZwCl 0727.1+4057; Zwicky et al. 1961) is centered at and (the corresponding Galactic longitude and latitude of 17788 and +2444, respectively; Abell et al. 1989). The cluster is classified as a (B–M) type II system. The red magnitude of the cluster’s tenth brightest member galaxy is 17.0 mag, and there are in total 35 galaxies with apparent red magnitudes between mag3 and mag5. Abell 585 occupies an area of 26′ in diameter and its richness class is 0 (Abell, 1958). Using the photometric redshifts of galaxies from the Sloan Digital Sky Survey Data Release 6 (SDSS DR6; Adelman-McCarthy et al. 2008), Wen et al. (2009) identified a cluster named WHL J073045.4405038, which overlaps with Abell 585. The photometric redshift of this SDSS cluster is , and the spectroscopic redshift of the brightest cluster galaxy ( mag) is . The total -band cluster luminosity summed over all 27 member galaxies, which are spread over Mpc, is .
In the catalogue of superclusters (SCL; Einasto et al. 2001), Abell 585 together with Abell 580 and Abell 591 appear as a part of the SCL 074, for which the central position is, approximately, [ , ]. Abell 580 is centered at [ , ] at the redshift of , with the diameter ′, (B–M) type II–III, and richness class 1. Abell 591 is centered at [ , ] at the redshift of , with the diameter of ′, morphology system of (B–M) type III, and richness class equal 1. The SCL 074 triplet may therefore represent a rather dynamic merging structure.
3 The Data
The analysis presented in this paper is based on the archival optical, X-ray, and multi-frequency radio data, as described in detail below.
3.1 Optical Data
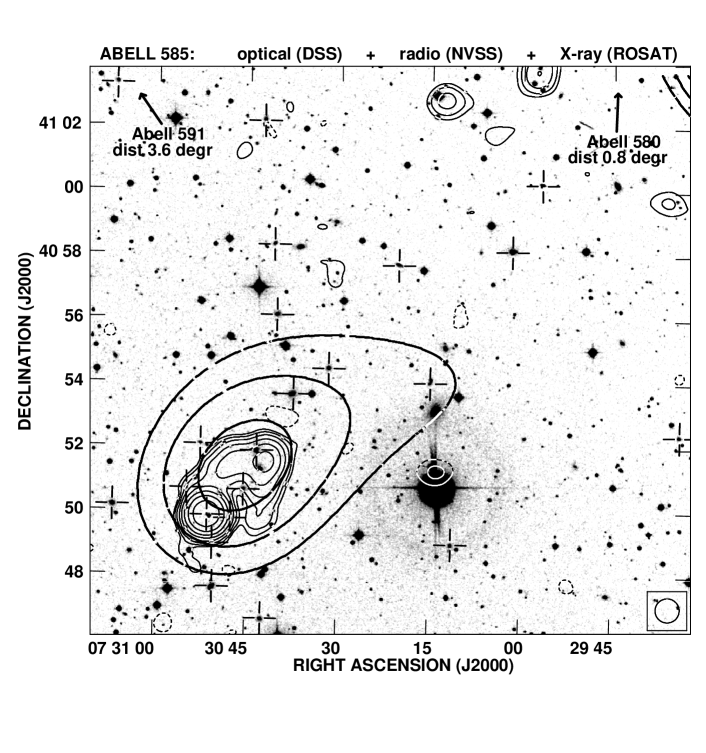
A Digital Sky Survey (DSS) image of the central part of the galaxy cluster Abell 585 is shown in Figure 1, where the cluster member galaxies, as well as the background quasar B3 0727+409 (see Table 1), are marked with the cross symbols. We use the Sloan Digital Sky Survey (SDSS; Gunn et al. 2006) database to locate galaxies and to establish their associations with the Abell 585 cluster based on spectroscopic redshifts from the SDSS DR9 (Ahn et al., 2012). We defined all the member galaxies to have velocities in the range between and km/s (i.e. about 2000 km/s around the velocity corresponding to z=0.12). The redshifts of the member galaxies are provided in Table 1 along with the source positions, -band magnitudes, and central black hole masses estimated by us from the stellar velocity dispersion using the Tremaine et al. (2002) relation except for the black hole mass for B3 0727+409, estimated using the quasar emission lines (see § 5.1). In total, we found 21 galaxies within the 15′ radius (corresponding to a projected linear size of about 4 Mpc) around the central cluster region, plus a luminous face-on spiral with bright optical core lacking any spectroscopic redshift determination, but with the SDSS photometric redshift of and an optical apparent magnitude similar to the cluster member galaxies.
| (J2000.0) | (J2000.0) | ID | |||
| [h m s] | [∘ ′ ″] | [mag] | |||
| (1) | (2) | (3) | (4) | (5) | (6) |
| 07 30 51.35 | 40 49 50.8 | 2.5000000.001000 | Q | 18.645 | 8.520.29 |
| 07 29 33.74 | 40 52 23.0 | 0.1191550.000135 | G | 17.5340.015 | 7.070.16 |
| 07 29 56.73 | 41 00 12.8 | 0.1169850.000148 | G | 17.3680.035 | 7.660.12 |
| 07 30 01.54 | 40 58 07.5 | 0.1173510.000168 | G | 15.9950.019 | 8.410.06 |
| 07 30 11.27 | 40 48 58.7 | 0.1213750.000149 | G | 17.8530.016 | 7.400.15 |
| 07 30 14.88 | 40 54 00.3 | 0.1150380.000143 | G | 17.9050.029 | 7.770.15 |
| 07 30 20.25 | 40 57 40.3 | 0.1160290.000150 | G | 17.0710.012 | 7.920.10 |
| 07 30 31.61 | 40 54 26.4 | 0.1173740.000172 | G | 16.9920.010 | 8.080.09 |
| 07 30 37.37 | 40 53 38.3 | 0.1201590.000164 | G | 16.6520.050 | 8.330.07 |
| 07 30 40.20 | 40 56 06.3 | 0.1175460.000138 | G | 17.1280.017 | 7.330.14 |
| 07 30 40.75 | 40 58 17.8 | 0.1169650.000144 | G | 17.4040.011 | 7.180.16 |
| 07 30 42.37 | 40 46 37.6 | 0.1197200.000853 | Ga | 17.1700.016 | 7.210.16 |
| 07 30 42.59 | 41 02 09.1 | 0.1176630.000161 | G | 17.2820.017 | 8.100.11 |
| 07 30 42.62 | 40 51 17.7 | (0.10300.0149)⋆ | Gb | 16.7210.006 | |
| 07 30 43.28 | 40 51 52.1 | 0.1187390.000166 | Gc | 16.5210.026 | 8.520.07 |
| 07 30 45.43 | 40 50 38.9 | 0.1196750.000139 | G | 17.0090.012 | 7.830.09 |
| 07 30 47.51 | 40 49 44.8 | 0.1186590.000164 | G | 17.3330.015 | 6.970.23 |
| 07 30 50.37 | 40 47 36.6 | 0.1192270.000188 | G | 16.1840.016 | 8.630.05 |
| 07 30 50.46 | 40 48 57.9 | 0.1184760.000143 | G | 17.8260.016 | 7.730.15 |
| 07 30 52.53 | 40 52 04.3 | 0.1137260.000156 | G | 17.8290.026 | 7.110.13 |
| 07 30 54.74 | 40 50 41.6 | 0.1187760.000139 | G | 17.4750.016 | 7.760.11 |
| 07 31 06.91 | 40 50 09.3 | 0.1196120.000142 | G | 17.5330.012 | 8.130.07 |
| 07 31 07.06 | 41 03 18.2 | 0.1170500.000140 | G | 17.4810.017 | 7.320.12 |
(1-2) source position; (3) spectroscopic redshifts from SDSS DR9; (4) source identification (galaxy ‘G’ or quasar ‘Q’); (5) -band SDSS Petrosian magnitude (radius ); (6) black hole mass.
(⋆) only the photometric redshift determination is available;
(a) this galaxy hosts a radio-quiet AGN;
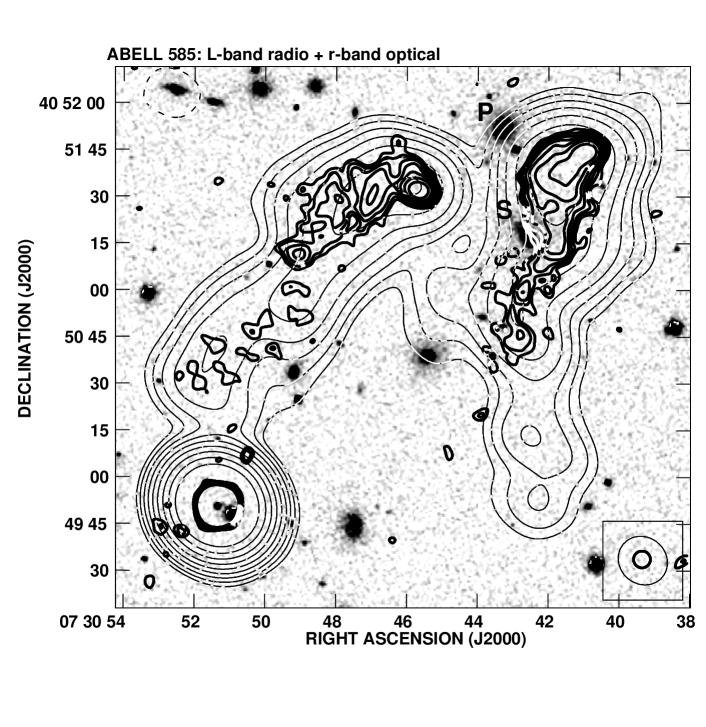
(b) bright face-on spiral marked with ‘S’ in Figure 2;
(c) bright elliptical marked with ‘P’ in Figure 2.
3.2 X-ray Data
In order to characterize the X-ray properties of the galaxy cluster Abell 585, we analyze the data from the ROSAT All-Sky Survey (RASS; Voges et al. 1999, 2000), and in particular the data with seq.id RS931017N00 from the PSPC instrument. We note that currently it is not possible to handle the complete (temporal and spectral) analysis of the scanning mode data from ROSAT, because each individual RASS field scanning-mode observation is a combination of some number of individual PSPC fields. Therefore we re-bin the data from the event file into two energy bands keV and keV, covering in this way the entire ROSAT range. We also chose the spatial binning with the pixel size of ′ (the binning factor of 120) in order to enhance the signal-to-noise ratio.
A weak elongated X-ray structure, with the position of the brightness peak overlapping with that of the highest surface brightness radio structure (see the next section), is pronounced in the high-energy ROSAT map (see Figure 1). The keV flux of the entire ROSAT source is erg cm-2 s-1 when corrected for the Galactic absorption in the direction of the source (Britzen et al., 2007). This level of the X-ray emission is, in principle, consistent with what could be expected from the unresolved core of the radio-loud quasar B3 0727+409, taking into account its radio and optical fluxes. However, as noted above, the detected X-ray structure appears elongated, with the brightness peak shifted by about 2′ north-west from the quasar position. We confirmed the reality of this offset by analyzing the encircled energy function and the PSF blurring effects. We emphasize in this context, however, that even though the astrometric accuracy of source positions for RASS data is about 7″ (Parejko et al., 2008), the position of the X-ray maximum for the feature in question is estimated using the smoothed image which contains only a few source counts, and as such is rather uncertain.
In addition, we check the two observations made with the Swift-XRT which overlapped with the galaxy cluster Abell 585. The XRT data (with the total exposure of 2.2 ksec; Target ID 35951) do reveal some enhanced X-ray emission in the region of interest, but extremely poor photon statistics precludes us from any detailed analysis.
3.3 Radio Data
During the last three decades the vicinity of Abell 585 was mapped in five northern-sky radio interferometric surveys: the National Radio Astronomy Observatory (NRAO) Very Large Array (VLA) Sky Survey at 1400 MHz (NVSS; Condon et al. 1998), the Faint Images of the Radio Sky at Twenty-cm survey at 1400 MHz (FIRST; Becker, White & Helfand 1995), the Westerbork Northern Sky Survey at 327 MHz (WENSS; Rengelink et al. 1997), the 6th Cambridge Survey at 151 MHz (6C; Hales et al. 1993), and the VLA Low-Frequency Sky Survey at 74 MHz (VLSS; Cohen et al. 2007). This area was also covered in the single-dish Green Bank 4850 MHz northern-sky survey (GB6; Gregory et al. 1996). The NVSS map of the cluster reveals the bright point-like core of the background quasar B3 0727+409 along with the arcmin-scale tail extending to the north-west from the quasar position in the direction of the cluster center (Figure 1). The diffuse radio tail looks rather striking, and at first glance seems to represent the one-sided jet/lobe of the background quasar rather than any cluster-related structure. However, those low-angular resolution radio maps are not sufficient to prove or disprove this apparent association. We therefore gathered and analyze all the other available radio data for the source, some with angular resolution superior to that of the NVSS. The observational details for radio data we used in the analysis are provided in Table 2.
| Frequency | Instrument | Observation | Time | Beam | rms | Flux density | Refs. | ||
|---|---|---|---|---|---|---|---|---|---|
| date | on source | The quasar | Total structure | ||||||
| MHz | [min] | [arcsec2] | [mJy beam-1] | [mJy beam-1] | [mJy] | [mJy] | |||
| (1) | (2) | (3) | (4) | (5) | (6) | (7) | (8) | (9) | (10) |
| 73.8 | VLA-B | 2003 Sep 20 | 75 | 75 75 | 67.2 | 1103.520.5 | 1 | ||
| 151.5 | Cambridge | 1977 | 252.0 385.3 | 40.0 | 1090.075.0a | 2 | |||
| 326.8 | WSRT | 1991 Feb 11 | 36 | 54.0 82.6 | 3.3 | 720.338.5 | 3 | ||
| 408.0 | Northern Cross | 1977 Feb-May | 156.0 289.0 | 10.0 | 563.520.0b | 4 | |||
| 1400.0 | VLA-D | 1993 Dec 15 | 0.5 | 45 45 | 0.45 | 362.618.1 | 392.319.6 | 539.727.1 | 5 |
| 1400.0 | VLA-B | 1997 Feb 20 | 3 | 5.4 5.4 | 0.15 | 344.817.2 | 352.417.6 | 6 | |
| 1425.0 | VLA-C | 1994 Oct 25 | 1.3 | 16.4 14.9 | 0.06 | 342.617.1 | 342.717.1 | 7 | |
| 1464.9 | VLA-C | 1993 Jul 09 | 11.5 | 15.3 12.5 | 0.1 | 346.117.3 | 376.918.9 | 7 | |
| 1489.9 | VLA-A/B | 1991 Oct 13 | 2.7 | 4.5 1.5 | 0.04 | 382.319.1 | 401.720.1 | 7 | |
| 2268.3 | VLBA | 1996 Jun 07 | 5.4 | 0.007 0.003 | 0.5 | 421.121.1 | 446.122.3 | 8 | |
| 4710.1 | VLA-B | 1994 Sep 06 | 2.5 | 2.4 1.4 | 0.02 | 414.220.7 | 414.720.7 | 7 | |
| 4850.0 | NRAO93M | 1987 Oct 15 | 216.4 194.0 | 5.4 | 466.027.1 | 9 | |||
| 4995.5 | VLBA | 1998 Feb 08 | 10.5 | 0.002 0.002 | 0.2 | 241.212.1 | 310.115.5 | 10 | |
| 8338.3 | VLBA | 1996 Jun 07 | 5.4 | 0.002 0.001 | 0.5 | 147.57.4 | 311.415.6 | 8 | |
| 8439.9 | VLA-C | 1994 Oct 25 | 1.5 | 2.5 2.3 | 0.04 | 322.616.1 | 322.816.1 | 7 | |
| 14939.9 | VLA-A/B | 1991 Oct 13 | 4.3 | 0.4 0.2 | 0.07 | 316.715.8 | 326.916.3 | 7 | |
| 30000.0 | Torun32M | 2005 Apr–Aug | 1.2 1.2 | 93.05.0 | 11 | ||||
| 43340.0 | VLA-B/C | 2000 Mar 05 | 4.4 | 0.5 0.4 | 0.06 | 95.04.8 | 98.35.1 | 7 | |
Notes: a the peak flux only available; b the original B3 flux density given in the CKL scale (Kellermann et al., 1969) is multiplied by a factor of 1.129 relative to the common Baars scale according to Baars et al. (1977).
References: (1) VLSS: Cohen et al. 2007; (2) 6C: Hales et al. 1993; (3) WENSS: Rengelink et al. 1997; (4) B3: Ficarra, Grueff & Tomassetti 1985; (5) NVSS: Condon et al. 1998; (6) FIRST: Becker, White & Helfand 1995; (7) this paper; (8) Beasley et al. 2002; (9) GB2: Gregory et al. 1996; (10) Helmboldt et al. 2007; (11) OCRA-p: Lowe et al. 2007.
The area of interest has been observed a number of times with the VLA in the past, due to the fact that the quasar B3 0727+409 is a VLA phase calibrator often observed in a snapshot mode (usually a few minutes of integration time; for details see col. 4 in Table 2). Hence, for the purpose of our investigation, apart from the publicly available survey FITS maps (i.e. VLSS, WENSS, FIRST, NVSS and GB2), we analyze available raw unpublished data from the VLA archive (these data are marked with number ‘7’ in col. 10 of Table 2), reducing them using standard procedures with the AIPS package. After preliminary CLEANing of the maps with the routine IMAGR, several iterations of self-calibration were performed to improve the maps’ quality. Finally, the maps were corrected for primary beam attenuation using the PBCOR task. All the resulting flux densities are given in the Baars et al. (1977) scale. The flux densities obtained directly from the FITS maps (either the maps made for the purpose of this investigation, or the maps taken from the surveys) with the Astronomical Image Processing System (AIPS) task TVSTAT or JMFIT (in the case of a point source) are assumed to have the absolute flux calibration errors of 5%; the flux densities taken from the literature are assumed to have the errors as determined in the corresponding references. In the case of the flux density values which had not been measured directly from the FITS maps (e.g. those of the extended structure) but estimated by other means, we propagate the errors of the directly measured flux densities. The resulting flux densities (along with the errors) of the quasar and of the total structure (i.e., quasar extended radio tail) are listed in Table 2. The quasar flux densities are peak and integrated values, in order to clarify any possible contamination from the diffuse emission. The flux density errors of the quasar are calculated by adding the flux measurement errors and the JMFIT errors in quadrature.
The multi-frequency radio data collected here can be divided into three categories: i) those which resolve the quasar core as an isolated source and give proper values of its flux-density (see Table 2, col. 7 and 8), ii) those which give a proper overall image and flux-densities of the entire ‘quasar + extended halo’ structure but have little ability to distinguish individual components as distinct sources (see Table 2, col. 9), and iii) those which have adequate angular resolution to separate and image properly both the quasar core and the extended features but may underestimate the flux densities of the extended components (VLA-B 1400 MHz and VLA-C 1425 MHz observations). The former class of data (i) were used to determine the radio spectrum of the quasar and to examine whether the source is variable or not (for detail see § 4.1). The characterized shape of the quasar continuum allowed us next to subtract the contribution of the quasar core from the total ‘quasar + extended halo’ fluxes evaluated using the second (ii) class of data. In this way we obtained the total spectrum of the extended structure. The latter class of data (iii) allowed us finally to depict morphological details of the extended structure. Furthermore, the VLBA data were used to investigate the small-scale structure of the quasar core (for details see § 5.1).
4 Results
4.1 Overall Radio Structure
Figure 2 presents our VLA image at 1425 MHz of the entire radio source in Abell 585 (the largest angular extent of about 25) with an angular resolution of 15″ along with the 5″ angular resolution 1400 MHz FIRST map. The diffuse feature seen in the NVSS map is now clearly resolved into two cometary-like structures with bright compact ‘heads’ in their northern parts (hereafter the eastern one ‘E’ and the western one ‘W’), and edge–dimmed tails elongated to the south. The high-frequency (e.g., 8439.9 MHz) maps allow us to measure precisely the positions of the heads’ flux maxima as [ , ] and [ , ]. There are no optical counterparts at these positions in the DSS and SDSS maps.
In order to measure the total flux density of the extended emission component (the two cometary-like structures), we first measure the flux densities of the quasar core at different frequencies, and fit the spectrum with a single power-law function, which returns . Next we subtract the fitted quasar spectrum at a given frequency from the integrated flux of the entire structure, obtaining in this way the spectrum of the extended structure only, . This estimate implies a total flux density of the extended structure at 1425 MHz of about 171 mJy, which is consistent with the total flux density measured in the VLA C–array map at 1425 MHz for the western and eastern structures separately (see Figure 2, thick contours), i.e. and mJy, respectively. A small disagreement here may be due to the fact that, as indicated by the multi-epoch radio data, the B3 0727+409 core radio emission is variable, decreasing with time over the last decades, and this trend is particularly clear at 1.4, 5 and 8 GHz. A spectral curvature for the extended component (see the next section) may also play a role.
4.2 Radio Spectra
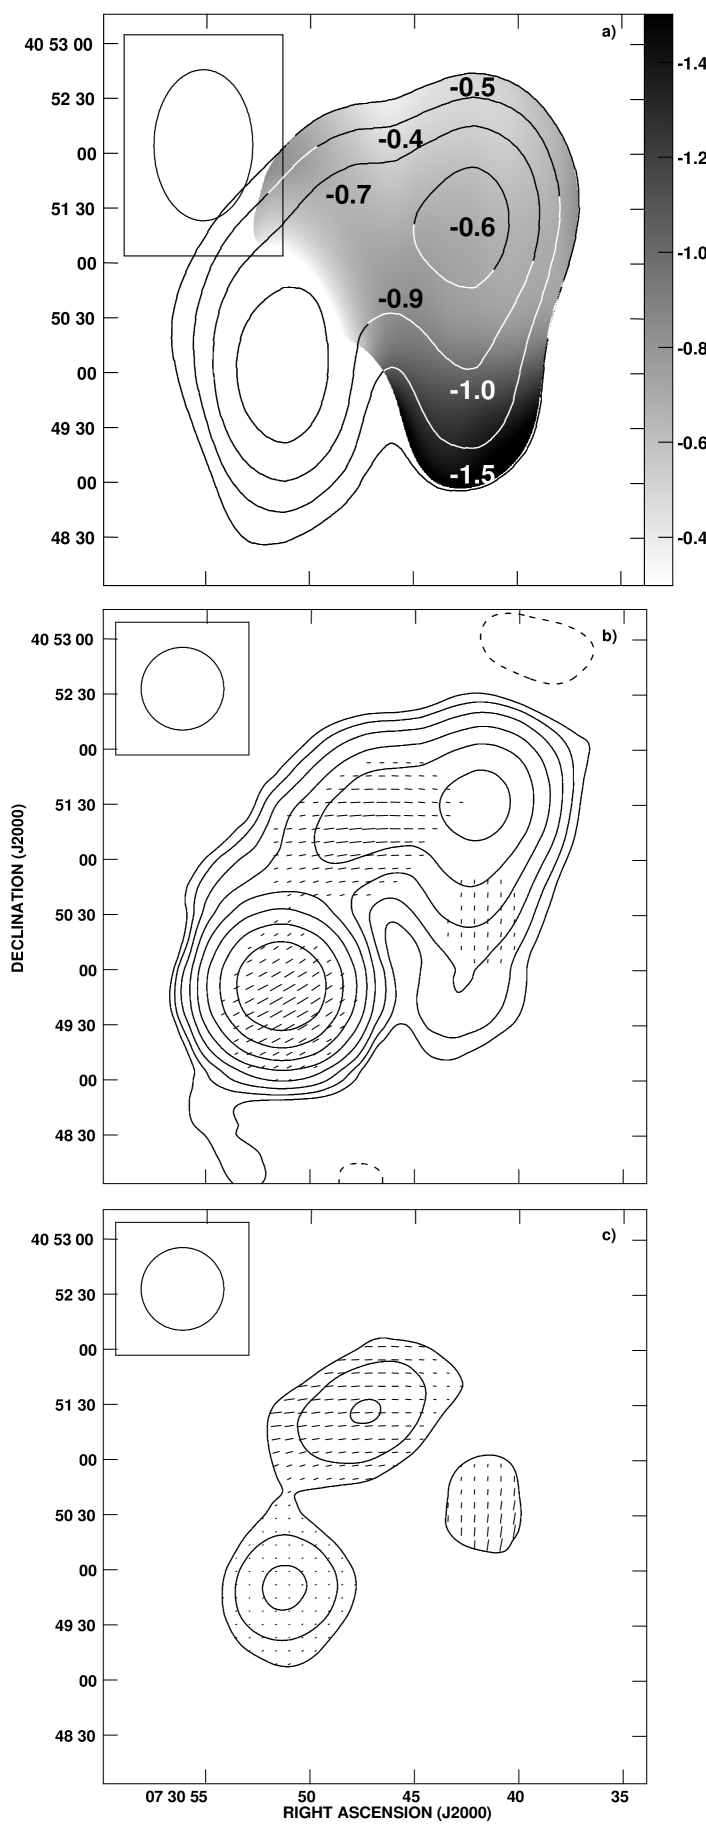
The NVSS and WENSS images — which have similar beam sizes and are sensitive to extended (up to a few arcmin) diffuse structures — were used to create a spectral index map of Abell 585. First, using the AIPS task SAD we subtracted the quasar B3 0727+409 from both maps. Subsequently, the higher resolution map was convolved to the resolution of the 327 MHz map. Since misalignment of the total-power map at two frequencies could produce systematic errors in the spectral-index map, we co-registered the positions of several bright point-like field sources which surround the target source on both maps. Further, both maps were brought to a common scale using the AIPS task HGEOM. Finally, the spectral index map was obtained using the AIPS task COMB. Regions with flux density values below rms were considered to be unreliable and blanked. The final grey-scale map of the spectral index is shown in Figure 3 (a). The map indicates that there is a monotonic steepening of the radio spectrum of the diffuse component from north to south, i.e. from compact ‘heads’ of the two resolved structures along their tails. The trend is not that clear in the case of the eastern tail because of an imperfect subtraction of a point source present around the tail’s southern edge. Such a steepening is a classic spectral signature of an aging synchrotron-emitting plasma in the lobes and plums of radio galaxies, observed in almost all luminous classical doubles (for which the flattest radio spectra are seen at the positions of terminal hotspots, where the injection of fresh particles takes place; e.g., Carilli et al. 1991) and also low-power radio galaxies including tailed sources in galaxy clusters (for which which the flattest radio spectra are seen around the jet base; e.g., Feretti et al. 1998). The radio spectrum of the quasar core is inverted, as expected, with the 327-1400 MHz spectral index of about (defined here as for the flux spectral density ). The mean spectral index over the extended structure is characteristic for lobes and plumes of radio galaxies in general, , and implies a relatively young population of the radio-emitting electrons ( Myr). We note in this context that rather steep radio spectra seen at the south-western outskirts of the structure () may be due to a missing flux in the 1400 MHz interferometric map only. Finally, using the VLA 4710.1 and 8439.9 MHz maps we evaluate the spectral index of the eastern ‘head’ as .
4.3 Polarization Properties
Maps of the linearly polarized intensity and fractional polarization were made by combining the NVSS Stokes and maps with the AIPS task COMB. This allows for the determination of the polarized flux density, the fractional polarization, and the -vectors polarization angle. The total intensity NVSS map with the electric field -vectors superimposed is shown in Figure 3 (b), while Figure 3 (c) presents the linearly polarized intensity map with the vectors of fractional linear polarization superimposed. From these maps it can be seen that the extended structure is mildly polarized. The total integrated polarized flux intensity of the extended source is mJy, which gives about 5% for the mean fractional polarization. The integrated polarized flux density of the compact quasar core is mJy, and the corresponding degree of linear polarization is therefore about 1%. We found different orientations of the electric vectors in different regions of the structure, as well as changes in the levels of polarization across the source. The polarization percentage increasing along the tails (i.e., away from spots W and E to the south), resembles typical polarization properties of tailed radio galaxies (e.g., Feretti et al. 1998; Guidetti et al. 2008, 2010; Pratley et al. 2013). The polarization -vectors, however, are mostly perpendicular to the tails. This indicates that the magnetic field vectors, in the case of negligible rotation measure (RM) values, would be transverse to the resolved structures, unlike in other tailed radio galaxies. Such an ‘unusual’ property may on the other hand simply suggest a substantial rotation of the polarization plane inside the cluster Abell 585. In order to determine the real distribution of the magnetic -field directions, it is necessary to correct the radio data for the Faraday rotation, and for that purpose follow-up radio polarization measurements at other wavelengths with high angular resolution would be needed. The RM of the quasar is rad m-2 (Dennison, 1979). Taylor et al. (2009) claimed a comparable value of rad m-2 for the polarized radio feature located north-west to the quasar; this feature coincides with the diffuse tail extending from our spot/head E. The provided value has to be taken with caution, however, since it was estimated using only two nearby frequencies of 1365 MHz and 1435 MHz.
5 Origin of the Extended Radio Structures
5.1 Quasar Jet?
B3 0727+409 is a luminous radio source with the 1400 MHz power of W Hz-1. Its SDSS spectrum reduced through the standard procedure (see Kuźmicz & Jamrozy 2012) allows us to estimate the mass of the central black hole when using the MgII line, and when using the CIV line. The resulting value is characteristic for radio-loud quasars at high redshifts (e.g., Wilhite et al. 2007; Kuźmicz & Jamrozy 2012). Also the bolometric luminosity of the accreting matter in B3 0727+409 estimated from the MgII line is typical for quasars in general, namely erg s-1, implying high accretion rate (in the Eddington units) for the standard radiative efficiency of the accretion disk.
As mentioned previously, B3 0727+409 is a VLA phase calibrator, but it was also a VLBA phase calibrator. The existing VLBA maps show one-sided nuclear jet oriented toward the extended structure under investigation. Interestingly, the position angles of the nuclear jet and of the extended structure are similar: the former one is 127∘, 125∘, 123∘ at, respectively, 2268.3, 4995.5 and 8338.3 MHz, while the position angle of the extended structure as measured in the FIRST map between the quasar core and the peak of the radio emission in the western ‘head’ [ , ] is 134∘. This agreement may suggest that the extended radio structure observed around the central region of Abell 585 is not related to the cluster, but instead represents the large-scale jet/lobe of the background quasar B3 0727+409, as in fact proposed in Andernach et al. (2012). Additionally in such a case, the X-ray emission seen in the ROSAT data likely extend along the radio structure, and could possibly be accounted for by the jet emission as well since large-scale quasar jets are established luminous X-ray emitters (see Harris & Krawczynski 2006 for a review).
The angular distance between the quasar core and the western radio ‘head’ is 272, which, if the radio structure is at the quasar redshift indeed, corresponds to the linear size of 1.3 Mpc. The de-projected physical size of the large-scale radio structure of B3 0727+409 would be in such a case Mpc, for the anticipated quasar viewing angle ∘and the assumed source intrinsic symmetry. In general, lobes with linear sizes exceeding Mpc, called ‘giant radio sources’, are known to be associated with radio galaxies and quasars even at high redshifts (see Kuźmicz & Jamrozy 2012); the largest object of this kind known to date is characterized by the projected size of about 4.7 Mpc (J14200545; Machalski et al. 2008, 2011). On the other hand, morphological, spectral, and polarization properties of giant radio sources are very different from those of the extended radio structure revealed by the high-resolution radio maps discussed in this paper. Moreover, in the framework of the quasar scenario, the source energetics would be rather extreme, as discussed below.
The 1400 MHz flux of the extended structure mJy (see § 4.1), if produced at the redshift of , gives the monochromatic radio luminosity erg s-1. Since only a moderate beaming for quasar radio jets is expected on large scales, with the corresponding jet bulk Lorentz factors (Wardle & Aaron, 1997), the total emitted radio power of the source would therefore read as erg s-1 for the bolometric correction factor (following from the assumption that the jet radio continuum extends from GHz down to MHz frequencies with the average spectral index of ). This emitted radio power would then require the total jet kinetic power in excess of erg s-1 (assuming the standard jet radiative efficiency), which is close to the maximum rate of the SMBH energy extraction in the system, erg s-1 (McKinney et al., 2012). This power would have to be continuously supplied by the matter accretion for at least Myr, in order to power the Mpc-scale flat-spectrum radio cavity, and this is assuming a rather high jet advance velocity of (see the related discussion in Machalski et al. 2011).
The aforementioned X-ray emission is in this context even more problematic, since the observed X-ray flux erg cm-2 s-1, if due to the quasar jet, implies a very high luminosity erg s-1. Note that any significant beaming which could be invoked to reduce the total emitted power of a jet, would require at the same time very small jet viewing angle, and hence the de-projected linear size of the structure exceeding 10 Mpc. For all these reasons, we consider the quasar scenario for the analyzed extended radio structure implausible.
5.2 Cluster Halo or Relic?
At the redshift of the galaxy cluster Abell 585, the observed 1400 MHz flux of the extended radio structure corresponds to the radio luminosity of erg s-1, which is in the range of radio luminosities for typical cluster radio halos (Carilli & Taylor, 2002; Ferrari et al., 2008; Feretti et al., 2012). However, cometary-like morphologies of two distinct features with clearly defined ‘hotspots’ or ‘heads’ revealed on the high-resolution radio maps, their relatively small sizes kpc (if at ), radio polarization, and relatively flat radio spectra (), are all in a disagreement with such an association.
As we mentioned in § 2, Abell 585 is a member of the SCL 074 supercluster which may represent a dynamic merging structure. The energy dissipated in large-scale shocks during cluster-cluster interactions can be channeled into relativistic electrons and magnetic field (e.g. van Weeren et al. 2012), resulting in a formation of extended radio structures similar to those seen in e.g. Abell 85 (Slee et al., 2001, see § 6 below). Yet the analyzed radio features can be hardly identified with any sort of radio relics, since those elongated or even filamentary radio structures with sizes Mpc are found mostly at the outskirts of galaxy clusters, and, even though polarized, are characterized by very steep radio spectra (; see, e.g., van Weeren et al. 2010).
5.3 Is the structure caused by individual galaxy from the cluster?
Radio-loud AGN typically found in clusters of galaxies are low-power radio galaxies, whose jets and lobes are often distorted and bent, with the characteristic U- or C-shape large-scale morphologies. Such sources are denoted as narrow-angle tail (NAT) and wide-angle tail (WAT) radio galaxies, respectively. The dramatic bending of the jets is due to a combination of a parent galaxy motion within the cluster, and local pressure gradients in the ICM. For the early comprehensive and statistical study of NAT sources see, e.g., O’Dea & Owen (1985a) and O’Dea et al. (1987). The two radio features resolved in our high-resolution radio maps, and especially the western one, do resemble NAT sources taking into account their morphologies, location around the central parts of a dynamical cluster, radio powers ( erg s-1 each), and finally linear sizes of the order of hundreds of kpc. The main problem with this interpretation is the lack of any obvious galaxies which could be identified as hosts of the two radio structures: as already mentioned above, no optical counterparts can be found in the SDSS data at the positions of the two radio ‘heads’, which presumably would mark the positions of any putative radio cores. Moreover, none of the galaxies located within the central parts of the cluster Abell 585 in close proximity to the radio features reveal any signatures of the AGN activity (see Table 1). We have verified this finding by a careful examination of the all-sky mid-infrared (MIR) data provided by the NASA Wide-field Infrared Survey Explorer satellite (WISE; Wright et al. 2010)111The point-spread function of the WISE telescope in four different filters corresponds to a ″ Gaussian; nominal 5 point source sensitivity from 0.08 up to 6 mJy; see also http://wise2.ipac.caltech.edu/docs/release/allsky in the range m. Indeed, all the MIR emitters found in the region of interest correspond to the optically-detected galaxies and the quasar B3 0727+409, and therefore we can exclude a possibility for the presence of heavily-obscured AGN at the positions of the radio cores of the two analyzed radio features.
But can the two resolved radio features be associated with background radio galaxies located at redshifts high enough that their hosts are simply below the flux limit of the SDSS? Using the -band Hubble diagram for 3C galaxies given in Snellen et al. (1996), and the detection limit in the -band SDSS images of (Zehavi et al., 2011), we estimate the minimum redshift of putative parent galaxies in this scenario as . At such high redshifts, the angular size of the radio tails () would correspond to the linear size of Mpc. Keeping in mind that the largest head-tail radio galaxy known to date, peculiar 3C 129 at , is only twice as long (Jägers & de Grijp, 1983), we consider the possibility of two neighboring distant giant tailed radio sources to be very low.
The two cluster member galaxies closest to the cores of the analyzed radio structures with projected separations of about kpc are the giant but otherwise standard elliptical with no prominent emission lines, and the bright face-on spiral with bright optical core (lacking however any spectroscopic redshift determination), designated respectively as ‘P’ and ‘S’ in Figure 2 (see also Table 1). Let us therefore consider a scenario in which the radio structures in question are due to the jet activity of SMBHs which experienced gravitational wave recoil kicks in galaxy merging process within the central parts of Abell 585. The gravitational recoil of merging black holes is widely considered in the literature, typically in the context of the cosmological evolution of SMBHs and the galaxy formation (e.g., Madau & Quataert 2004; Merritt et al. 2004; Baker et al. 2006). Candidate AGN related to this process have been identified based on peculiarities in their line emission (Komossa et al., 2008; Shields et al., 2009; Robinson et al., 2010), or the presence of double nuclei separated by projected distances of a few up to several kpc (Comerford et al., 2009; Jonker et al., 2010; Keeney et al., 2011).
If the gravitational recoil process is of any relevance for the systems analyzed in this paper, the recoil kicks have to be strong enough for a SMBH to be able to escape the gravitational potential of a massive host galaxy (see in this context Komossa & Merritt 2008). Recent numerical simulations indicate that such large recoil velocities exceeding 1000 km s-1 are possible under specific conditions of rapidly spinning black holes with comparable masses and a particular orientation of their spin vectors at small angles to the orbital plane (e.g., Campanelli et al. 2007; González et al. 2007; Baker et al. 2008). And in fact dry mergers of massive ellipticals in central parts of galaxy clusters may provide the required conditions, since such systems are poor in cold gaseous content (while this is the abundant cold gas which is believed to enable an efficient alignment of black hole spins perpendicular to the orbital plane during the merger; see Bogdanović et al. 2007), but on the other hand to contain rapidly spinning SMBHs on average (see in this context, e.g., Volonteri et al. 2007, 2013). One could speculate further that the recoiled SMBHs traveling through the ICM after leaving host galaxies accrete only the hot intracluster gas at low (Bondi) rates, and as such form radiatively inefficient accretion disks; this could potentially explain the apparent lack of any AGN activity at MIR-optical wavelengths at the position of the cores of the analyzed radio structures.
Yet, on the other hand, the probability of having two major mergers in the central parts of a single cluster, within the period overlapping with radiative lifetimes of the two radio galaxies ( Myr; see § 4.2), is very low. There are also no obvious ‘remnant’ pairs of elliptical hosts which should be expected around the positions of the E and W spots in the framework of the gravitational recoil scenario: as emphasized above, only one giant elliptical and one bright spiral are detected within the radius of kpc from the radio cores. Note in this context that powering the lobes with the observed radio luminosities of erg s-1 requires jet kinetic luminosities of the order of, at least, erg s-1, and therefore very high black hole masses for the anticipated low/moderate accretion rates. Hence any association of the discussed radio structures with some low-mass (and as such undetected) hosts seems implausible. In order to justify this statement, we note that with the Bondi accretion rate and the following maximum jet kinetic luminosity , one obtains the limiting black hole mass
where cm-3, K, and are respectively the gas number density, temperature, and sound velocity expected for the central parts of a galaxy cluster.
6 Summary
The peculiar arcmin-scale radio structure observed in the direction of the central parts of the galaxy cluster Abell 585 () is unassociated with the distant () radio quasar B3 0727+409, as we demonstrated here by means of a careful analysis of all the available radio data for the system. This structure consists of two dominant features which resemble typical lobes of cluster radio galaxies of the NAT type. However, we are not able to identify host galaxies of the two features in the available optical (SDSS) and infrared (WISE) surveys. We speculate if the analyzed systems are examples of extreme gravitational recoils of SMBHs in the process of merging massive ellipticals within the central parts of a rich cluster environment, but we do not reach any robust conclusions regarding the origin of the detected radio features.
Large-scale radio structures lacking obvious host galaxies may not be that unique for the local clusters. For example, radio maps of B 1753580 found at the position of Abell 2289 (O’Dea & Owen, 1985b) show two edge-dimmed tails with bright ‘heads’ and with a galaxy located between them (Owen et al., 1995), but without any detectable compact radio core. Slee & Roy (1998) presented a detailed study of the radio structure in cluster Abell 4038 resembling the evolved lobes of a luminous radio galaxy, but with the most likely host elliptical galaxy displaced by about 20 kpc with respect to the central parts of the radio structure. Slee et al. (2001) discussed three other possibly analogous systems in clusters Abell 13, Abell 85, and Abell 133. Inspecting FIRST maps of several galaxy clusters from Koester et al. (2007), we add the case of Max BCG J130.34220+61.21246 () to the literature examples, and note the striking similarity between the radio structures discussed in this paper and those in the cluster MaxBCG J250.34552+38.03597 that lack any optical identifications. There may be more examples of such peculiar structures awaiting discovery with high-resolution multiwavelength radio observations of lesser-known clusters of galaxies in formation.
7 Acknowledgments
We thank the anonymous reviewer for comments which have significantly improved the paper. This research has made use of the NASA/IPAC extragalactic database (NED), which is operated by the Jet Propulsion Laboratory, Caltech, under contract with the National Aeronautics and Space Administration. We acknowledge use of the Sloan Digitized Sky Survey. Ł.S., M.O. and M.J. are supported by Polish NSC grants DEC-2012/04/A/ST9/00083 and DEC-2013/09/B/ST9/00599, respectively. Work by C.C.C. at NRL is supported in part by NASA DPR S-15633-Y.
References
- Abell (1958) Abell, G.O., 1958, ApJS, 3, 211
- Abell et al. (1989) Abell, G.O., Corwin, H.G.Jr, Olowin, R.P., 1989, ApJS, 70, 1
- Ackermann et al. (2010) Ackermann, M. et al., 2010, ApJ, 717, L71
- Adelman-McCarthy et al. (2008) Adelman-McCarthy J.K. et al., 2008, ApJS, 175, 297
- Aharonian et al. (2009) Aharonian, F. et al., 2009, A&A, 502, 437
- Ahn et al. (2012) Ahn C.P., et al., 2012, ApJS, 203, 21
- Aleksic et al. (2010) Aleksic, J. et al., 2010, ApJ, 710, 634
- Andernach et al. (2012) Andernach, H., Jimenez Andrade, E.F., Maldonado Sanchez, R.F., Vasquez Baez, I.R., 2012, in Science from the Next Generation Imaging and Spectroscopic Surveys
- Baars et al. (1977) Baars, J.W.M., Genzel, R., Pauliny-Toth, I.I.K., Witzel, A., 1977, A&A, 61, 99
- Baker et al. (2006) Baker, J.G., Centrella, J., Choi, D.-I., Koppitz, M. van Meter, J.R., Miller, M.C., 2006, ApJL, 653, L93
- Baker et al. (2008) Baker, J.G., Boggs, W.D., Centrella, J., Kelly, B.J., McWilliams, S.T., Miller, M.C., van Meter, J.R., 2008, ApJL, 682, L29
- Beasley et al. (2002) Beasley, A.J., Gordon, D., Peck, A.B., Petrov, L., MacMillan, D.S., Fomalont, E.B., Ma, C., 2002, ApJS, 141, 13
- Becker, White & Helfand (1995) Becker R.H., White R.L., Helfand D.J., 1995, ApJ, 450, 559
- Begelman (2004) Begelman, M.C., 2004, in Ho L.C., ed., Carnegie Observatories Centennial Symposia, Coevolution of Black Holes and Galaxies. Cambridge University Press, p. 374
- Bogdanović et al. (2007) Bogdanović, T., Reynolds, C.S., Miller, M.C., 2007, ApJL, 661, L147
- Britzen et al. (2007) Britzen, S., Brinkmann, W., Campbell, R.M., Gliozzi, M., Readhead, A.C.S., Browne, I.W.A., Wilkinson, P., 2007, A&A, 476, 759
- Campanelli et al. (2007) Campanelli, M., Lousto, C., Zlochower, Y., Merritt, D., 2007, ApJL, 659, L5
- Carilli & Taylor (2002) Carilli, C.L., Taylor, G.B., 2002, ARA&A, 40, 319
- Carilli et al. (1991) Carilli, C.L., Perley, R.A., Dreher, J.W., Leahy, J.P., 1991, ApJ, 383, 554
- Cohen et al. (2007) Cohen A.S., Lane W.M., Cotton W.D., Kassim N.E., Lazio T.J.W., Perley R.A., Condon J.J., Erickson W.C., 2007, AJ, 134, 1245
- Comerford et al. (2009) Comerford, J.M., Griffith, R.L., Gerke, B.F., Cooper, M.C., Newman, J.A., Davis, M.; Stern, D., 2009, ApJL, 702, L82
- Condon et al. (1998) Condon J.J., Cotton W.D., Greisen E.W., Yin Q.F., Perley R.A., Taylor G.B., Broderick J.J., 1998, AJ, 115, 1693
- Dennison (1979) Dennison, B., 1979, AJ, 84, 725
- Einasto et al. (2001) Einasto, M., Einasto, J., Tago, E., Müller, V., Andernach, H., 2001, AJ, 122, 2222
- Fabian (1994) Fabian, A.C., 1994, ARA&A, 32, 277
- Feretti et al. (1998) Feretti, L., Giovannini, G., Klein, U., Mack, K.-H., Sijbring, L.G., Zech, G., 1998, A&A, 331, 475
- Feretti et al. (2012) Feretti, L., Giovannini, G., Govoni, F., Murgia, M., 2012 A&ARv, 20, 54
- Ferrari et al. (2008) Ferrari, C., Govoni, F., Schindler, S., Bykov, A.M., Rephaeli, Y. 2008, Space Science Reviews, 134, 93
- Ficarra, Grueff & Tomassetti (1985) Ficarra, A., Grueff, G., Tomassetti, G., 1985, A&AS, 59, 255;
- González et al. (2007) González, J.A., Hannam, M., Sperhake, U., Brügmann, B., Husa, S., 2007, Physical Review Letters, 98, 231101
- Guidetti et al. (2008) Guidetti, D., Murgia, M., Govoni, F., Parma, P., Gregorini, L., de Ruiter, H.R., Cameron, R.A., Fanti, R., 2008, A&A, 483, 699
- Guidetti et al. (2010) Guidetti, D., Laing, R.A., Murgia, M., Govoni, F., Gregorini, L., Parma, P., 2010, A&A, 514, 50
- Gunn et al. (2006) Gunn, J.E. et al., 2006, AJ, 131, 2332
- Gregory et al. (1996) Gregory, P.C., Scott, W.K., Douglas, K., Condon, J.J. 1996, ApJS, 103, 427
- Hales et al. (1993) Hales, S.E.G., Baldwin, J.E., Warner, P.J., 1993, MNRAS, 263, 25
- Harris & Krawczynski (2006) Harris, D.E., Krawczynski, H., 2006, ARA&A, 44, 463
- Helmboldt et al. (2007) Helmboldt, J.F., et al., 2007, ApJ, 658, 203
- Jägers & de Grijp (1983) Jägers, W.J., de Grijp, M.H.K., 1983, A&A, 127, 235
- Jonker et al. (2010) Jonker, P.G., Torres, M.A.P., Fabian, A.C., Heida, M., Miniutti, G., Pooley, D., 2010, MNRAS, 407, 645
- Keeney et al. (2011) Keeney, B.A., Stocke, J.T., Danforth, C.W., Carilli, C.L., 2011, AJ, 141, 66
- Kellermann et al. (1969) Kellermann, K.I., Pauliny-Toth, I.I.K., Williams, P.J.S., 1969, ApJ, 157, 1
- Koester et al. (2007) Koester, B.P. et al., 2007, ApJ, 660, 239
- Komossa & Merritt (2008) Komossa, S., Merritt, D., 2008, ApJL, 689, L89
- Komossa et al. (2008) Komossa, S., Zhou, H., Lu, H., 2008, ApJL, 678, L81
- Kuźmicz & Jamrozy (2012) Kuźmicz, A., Jamrozy, M., 2012, MNRAS, 426, 851
- Lowe et al. (2007) Lowe, S.R., Gawroński, M.P., Wilkinson, P.N., Kus, A.J., Browne, I.W.A., Pazderski, E., Feiler, R., Kettle, D., 2007, A&A, 474, 1093
- Machalski et al. (2008) Machalski, J., Koziel-Wierzbowska, D., Jamrozy, M., Saikia, D.J., 2008, ApJ, 679, 149
- Machalski et al. (2011) Machalski, J., Jamrozy, M., Stawarz, Ł., & Kozieł-Wierzbowska, D., 2011, ApJ, 740, 58
- Madau & Quataert (2004) Madau, P., Quataert, E., 2004, ApJL, 606, L17
- Mao et al. (2010) Mao, M.Y., Sharp, R., Saikia, D.J., Norris, R.P., Johnston-Hollitt, M., Middelberg, E., Lovell, J.E.J., 2010, MNRAS, 406, 2578
- McKinney et al. (2012) McKinney, J.C., Tchekhovskoy, A., Blandford, R.D., 2012, MNRAS, 423, 3083
- McNamara & Nulsen (2007) McNamara, B.R., Nulsen, P.E.J., 2007, ARA&A, 45, 117
- Merritt et al. (2004) Merritt, D., Milosavljević, M., Favata, M., Hughes, S.A., Holz, D.E., 2004, ApJL, 607, L9
- Miley (1980) Miley, G., 1980, ARA&A, 18, 165
- O’Dea & Owen (1985a) O’Dea, C.P., Owen, F.N., 1985a, AJ, 90, 954
- O’Dea & Owen (1985b) O’Dea, C.P., Owen, F.N., 1985b, AJ, 90, 927
- O’Dea et al. (1987) O’Dea, C.P., Sarazin, C.L., Owen, F.N, 1987, ApJ, 316, 113
- Owen et al. (1995) Owen, F.N., Ledlow, M.J., Keel, W.C., 1995, AJ, 109, 140
- Parejko et al. (2008) Parejko, J.K., Constantin, A., Vogeley, M.S., Hoyle, F., 2008, ApJ, 135, 10
- Pratley et al. (2013) Pratley, L., Johnston-Hollitt, M., Dehghan, S., Sun, M., 2013, MNRAS, 432, 243
- Rengelink et al. (1997) Rengelink, R.B., Tang, Y., de Bruyn, A.G., Miley, G.K., Bremer, M.N., Röttgering, H.J.A., Bremer, M.A.R., 1997, A&AS, 124, 259
- Robinson et al. (2010) Robinson, A., Young, S., Axon, D.J., Kharb, P., Smith, J.E., 2010, ApJL, 717, L122
- Sarazin (1986) Sarazin, C.L., 1986, Reviews of Modern Physics, 58, 1
- Shields et al. (2009) Shields, G.A. et al., 2009, ApJ, 707, 936
- Slee & Roy (1998) Slee, O.B., Roy, A.L., 1998, MNRAS, 297, L86
- Slee et al. (2001) Slee, O.B., Roy, A.L., Murgia, M., Andernach, H., Ehle, M., 2001, AJ, 122, 1172
- Snellen et al. (1996) Snellen, I.A.G., Bremer, M.N., Schilizzi, R.T., Miley, G.K., van Ojik, R., 1996, MNRAS, 279, 1294
- Spergel et al. (2003) Spergel, D.N. et al., 2003, ApJS, 148, 175
- Taylor et al. (2009) Taylor, A.R., Stil, J.M., Sunstrum, C., 2009, ApJ, 702, 1230
- Tingay et al. (2013) Tingay, S.J. et al., 2013, PASA, 30, 7
- Tremaine et al. (2002) Tremaine S. et al., 2002, ApJ, 574,740
- van Haarlem et al. (2013) van Haarlem, M.P. et al., 2013, A&A, 556, 2
- van Weeren et al. (2010) van Weeren, R.J., Röttgering, H.J.A., Brüggen, M., Hoeft, M., 2010, Science, 330, 347
- van Weeren et al. (2012) van Weeren, R.J., Röttgering, H.J.A., Intema, H.T., Rudnick, L., Brüggen, M., Hoeft, M., Oonk, J.B.R., 2012, A&A, 546, 124
- Voges et al. (1999) Voges, W. et al. 1999, A&A, 349, 389
- Voges et al. (2000) Voges, W. et al. 2000, IAU Circ., 7432, 1
- Volonteri et al. (2007) Volonteri, M., Sikora, M., Lasota, J.-P., 2007, ApJ, 667, 704
- Volonteri et al. (2013) Volonteri, M., Sikora, M., Lasota, J.-P., Merloni, A., 2013, ApJ, 775, 94
- Wardle & Aaron (1997) Wardle, J.F.C., Aaron, S.E., 1997, MNRAS, 286, 425
- Wen et al. (2009) Wen, Z.L., Han, J.L., Liu, F.S., 2009, ApJS, 183, 197
- Wilhite et al. (2007) Wilhite, B.C., Brunner, R.J., Schneider, D.P., Vanden Berk, D.E., 2007, ApJ, 669, 791
- Wright et al. (2010) Wright, E.L. et al., 2010, AJ, 140, 1868
- Zehavi et al. (2011) Zehavi, I. et al. 2011, ApJ, 736, 59
- Zwicky et al. (1961) Zwicky, F., Herzog, E., Wild, P., 1961, Vol. 1, Pasadena: California Institute of Technolog