Electrical and optical properties of fluid iron from compressed to expanded regime
Abstract
Using quantum molecular dynamics simulations, we show that the electrical and optical properties of fluid iron change drastically from compressed to expanded regime. The simulation results reproduce the main trends of the electrical resistivity along isochores and are found to be in good agreement with experimental data. The transition of expanded fluid iron into a nonmetallic state takes place close to the density at which the constant volume derivative of the electrical resistivity on internal energy becomes negative. The study of the optical conductivity, absorption coefficient, and Rosseland mean opacity shows that, quantum molecular dynamics combined with the Kubo-Greenwood formulation provides a powerful tool to calculate and benchmark the electrical and optical properties of iron from expanded fluid to warm dense region.
pacs:
52.50.Nr, 52.25.Fi, 52.25.Kn, 71.15.PdI INTRODUCTION
Theoretical modelings and direct experimental measurements of matters under extreme conditions are full of challenges and crucial interests in astrophysics, inertial confinement fusion, as well as materials science Martorell2013 ; Lindl2004 ; Tateno2010 ; Dai2012 . Due to its technological, geological, and sociological importance, iron is one of the most studied materials. Considering liquid iron changes gradually from a compressed into a expanded regime until the density is lowered by a factor of 3 to 5, a continuous transition from the condensed state into a gaseous state can be observed Korobenko2012 ; Clerouin2008 . In this procedure, the expanded metal may lose its metallic properties and change into a nonmetallic fluid. Other thermal properties, i.e., the equation of state, radical distribution function, and optical properties may also vary a lot.
Recently, the development in experimental technique has made it possible to measure the equation of states and electrical resistivity at temperatures of the order of 10000 K Korobenko2007 . For instance, the wide range of the liquid-vapor phase transition was investigated for mercury and alkali metals (Cs and Rb) experimentally Franz1980 ; Kikoin1967 . However, these experiments did not find any discontinuities in thermodynamic functions except for those found in the liquid-vapor phase transition region. It should be noted that recent experiments have performed direct measurements on the electrical resistivity and provided some evidence for the existence of a first-order metal-nonmetal (MNM) transition in liquid aluminum Korobenko2007 ; Clerouin2008 . Then, Korobenko and Rakhel have performed measurements of electrical resistivity and caloric equation of state for fluid iron to investigate the MNM transition induced by thermal expansion Korobenko2012 ; Korobenko2011 . In spite of the dramatic progress, the data reported therein presented a rather narrow range for the internal energy and pressure, and precluded from a precise determination of the characteristic density, where the constant volume derivation changes its sign.
To study the complex behavior of fluid iron from compressed to expanded regime, we have performed quantum molecular dynamics (QMD) simulations in a wide range of density and temperature, including the whole domain where the experimental data were obtained. Here, we show that the QMD simulations combined with the Kubo-Greenwood formulation provide a powerful tool to predict the electrical and optical properties of iron from expanded fluid to warm dense region.
II COMPUTATIONAL METHODS
The basic quantum mechanical density functional theory (DFT) forms the basis of our calculations, and detailed simulations have been performed by using Vienna ab initio Simulation Package (VASP) Kresse1993 ; Kresse1996 . In our calculations, electrons are treated fully quantum mechanically by employing a plane-wave finite temperature DFT within the local spin density approximation (LSDA). The electronic wave functions are calculated with the projector augmented wave framework Blochl1994 . To evolve the ion trajectories, molecular dynamic simulations have been performed in the isokinetic ensemble in full thermodynamic equilibrium, with equal electron and ion temperatures. The electron temperature has been kept constant according to the Fermi-Dirac distribution, and ion temperature is controlled by Nośe thermostat Hunenberger2005 ; Evans1985 . All of the dynamic simulations were lasted 20000 steps with time steps of 2 4 fs with respect to different densities and temperatures. In each step, 32 64 ions are included in a supercell with periodic boundary conditions, ion positions are then updated classically according to the electrostatic forces determined within Kohn-Sham construction. The densities vary from 1.57 g/cm3 to 23.55 g/cm3 ( = 5 ) with temperatures of 4000 to 20000 K. The convergence of the calculations has been checked, and a plane-wave cutoff energy of 600 eV is employed. Brillouin zone sampling was performed at the mean value point Baldereschi1973 .
After equilibrium, ten snapshots have been randomly selected to perform electronic structure calculations, where a Monkhorst-Pack -point mesh is used. Then, the dynamical conductivity is evaluated through Kubo-Greenwood formula as averages of the selected configurations. The dc conductivity () follows from the static limit of . In the Chester-Thellung version Chester1961 , the kinetic coefficients are described as
| (1) |
with being the Fermi-Dirac distribution function and the chemical potential. The electronic thermal conductivity is given by
| (2) |
III RESULTS
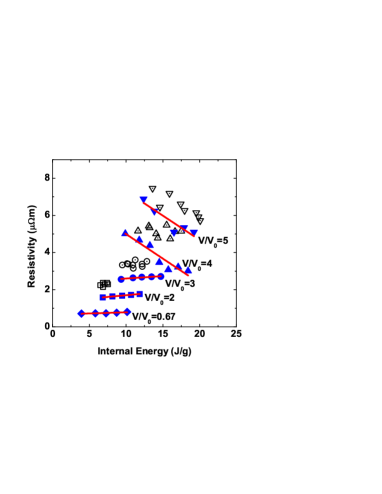
Based on QMD simulations, the general trends of the electrical resistivity as well as the Rosseland mean opacity are concentrated in this work. It is, as a consequence, interesting to explore not only to get insight into the interior physical properties of fluid iron but also to examine a series of theoretical models and experiments. The electrical resistivity versus internal energy along the isochores is shown in Fig. 1. The isochores correspond to the following relative volume values: = 0.67, 2.0, 3.0, 4.0, and 5.0 ( = 7.13 cm3/mol). In the expanded regime, the simulated results are in reasonable agreement with those detected experimentally Korobenko2012 . Resistivity from QMD simulations, which is known to underestimate electronic gap by using LDA Militzer2003 , is underestimated by about 30% compared with experiments. Despite this fact, QMD electrical resistivity still reproduce the general trend observed experimentally. In the compressed and some of the expanded region (), the electrical resistivity increases with the internal energy (temperature) along isochores, and demonstrates a typical behavior of a metal. However, the resistivity decreases with internal energy and resembles the behavior of a semiconductor at larger expansions. The crossover regime locates at the resistivity attaining 3 5 m, which is very close to the values of ()-1 according to the Mott’s criterion Mott1984 for the minimum electrical conductivity for metals.
At relative volumes of , Drude model, which has been demonstrated to well describe the electrical properties of a simple metal around normal density, is used to interpret the optical conductivity spectra in the metallic state for fluid iron. The optical conductivity or ac conductance obtained from QMD simulations can be fitted with the following relationship
| (3) |
where denotes the conducting electron number density, is the electronic charge, is the relaxation time, and is the electron mass.
At lower densities (), the resistivity, characterized by a much larger value in the magnitude than the metallic values, decreases with temperature. In this regime, the central peak of the spectrum for the optical conductivity is shifted, and the Drude-Smith model Smith2001 , which introduces the memory effects of the successive collisions, is more appropriate to fit the QMD results instead of the Drude formula. The one collision time formulation for Drude-Smith model reads
| (4) |
where (between 0 and 1) is the parameter of the memory effect. is negative when the central peak of the optical conductivity is shifted to a positive-energy value. The values =1 and =0 correspond to the vanishing of dc conductivity and the classical Drude model, respectively.
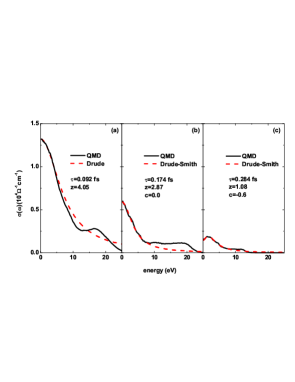
Here, the relaxation time , the number density of the conducting electrons , and parameter have been adjusted to get the best fit for the optical conductivity spectrum from QMD simulations in the low energy range eV. An example of the fit by using Drude formula is shown in Fig. 2 (a) for the compressed fluid with the corresponding parameters of = 0.67 and = 10000 K. A good fit is obtained for the relaxation time = 0.092 fs and the number of the conducting electrons per ion = 4.05. In this case, iron is still a good metal. In the expanded region, the central peak is shifted to about 0.1 eV at = 2 [see Fig. 2 (b)], and a good fit is obtained for = 2.87, = 0.174 fs, = 0.0. At larger expansions, the shift of the central peak and the depression of the dc conductivity become more pronounced. One can find in Fig. 2 (c) for = 5 that the number of conducting electrons per ion (in the Drude description) is reduced to 1.08, and the central peak is shifted to 1.6 eV.
Due to the concurrence of the density and temperature effects, thermal-physical properties of fluid metals from compressed to expanded regime are difficult to be treated theoretically. As a consequence, the MNM transition phenomenon in fluid iron is still a fundamental and long-standing issue. Well accepted values (3000 5000 cm-1) of the minimum dc conductivity for typical metals were determined based on the experimental observations. In this work, we are able to determine this value for fluid iron through the simulated optical conductivity spectrum. The optical conductivity along the isochore can be well fitted by the Drude formula, and therefore corresponding to a good metal. At larger expansions (), the central peak of the optical conductivity spectrum shifts to positive energy values with a remarkable part of the conducting electrons reduced, and nonmetallic states are observed. Thus, the minimum metallic conductivity for fluid iron is higher than 4000 cm-1 (corresponding to ) but it is lower than the dc conductivity at , i.e., 6000 cm-1. We should note that, it is not enough to justify a metallic state merely through the indication of the negative slope, because the simulation results indicate a negative value of even for the isochore .
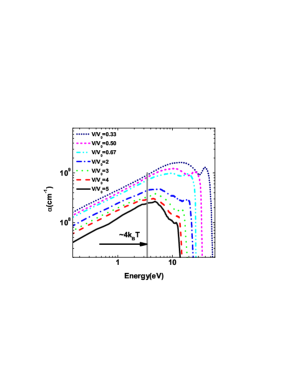
We also investigate the trends in the optical absorption coefficient, which is shown in Fig. 3 along the 10000 K isotherm. Rapid increase in the absorption coefficient has been observed in the photon energy range of a few eV. Let us recall here that in a standard opacity calculation, the free-free contribution (also called inverse bremsstrahlung), which stems from the photon scattering off free electrons belonged to the ionic Coulomb field, governs this feature in the low photon energy region. A classical approximation, known as the Kramers formula, suggests at low densities. In QMD calculations, although the Kubo-Greenwood formula does not explicitly distinguish each contribution to the total absorption coefficient as in a standard opacity calculation, some phenomena clearly indicate that the free-free contribution still works in the low photon energy range. This can be substantiated by first noting from Fig. 3 that the magnitude of the free-free contribution is proportional to . In the low photon energy regime, the absorption coefficients have similar behaviors and vary by an order of magnitude as varies from 1.0 to 4.0. Second, high lying excited states contribute to QMD optical conductivity and absorption coefficient, so that the power law suggested by Kramers formula is not followed by QMD calculations. It is important to stress here that, the power law was built on a classical description of the electron-ion interaction, where an isolated system contains a photon, an electron, and a charged ion without screening from the surrounding media. On the contrary, the Kubo-Greenwood formula used in the present work introduces a one-electron approximation to obtain the optical conductivity within the linear response theory Harrison1970 ; Callaway1974 . The scattering cross sections for an isolated system are included by Kubo-Greenwood formulation Perrot1996 ; Iglesias1996 ; Crowley2001 , and the Kramers formula for the free-free contribution can be superceded by the current QMD simulations.
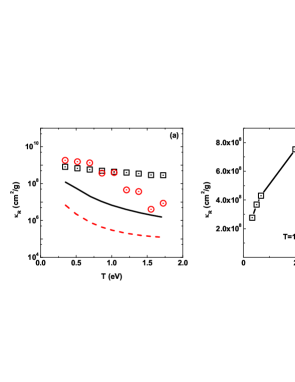
A direct comparison of the Rosseland mean opacities obtained from QMD and from a detailed configuration accounting (DCA) model Yan2002 has been shown in Fig. 4(a). In DCA model, the absorption coefficients are calculated with considering the appropriate isolated atom photoionization (bound-free), inverse bremsstrahlung (free-free), scattering cross sections, and bound-bound transition arrays. In Fig. 4(a), we show a comparison of the QMD and DCA opacities at densities of 0.67 and 4.0 by increasing temperature. As indicated in Fig. 4(a), disagreement exists in the whole thermodynamic regime we explore. The DCA Rosseland mean opacity, which is dominated by the free-free contribution at temperatures of a few eV, decreases with temperature and increases with density. However, in QMD simulations, a crossover region of the mean opacities around 10000 K is observed for the two densities. To get insight into this particular behavior, we show in Fig. 4(b) the variation of the Rosseland mean opacity for a fixed temperature of K, and as the relative volume varies from 0.33 to 5. At , the optical conductivity, as well as the absorption coefficient behaves as a simple metal, thus the Rosseland mean opacity is proportional to around (see Fig. 3). As a result, the increase of the Rosseland mean opacity with relative volume is observed. Beyond the relative volume 3, QMD results show a continuous decrease, which indicates a gradual decrease of the charge carriers in the nonmetal regime. In contrast, DCA calculations do not reveal this crossover region, and the difference can be traced back to the limitation in determining the continuum lowering of the ionization energy and the pressure ionization model used in DCA code.
IV SUMMARY
In summary, we have performed QMD simulations for fluid iron from compressed to expanded region. The calculated resistivity versus internal energy along isochores are in good agreement with the experimental data. The observation of the negative slope of the dependence of the resistivity on internal energy, combined with the shift of the central peak in the optical conductivity, indicates transition of fluid iron into a nonmetallic state. The optical properties of the system are analyzed through the computation of the absorption coefficient and the Rosseland mean opacity, which reveal the continuous decrease in the charge carriers as the system looses its metallic properties. This analysis confirms that, the QMD simulations are powerful tools to validate classical models by providing a consistent set of electrical and optical properties from the same simulation.
V ACKNOWLEDGMENTS
This work was supported by NSFC under Grants No. 11275032, No. 11005012 and No. 51071032, by the foundation for Development of Science and Technology of China Academy of Engineering Physics under Grant No. 2013B0102019, by the National Basic Security Research Program of China, and by the National High-Tech ICF Committee of China.
References
- (1) B. Martorell, L. Vočadlo, J. Brodhold, and lan G. Wood, Science 342, 466 (2013).
- (2) J. D. Lindl, P. Amendt, R. L. Berger, S. G. Glendinning, S. H. Glenzer, S. W. Haan, R. L. Kauffman, O. L. Landen, and L. J. Suter, Phys. Plasmas 11, 339 (2004).
- (3) S. Tateno, K. Hirose, Y. Ohishi, and Y. Tatsumi, Science 330, 359 (2010).
- (4) J. Dai, D. Kang, Z. Zhao, Y. Wu, and J. Yuan, Phys. Rev. Lett. 109, 175701 (2012).
- (5) V. N. Korobenko and A. D. Rakhel, Phys. Rev. B 85, 014208 (2012).
- (6) J. Clérouin and P. Noiret, Phys. Rev. B 78, 224203 (2008).
- (7) V. N. Korobenko and A. D. Rakhel, Phys. Rev. B 75, 064208 (2007).
- (8) G. Franz, W. Freyland, and F. Hensel, J. Phys. 41, C8 (1980).
- (9) I. K. Kikoin and A. P. Senchenkov, Fiz. Met. Metalloved. 24, 843 (1967).
- (10) V. N. Korobenko and A. D. Rakhel, JETP 112, 649 (2011).
- (11) G. Kresse and J. Hafner, Phys. Rev. B 47, R558 (1993).
- (12) G. Kresse and J. Furthmüller, Phys. Rev. B 54, 11169 (1996).
- (13) P. E. Blöchl,Phys. Rev. B 50, 17953 (1994).
- (14) P. H. Hünenberger, Adv. Polym. Sci. 173, 105 (2005).
- (15) D. J. Evans and B. L. Holian, J. Chem. Phys. 83, 4069 (1985).
- (16) A. Baldereschi, Phys. Rev. B 7, 5212 (1973).
- (17) G.V. Chester and A. Thellung, Proc. Phys. Soc. (London) 77, 1005 (1961).
- (18) B. Militzer, F. Gygi, and G. Galli, Phys. Rev. Lett. 91, 265503 (2003).
- (19) N. Mott, Rep. Prog. Phys. 47, 909 (1984).
- (20) N. V. Smith, Phys. Rev. B 64, 155106 (2001).
- (21) W. A. Harrison, Solid State Theorys (Mc Graw-Hill, New York, 1970).
- (22) J. Callaway, Quantum Theory of the Solid States (Academic, New York, 1974).
- (23) F. Perrot, Laser Part. Beams 14, 731 (1996).
- (24) C. Iglesias and F. Rogers, Astrophys. J. 464, 943 (1996).
- (25) B. Crowley and J. Harris, J. Quant. Spectrosc. Radiat. Transf. 71, 257 (2001).
- (26) J. Yan and Z.-Q. Wu, Phys. Rev. E 65, 066401 (2002).