The corona of HD 189733 and its X-ray activity.
Abstract
Testing whether close-in massive exoplanets (hot Jupiters) can enhance the stellar activity in their host primary is crucial for the models of stellar and planetary evolution. Among systems with hot Jupiters, HD 189733 is one of the best studied because of its proximity, strong activity and the presence of a transiting planet, that allows transmission spectroscopy, a measure of the planetary radius and its density. Here we report on the X-ray activity of the primary star, HD 189733 A, using a new XMM-Newton observation and a comparison with the previous X-ray observations. The spectrum in the quiescent intervals is described by two temperatures at 0.2 keV and 0.7 keV, while during the flares a third component at 0.9 keV is detected. With the analysis of the summed RGS spectra, we obtain estimates of the electron density in the range cm-3 and thus the corona of HD 189733 A appears denser than the solar one. For the third time, we observe a large flare that occurred just after the eclipse of the planet. Together with the flares observed in 2009 and 2011, the events are restricted to a small planetary phase range of . Although we do not find conclusive evidence of a significant excess of flares after the secondary transits, we suggest that the planet might trigger such flares when it passes close to locally high magnetic field of the underlying star at particular combinations of stellar rotational phases and orbital planetary phases. For the most recent flares, a wavelet analysis of the light curve suggests a loop of length of four stellar radii at the location of the bright flare, and a local magnetic field of order of 40-100 G, in agreement with the global field measured in other studies. The loop size suggests an interaction of magnetic nature between planet and star, separated by only . The X-ray variability of HD 189733 A is larger than the variability of field stars and young Pleiades of similar spectral type and X-ray luminosity. We also detect the stellar companion (HD 189733 B, from the primary star) in this XMM-Newton observation. Its very low X-ray luminosity ( erg s-1) confirms the old age of this star and of the binary system. The high activity of the primary star is best explained by a transfer of angular momentum from the planet to the star.
1 Introduction
The significant fraction of massive exoplanets that orbit at few stellar radii (hot Jupiters) of the host primary is a challenge for the models of evolution of such systems. Evidence of star-planet interaction (SPI) is, however, still a matter of debate. To first order, hot Jupiters should affect their host stars through both tidal and magneto-hydrodynamical effects (cf. Cuntz et al., 2000; Ip et al., 2004). Both effects should scale with the separation () between the two bodies as (Saar et al., 2004). The interaction between the respective magnetic fields of the hot Jupiter and the star may be a source of enhanced activity that could manifest in X-rays. Transfer of angular momentum from the planet to the star during the inward migration and circularization of the orbit might also affect the stellar dynamo efficiency and thus the intensity of the coronal emission in X-rays.
Evidence of chromospheric activity induced by hot Jupiters in individual cases has been reported first by Shkolnik et al. (2003), with other cases investigated by Shkolnik et al. (2005), Catala et al. (2007), Fares et al. (2010), Fares et al. (2012), Lanza (2009), Lanza et al. (2010), Lanza et al. (2011), Gurdemir et al. (2012) and Shkolnik (2013). On large sample, enhanced chromospheric activity in stars with hot Jupiters has been reported by Krejčová & Budaj (2012), based on the analysis of Ca H&K lines. Kashyap et al. (2008) showed that stars with hot Jupiters are statistically brighter in X-rays than stars without hot Jupiters. On average Kashyap et al. (2008) observed an excess of X-ray emission by a factor of 4 in the hot Jupiter sample. A similar result has been reported by Scharf (2010), who shows a positive correlation between the stellar X-ray luminosity and the mass of their hot Jupiters. However, analysis by Poppenhaeger et al. (2010) and Poppenhaeger & Schmitt (2011) warn against the biases that could affect the results of Kashyap et al. (2008) and Scharf (2010), and suggest that SPI can take place only in specific systems under favorable conditions.
HD 189733 is composed of a K1.5V star at only 19.3 pc from Sun, and an M4 companion at 3200 AU from the primary, orbiting on a plane perpendicular to the line of sight. The primary hosts a hot Jupiter class planet (HD 189733 b) at a distance of only 0.031 AU with an orbital period of d (Bouchy et al., 2005). The proximity of HD 189733 and its transiting planet allow us detailed observations from IR to X-ray bands, making this one of the best characterized systems with a hot Jupiter. In X-rays HD 189733 has been observed with XMM-Newton, Chandra and Swift. In Pillitteri et al. (2010b, 2011) (hereafter Paper I and II, respectively) we investigated the X-ray emission of HD 189733 and discovered signs of tidal/magnetic SPI after the planetary eclipse. In this paper we present the results of the third XMM-Newton observation taken at the secondary transit of the hot Jupiter in the HD 189733 system.
The paper is organized as follows: Sect. 2 presents the target and summarizes our previous results, Sect. 3 describes the XMM-Newton observation and the data analysis, Sect, 4 reports our new results, Sect. 5 discuss them, in Sect. 6 we outline our conclusions.
2 HD 189733: previous X-ray observations
With XMM-Newtonin 2009 and 2011 we observed the eclipse of the planet by the parent star (, being the transit of the planet in front of the star) with the goal of studying star planet interactions (SPI). In both observations a bright flare occurred after the end of the eclipse of the planet, at essentially the same phase.
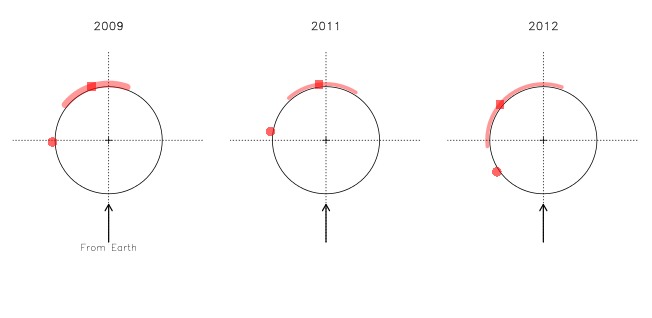
The beginning of the flares observed in HD 189733 in 2009 and 2011 are at phases and , respectively, which coincides with the moment when a region leading the sub-planetary point emerges on the limb of the star (i.e. respectively, see also Fig. 3). Shkolnik et al. (2008) find enhanced chromospheric activity at similar phases (0.7-0.8) opening to a scenario in which a connecting magnetic tube may exist between planet and star and generates enhanced chromospheric activity as modeled by Lanza (2009). Overall, the flares are associated with a modest change of the mean plasma temperature from keV to keV, and a flux change of about a factor two. We point out that the two bright flares observed after the secondary transit of the planet are the brightest flares observed in HD 189733 in all XMM-Newton and Chandra observations. They pass the test of Wolk et al. (2005) for flare detection, while other variability detected at the primary transits does not pass the definition of flares.
The non-detection of the M companion HD 189733B in X-rays indicates very low activity ( erg/s, Paper I). This conclusion is supported by spectroscopy (Guinan, 2013 and Santapaga et al., 2011). Poppenhaeger et al. (2013) detected HD 189733B at a level of , and confirmed its low X-ray activity. In Paper I, we interpreted the difference of activity between HD 189733A and HD 189733B as the result of strong tidal interaction between the planet HD 189733b and the parent star that induced a comparatively fast rotation at a late age of the primary, causing an enhancement of its overall activity. This conclusion agrees with other evidences of induced extra rotation in host stars caused by inward migration and tidal circularization of massive planet orbits. In such systems gyrochronogical method would assign a younger age to these stars (Pont, 2009).
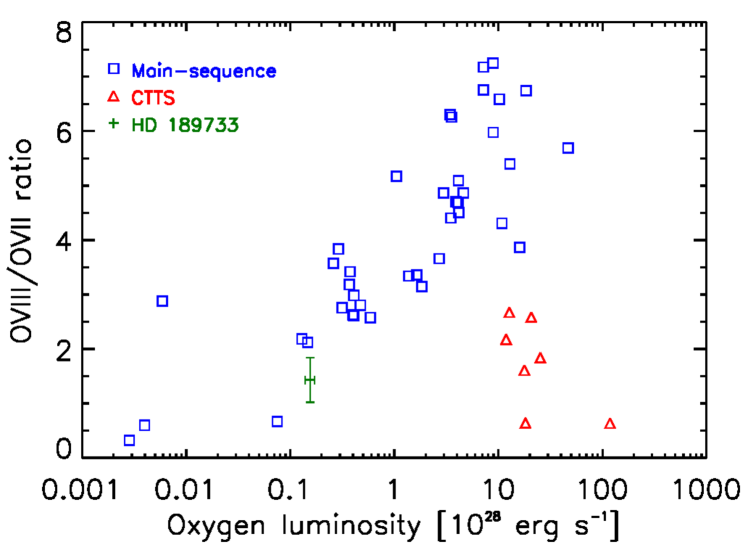
In Paper II, combining the three RGS exposures available at that time (Paper II), we were able to perform high resolution spectroscopy in X-rays of HD 189733 and obtain density diagnostics from O VII and Ne IX He-like triplets. In quiescence, the intercombination line of the OVII triplet is unusually strong, indicating densities cm-3. During the flares, the triplet is marginally consistent with a low density. When comparing the OVII line luminosity and the ratio of the lines of OVIII/OVII species, HD 189733 sits marginally apart from the track of Main Sequence stars. Its high density corona is more similar to that of active pre-Main Sequence stars.
HD 189733 has been monitored with short Swift exposures and Lecavelier des Etangs et al. (2012) reported a strong flare 9 hrs before a transit observed in Sept. 2011 simultaneously with HST and Swift. They reported the detection of an escaping atmosphere of HD 189733b and its variability through a sequence of HST/STIS spectroscopic observations. They suggest that this is due to the interaction of the coronal activity and stellar wind of HD 189733A with the outer atmosphere of its planet.
Poppenhaeger et al. (2013) observed six primary transits of HD 189733b with Chandra. They reported the detection of the planetary transit in X-rays with a significance level of (98% level), and inferred an inflated exoplanet atmosphere larger in X-rays than in the optical band. Despite the longer total exposure time (150ks) with respect to the time devoted to observe the secondary transits, None of the six Chandra exposures (for a total of 150 ks) nor the XMM exposure at the transit ( ks) show bright flares comparable to those seen after secondary transits, while some degree of time variability at a level of is detected during these transits.
3 Observations and data analysis
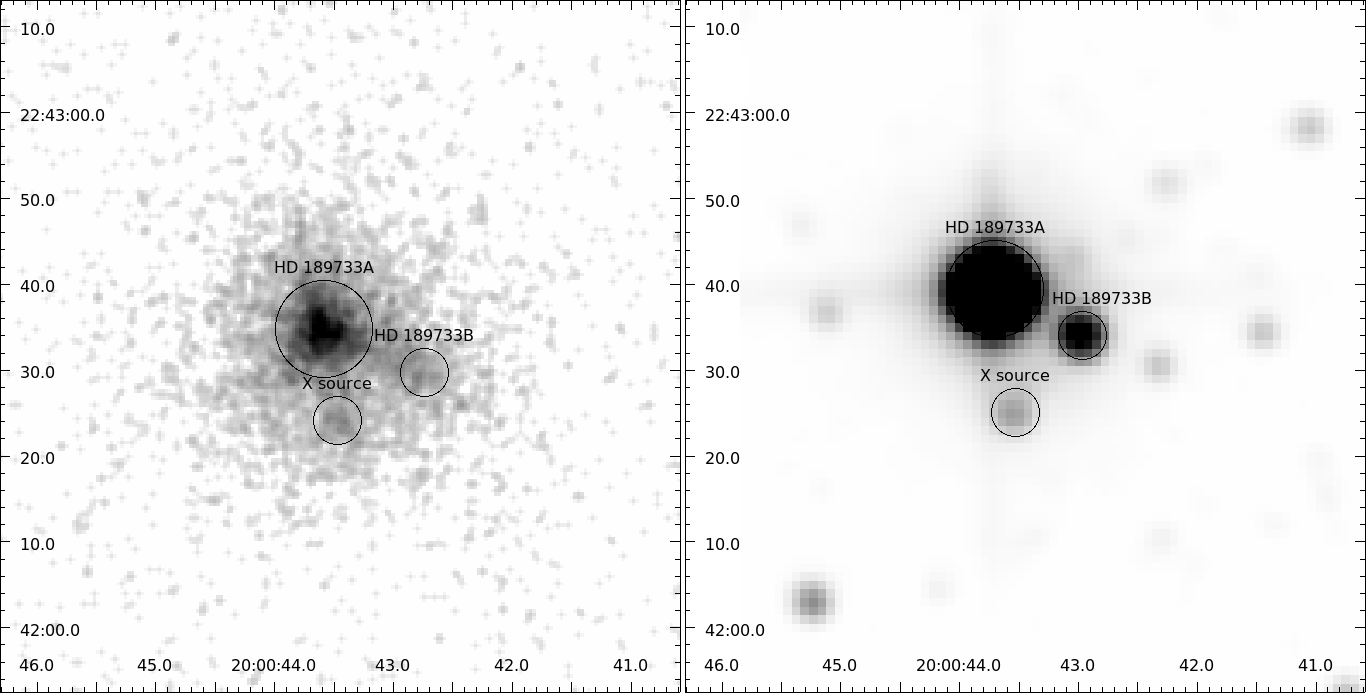
We obtained an XMM-Newton exposure of 61.5 ks with the EPIC camera and the Medium filter on May 7th 2012. The observation encompasses the range of phases , which includes a secondary transit of the planet and subsequent phases. The setup of the observation was chosen identical to that of our two previous XMM-Newton observations. Fig. 1 shows the X-rays image obtained with the present XMM-Newton observation, and the same sky region in the 2MASS-J band. The Observation Data Files (ODF) have been processed with the XMM-Newton Science Analysis System (SAS) software ver. 12.0 to obtain event files with calibration of energy and astrometry. Further filters were applied to select only single and double events (PATTERN ) and FLAG = 0 events as described in the SAS analysis guide. We extracted the events related to HD 189733A in a circular region of of radius, centered on the source PSF centroid. From those events we obtained spectra and light curves. Arrival times of the events have been corrected with the SAS task barycen for timing shifts due to the satellite motion along its orbit.
We extracted the background events in a region at the same distance from the readout node as the source so as to have the same detector response. The spectra have been analyzed with XSPEC software ver 12.8 (Arnaud, 1996; Arnaud et al., 1999), using a combination of two thermal components (APEC, Smith et al., 1999; Brickhouse, 2003) for the best fit procedure. We extracted also the RGS 1 and 2 spectra of HD 189733A and combined them with the RGS spectra obtained in the previous observations to improve the count statistics and to update the results presented in Paper II.
Finally, we applied the wavelet analysis described by Torrence & Compo (1998) and previously applied to XMM-Newton light curves by Mitra-Kraev et al. (2005) and Gómez de Castro et al. (2013). To this purpose, we used the PN light curve binned at 50 s intervals. Further details on the method and the results for HD 189733 are given in Sect. 4.4.1.

4 Results
4.1 Properties of the coronal spectrum
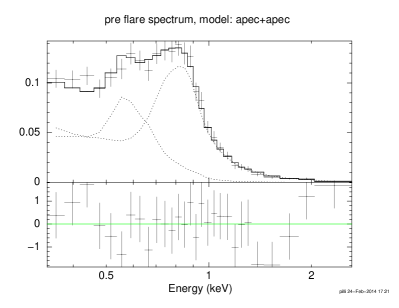
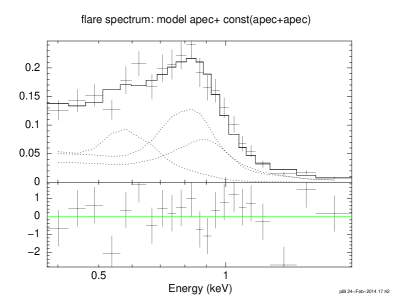
We first looked at the properties of the X-ray emission in terms of plasma temperatures and flux. As we will discuss in sect. 4.4, we observed an intense flare during this observation (Fig. 2) , which resembles very closely the flares recorded in the previous XMM-Newton observations taken at the same planetary phases in 2009 and 2011. We have performed a best-fit modeling of the spectra accumulated before the main flare ( ks), during the flare ( ks) and after the flare ( ks). For the initial and final temporal intervals, we adopted a sum of two thermal components (APEC). For the flare spectrum, we added a third thermal component, keeping fixed the parameters of the other two components to the values found in the first interval, and fitting a scaling factor for the pre-flare model. For the interval post-flare, we tried a fit with three components, and verified that the hottest component present during the flare was no more required for the best-fit of the spectrum.
The results are reported in Table 1 and spectra with models are shown in Fig. 4. the quiescent corona of HD 189733 is well-represented by a thermal model with two main temperatures similar to the findings of Paper II: a cool component with temperature keV and a warm one with keV, with a ratio of their emission measures . During the main flare, an additional hot component () is found, similar to the flares observed in Paper I and II. The flares observed in 2009 and 2011 were bright, accounting for a doubling of , but also cool. Here again the flare corresponds to an increase of the quiescent rate by a factor two, and is best represented by a modest “hot” component ( keV). In the post flare interval the hot component has vanished, and the spectrum is again well described by the cool and warm components of the pre- flare interval. The quiescent PN spectrum recorded in 2009 was described by two thermal components with keV and keV, respectively.
| Year | Phases | Interval | kT1 | kT2 | kT3 | E.M.1 | E.M.2 | E.M.3 | log | log |
| (keV) | (keV) | (keV) | (cm-3) | (cm-3) | (cm-3) | (erg s-1 cm-2) | (erg s-1) | |||
| 2012 | 0.45-0.64 | Pre | 0.19 | 0.7 | – | 10.7 | 8.9 | – | -12.6 | 28.07 |
| 0.64-0.70 | Flare | (0.19) | (0.7) | 0.82 | (10.7) | (8.9) | 7.60 | -12.37 | 28.27 | |
| 0.70-0.77 | Post | (0.19) | (0.7) | 0.72 | (10.7) | (3.6) | 1.3 | -12.54 | 28.11 | |
| 2011 | 0.41-0.52 | Pre | 0.24 | 0.73 | – | 5.8 | 3.6 | – | -12.5 | 28.17 |
| 0.52-0.55 | Flare | (0.24) | (0.73) | 0.9 | (5.8) | (3.6) | 3.0 | -12.36 | 28.29 | |
| 0.55-0.62 | Post | (0.24) | (0.73) | 0.62 | (5.8) | (3.6) | 1.35 | -12.41 | 28.24 | |
| 2009 | 0.45-0.54 | Pre | 0.18 | 0.47 | – | 4.1 | 5.6 | – | -12.50 | 28.15 |
| 0.54-0.60 | Flare | (0.18) | (0.47) | 0.99 | (4.1) | (5.6) | 3.2 | -12.37 | 28.29 | |
| 0.60-0.64 | Post | (0.18) | (0.47) | 0.75 | (4.1) | (5.6) | 1.3 | -12.4 | 28.22 | |
| 2007 | 0.84-1.13 | – | 0.24 | 0.71 | – | 4.7 | 2.8 | – | -12.60 | 28.05 |
4.2 RGS data
The 2012 exposure allows us to add the RGS spectra to the previous datasets and refine the analysis already performed in Paper II. The spectra of the different epochs show similar OVII line strengths, hence we decided to sum them to increase the count statistics. The combined exposure time of all the spectra of RGS detectors is ks, for a total of almost 20,000 RGS counts. A portion of the spectrum around the OVIII and OVII lines is shown in fig. 5, while the fluxes of the lines we measured are given in table 2. The method used for measuring line fluxes is the same adopted in Robrade & Schmitt (2007). Fig. 6 shows the ratio OVIII/OVII vs. O lines luminosity adapted from Robrade & Schmitt (2007) and from Ness et al. (2004). From the intensity ratio of the OVII triplet lines we have measured the electron density (Gabriel & Jordan, 1969) resulting in a density at confidence range of cm-3 ( cm-3 at 90% confidence range). These values are consistent with those derived in Paper II and reveal a quite dense corona, slightly in excess respect to the coronal density values of Main Sequence less active stars. For comparison, the electron density in the solar corona is about of cm-3, and reaches values up to a few cm-3 only during bright flares (Aschwanden & Benz, 1997; Reale, 2007).

| Line | Wavelength | photons | photon flux | |
|---|---|---|---|---|
| Å | erg/s | # | ph s-1 cm-2 | |
| O VII r | 21.60 | 94.4 | 6.6 | |
| O VII i | 21.81 | 45.4 | 3.3 | |
| O VII f | 22.10 | 66.2 | 4.9 | |
| O VIII Ly | 18.97 | 358.3 | 20.0 | |
| Ne X Ly | 12.13 | 36.0 | 1.6 | |
| Fe XVII | 16.78 | 153.0 | 7.4 | |
| Fe XVII | 17.05 | 120.1 | 5.9 | |
| Fe XVII | 17.10 | 26.7 | 1.3 |
4.3 The detection of the stellar companion.
The 60 ks of the 2012 XMM-Newton observation represent a significant improvement of the count statistics over the shorter 2009 and 2011 exposures, and allow us to detect the weak X-ray emission of the stellar M-type companion of HD 189733in the 2012 images. Fig. 1 shows the X-ray image and the 2MASS J band image centered on the HD 189733 system. The detection in X-rays of HD 189733B has been already reported by Poppenhaeger et al. (2013) with an X-ray luminosity of erg/s, and is fully consistent with our upper limit estimate given in Paper I. We performed a source detection process based on wavelet convolution and a multi-scale approach as in Pillitteri et al. (2013, 2010a, 2004); Damiani et al. (2003). We used the sum of the two MOS images only. This choice is motivated by the smaller pixel size of MOS cameras compared to PN camera ( vs. , respectively) that allows us to resolve the faint companion. We detect HD 189733B with a rate of 1.3 ct/ks. We also recover the X-ray source described in Paper I south of HD 189733 A and characterized by a hard X-ray spectrum. The X-ray count statistics of HD 189733B are poor given its low flux, thus we modeled the spectrum with a thermal emission with a component of keV. Interstellar absorption is almost absent as verified with the spectral analysis of HD 189733A, due to the short distance to the system. With PIMMS111http://heasarc.gsfc.nasa.gov/docs/journal/pimms3.html (ver. 4.6c) we obtain a flux of erg s-1 cm-2 and a luminosity of only erg s-1. The flux and the luminosity would be erg s-1 cm-2 and erg s-1 in the case we use keV. These values are fully consistent with the upper limit given in Paper I and with Poppenhaeger et al. (2013), confirming the low activity and the old age of this M4 type star and of the entire binary system. Based on comparison to the sample of M stars studied by Feigelson et al. (2004), we estimate an age of Gyr for the HD 189733 system. Guinan (2013) discussed the age of HD 189733 system and placed its age between 4 Gyr and 8 Gyr based on H emission and other activity indicators. The high activity of the primary star and the gyrochronology estimate of its age are thus at odds with the age of the M companion. This discrepancy can be solved by making the hypothesis that the tidal interaction of planet and parent star has led to a transfer of angular momentum from the planet to the star, leading to rotation rate faster rotation than expected for its age, and thus a boosted stellar magnetic activity level. Lanza (2010) explained the excess of rotation of stars hosting hot Jupiters as due to the interaction of the stellar and planetary magnetospheres that shapes a stellar corona with predominant closed magnetic field lines, hence reducing the rate of stellar wind and the losses of angular momentum during the Main Sequence phase. Similar conclusions where reached by Cohen et al. (2010) based on detailed MHD numerical models.
4.4 Time variability
The light curve of HD 189733 obtained with the PN camera is shown in Fig. 2. We have marked the phases in the top axis and the time of the planetary ingress, middle of secondary transit and egress with vertical lines. In addition, Fig. 3 shows three panels with a schematic of the star and the planetary phases observed with XMM-Newton in 2009, 2011, and 2012. We note a strong variability in the phases subsequent the planet’s occultation, in a striking similarity with what was observed in the observations taken in 2009 and 2011 (cf. Paper I and II). In particular we notice a small flare at , and an intense flare at . Both flares have a decay time of roughly ks. During the decay of the large flare, small secondary bursts are visible superimposed to the main decay. The flickering during the decay was also noticed in the 2009 flare, and is reminiscent of the secondary flares occurring in large arcades on the Sun, where after the first ignition, several bursts are triggered in adjacent loops (e.g. Aschwanden & Alexander, 2001). The main flare has a peak count rate of about times above the average rate at phases just before the flare showing a strict similarity with the flares recorded in 2009 and 2011.
4.4.1 Flare oscillations
Following Zaitsev & Stepanov (1989), the relative amplitude of an oscillation of plasma density in a loop () that is triggered by the evaporating plasma after a flare is determined by the additional energy from filling the magnetic flux tube with hot plasma (Mitra-Kraev et al., 2005):
| (1) |
where is the density of the plasma where the oscillation is occurring, is the plasma temperature and is the magnetic field. Thus, by measuring the relative amplitude of an oscillation one may have an independent measure of the strength of the magnetic field in the loop.
This scenario was assumed by Mitra-Kraev et al. (2005) for a flare observed in the M dwarf AT Mic. During the flare, AT Mic experienced a magneto-acoustic oscillation that was detected in its XMM-Newton light curve, showing . With a temperature MK and a density cm-3, Mitra-Kraev et al. (2005) measured a magnetic field G for the flaring loop, which is in agreement with the results obtained from light curve modeling (e.g. Reale et al., 2004; Reale, 2007; López-Santiago et al., 2010).
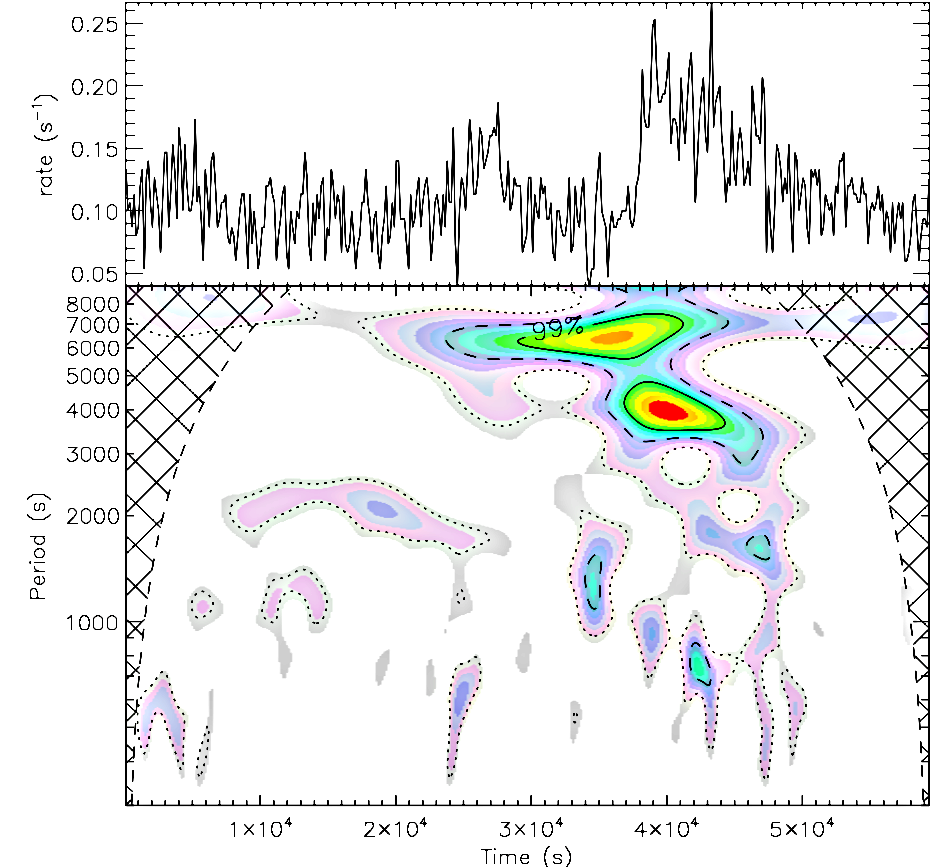
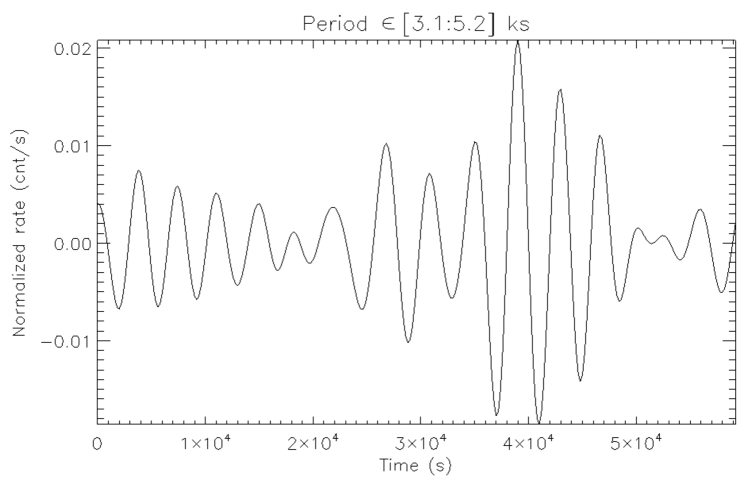
The secondary peaks after the main flare of HD 189733 resemble those observed in AT Mic. In that star, immediately after the flare peak, the light curve remains at a fairly constant count-rate during for approximately 8 ks and then decreases rapidly. During the lapse in which the count-rate remains relatively constant, it shows signs of secondary peaks with periodicity of ks. We applied the same methodology as in Gómez de Castro et al. (2013) to determine the significance of the detection of this oscillation. The whole PN light curve of HD 189733 A was convolved with a wavelet function that is localized in both time and frequency domains (for our case we chose a Morlet function; Torrence & Compo, 1998). The result of the convolution is the 2D power spectrum shown in Fig. 7 (left panel). The oscillation period is clearly detected at ks at the 99% confidence level, with a second (less strong) peak at ks. The whole light curve reconstructed with periods in the range [3.1-5.2] ks is also shown in Fig. 7 (right panel). Qualitatively, this curve recovers most of the features observed in the real data. The figure shows a modulated signal with during the main flare. We assessed the significance of the peak by means of Monte Carlo simulations of constant count rate (equal to the mean of the observed count rate) with injected red noise as a background spectrum. To investigate the possibility of spurious detection of high significance peaks in the frequency domain not related with any physical process, we created a model of light curve with a flare similar to the observed one, and injected random red noise. Then, we applied the wavelet analysis to the resultant (noisy) light curve. This process was repeated up to a thousand times. We did not obtained any significant peak (with significance %) in any simulation during this process other than the peak detected in the real data.
The flare observed in 2009 has characteristics very similar to the flare of 2012. In that observation, but a problem with the telemetry in the data created a gap in the light curve during the flare’s decay. The wavelet analysis on the 2009 flare shows that an oscillation with period of ks could be present also in that flare, but the telemetry loss hampers the significance of this result.
Assuming that the source of oscillation during the flare is a magneto-acoustic wave triggered by the flare and using Eq. 1 with cm-3 (Paper II and Sect. 4.2) and MK as resulting from the analysis of the X-ray data, we determine a magnetic field G. With the 90% confidence range of cm-3, we obtain G, similar to the values of global magnetic field inferred by Fares et al. (2010) through spectropolarimetry.
Under coronal conditions, i.e. low plasma density and strong magnetic confinement, the period of the oscillation is proportional to the loop length () for first order mode (Gómez de Castro et al., 2013). The sound velocity in the plasma is . For an adiabatic gas (), and, hence, cm s-1. According to this result, the loop length is cm or approximately , assuming . This gives a height for the loop of AU. Assuming two foot points on the star, while it is four times smaller than the star-planet separation, this length still constitutes a significant fraction of the distance between the two bodies ().
Another derivation of the loop length is given by following Mathioudakis et al. (2006). The period of a standing, slow-mode oscillation is given by
| (2) |
with in seconds, in Mm and in MK, N the order of the harmonics, with N=1 being the first harmonic. This relation is independent of the density of the plasma and it assumes that the longitudinal speed of the tube is similar to the sound velocity of the plasma, i.e. the magnetic field is dominant over the thermal pressure of the plasma. For s, MK and the first harmonic, cm or approximately , and thus shorter than the length determined previously, but still a significant fraction of the separation between the star and the planet.
In both cases a long loop, larger than the stellar radius, is involved. The size of the loop is larger than those commonly observed on the Sun, and resembles the estimated sizes of loops derived for active stars like Proxima Centauri (Reale, 2007) or in young active stars with disks showing powerful and long-lasting flares (McCleary & Wolk, 2011; Caramazza et al., 2007)). The origin of this loop could be related to the interplay between the magnetic field of the planet and the magnetosphere of the star. This would result in a reconnection event triggered in a loop elongated toward the planet. Detailed MHD simulations by Cohen et al. (2011) show that a plasmoid can be ejected from the star toward the planet under a favorable configuration of the global magnetic field, reinforcing the scenario of a flare event occurring in an elongated loop and triggered by the planet.
4.5 Variability of the X-ray luminosity
To date, we have observed HD189733 for a total of about 130 ks between planetary phases of 0.45 and 0.7. We have identified three bright flares with a peak count rate of more than twice the average level before the flares. Other variability at lower levels is detected in the other observations. We want to assess how this variability compares with the X-ray variability of young active stars, like those of the clusters of Pleiades and NGC 2516, and field stars that are supposed to be coeval with HD 189733. For this purpose, we have considered the PN light curves and the count rates measured in 2007 (at the planetary transit), 2009, 2011, and 2012 observations (at the planetary eclipses). We calculated the cumulative distribution of the variability amplitude of the luminosity, meaning the ratio between the luminosity in each bin of the light curve and its minimum. This distribution can be interpreted as the fraction of time during which the star, on average, is observed with a rate greater than a certain value. A few bins with very low count rate () were discarded because they could have some problems related to the gaps of time intervals (GTIs) not properly corrected by SAS.
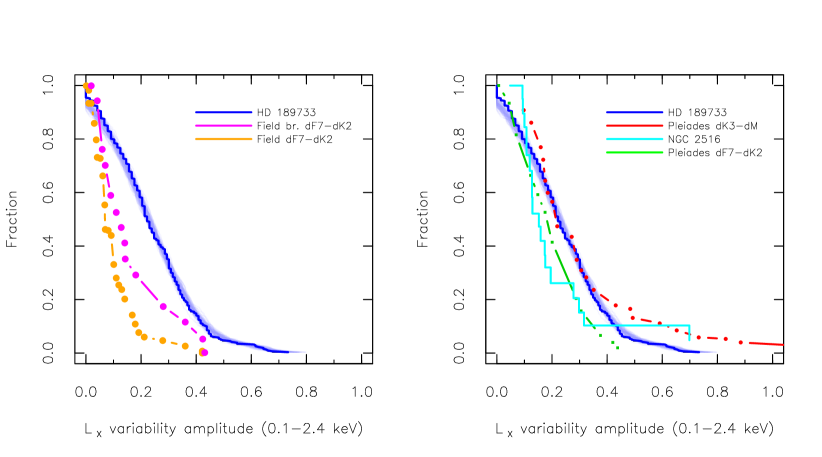
In order to evaluate the effect of uncertainties in each time bin on the overall time variability distribution, we have adopted a Monte-Carlo procedure. We have simulated 1000 values of count rates for each bin, with the mean and sigma equal to the observed mean and standard deviation. From each of the 1000 realizations, we have computed a cummulative variability distribution similar to that of real data, and have determined the extent of the region that can be populated by those distributions (see Fig. 8).
At this point we have evaluated the baseline luminosity and the values of variability amplitude, the final step was to create a cumulative distribution of the values of variability amplitude. We have converted the count rate distributions to fluxes and luminosities. Based on our previous XMM-Newton observations, we can suppose that the quiescent corona has a temperature average of between the two main components (0.2 keV and 0.7 keV, see Table 1) around keV and during the largest flares the temperature rises up to keV. By means of PIMMS (v.4.6a), we set a 1-T APEC thermal model with keV and obtained a rate to flux conversion factor (CF) that we used for the count rates ct/s. Absorption was set to zero given the short distance to the star (19.3 pc). We made the assumption that count rates above 0.12 ct/s are due to some kind of flare activity and the plasma is hotter than in the quiescent phases. We calculated the CF corresponding to keV, and linearly interpolated the values of CFs onto the values of rates between 0.12 and the maximum rate. The difference in CF between 0.4 keV and 1.0 keV is about 25%. From fluxes we derived X-ray luminosities and we calculated the cumulative distribution of variability amplitude shown in Fig. 8. The distribution of variability amplitudes tells that, on average, for about 20% of the time the star shows a luminosity 1.5 times above its quiescent/baseline luminosity because of time variability.
We compare the distribution of variability amplitude with analogous curves derived by Marino et al. (2006) for NGC 2516 (XMM-Newton data), and Marino et al. (2003) for the Pleiades and field stars (ROSAT-PSPC data). Since the latter comparison is with ROSAT data, we derived the fluxes in the ROSAT band (0.1-2.4 keV). Compared to field stars (Fig. 8, left panel), HD 189733 shows a higher variability amplitude. In X-rays, HD 189733 appears more variable than the X-ray brightest G and K type stars in the solar neighborhood. Field stars and dF7-dK2 stars in NGC 2516 (right panel of Fig. 8) vary by up to a factor about 40%, whereas HD 189733 shows variability as high as a factor 80%. Compared with young clusters, HD 189733 is still more variable than late type stars of NGC 2516 and it looks similar to late dK stars of Pleiades. Comparing with active dM stars, we observe that these objects exhibit a higher degree of variability than HD 189733, up to a factor 20, in the 0.1-2.4 keV band (Marino et al., 2000). In summary, HD 189733 shows a X-ray variability different to and more enhanced than in field stars, and it resembles young active stars.

5 Discussion
The most interesting result of our analysis comes from the wavelet reconstruction of the 2012 flare that leads to an estimate of the local magnetic field consistent with Fares et al. (2010), and a long loop as the flare site. A similar finding was obtained for the 2009 flare, although at a lower significance. We can speculate that the presence of the planet can generate a force of tidal and magnetic nature. The passage of the close planet exerts a pulling force on the magnetic loops and on the plasma and can create magnetic reconnection and flares on extended loops. Fares et al. (2010) have estimated the poloidal and toroidal components of the stellar magnetic field through spectropolarimetry at three epochs (2006, 2007, and 2008). At the stellar surface, the magnetic field has predominantly a toroidal component of 20-40 G and some changes between the three epochs are detected. More interestingly, given that the magnetic field at the planet orbit is not uniform, at orbital phases where the field is stronger is more likely for the planet to trigger reconnection events (Fares et al., 2013; Cohen et al., 2011). The strength of the loop magnetic field that we infer is consistent with the Fares et al. estimates. This makes plausible a scenario in which the passage of the planet can trigger reconnection events and stretching of the stellar magnetic field lines.
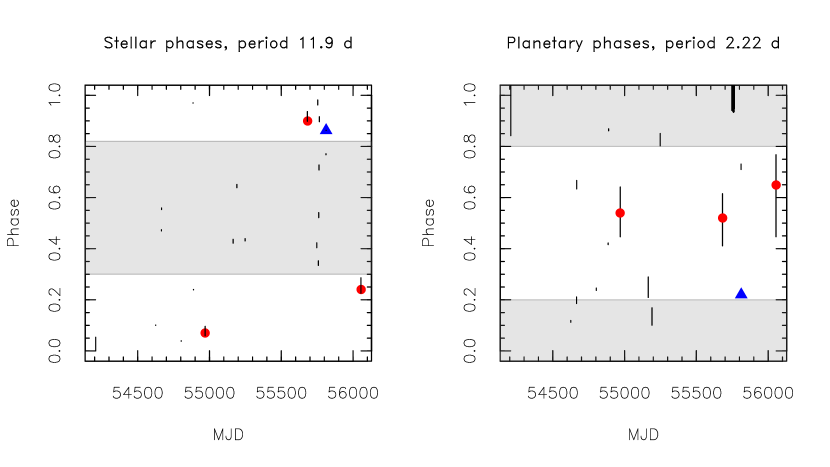
The number of large flares observed in 2009, 2011, and 2012 at phases after the secondary transit appears to be surprising. These flares have a flux about twice the quiescent flux and significance above 3. No similar flares have been observed during the six exposures centered on transits, when variability at a lower level of significance and amplitude is seen (e.g. Poppenhaeger et al., 2013). In Fig. 9 we plot the phases of the stellar rotation and the orbit of the planet as function of the times of the observations obtained with XMM-Newton, Chandra and Swift. The zero point of stellar rotational phases is arbitrarily set at the beginning of the 2007 XMM-Newton observation. For this rotational period we have chosen the value of 11.9 days, reported by Fares et al. (2010) for the equatorial rotational velocity. In the same paper differential rotation is reported with the high latitudes of the star rotating at about 16.5 days. Since the stellar magnetic field has a predominant toroidal component, we expect that the active regions populate a belt around the stellar equator and rotate with the equatorial 11.9 day period. The filled symbols represents the observations with strong flares detected with XMM-Newton and Swift observations (Lecavelier des Etangs et al., 2012). The large flares are observed in a limited range of stellar phases, namely at . At the same time, the planetary phases are at 0.55-0.65 for the three XMM-Newton flares and at 0.2 for the Swift flare. As pointed out before, during the six Chandra observations and the other ten Swift snapshots, such large flares are not seen, so the flares seem to be seen only during half of the planetary phases and half of the stellar rotational phases which driver remains unclear. The stellar rotational phases at which the large flares occur map into stellar longitudes, so that they correspond to the range .
In Fig. 10 we show the fractional and the absolute exposure time of XMM-Newton, Chandra and Swift as a function of the planetary phases. The sum of all the exposure times is ks. The arrows mark the phases where the strong flares occurred. Most of the time has been devoted to observing HD 189733 at the planetary transits. Under the hypothesis that the strong flares are uniformly distributed with respect to the planetary phases, it is expected to observe more flares where the exposure time is higher, so that the fractional time vs. phases can be read as a density probability function of observing the flares. Table 3 gives the expected number of flares based on the density probability distribution obtained from the exposure times vs. curve, the observed number of flares and their significance level in four different phase ranges. We observe both an excess of flares at phase interval plus a deficit in the range with significance of , while the Swift flare is within of the expected number of flares.
Here we find a suggestive analogy with the short term variability observed in Ca II lines by Shkolnik et al. (2008) around phases . When the planet is at phase 0.55 a region on the surface leading about the subplanetary point emerges from the limb. This region could be the site of the X-ray flares and responsible for the enhanced chromospheric activity observed in Ca II lines. Given the motion of the planet, it is expected that the active region should travel at the same rate of the orbital velocity of the planet on the stellar surface, and produce strong flares while on the visible face of the star, or about when the planet is in the range . However, X-ray variability as seen at is not observed around .
Although there in no conclusive evidence of a significant excess of flares after the secondary transits, we still suggest that the planet might trigger such flares only when it passes close to regions of locally high magnetic field on the underlying star at particular combinations of stellar rotational phases and orbital planetary phases.
| Phase range | Expected | Observed | Significance |
|---|---|---|---|
| 0.45 - 0.65 | 1.6 | 3 | 1.1 |
| 0.9 - 0.1 | 1.6 | 0 | 1.3 |
| 0.1 -0.45 | 0.4 | 1 | 1 |
| 0.65 - 0.9 | 0.4 | 0 | 0.6 |
The hypothesis of a locally enhanced magnetic field within a range of stellar longitudes agrees with maps of the stellar magnetic field (Fig. 12 in Fares et al., 2010) and the estimate of the magnetic field in the flaring loop obtained by our wavelet analysis in Sect. 4.4.1. In particular, the configuration of the magnetic field in 2008 given by Fares et al. (2010) shows also two ranges of maxima of the magnetic field with respect to the stellar longitudes. It is also noteworthy that the configuration has changed from 2007 to 2008, opening to the possibility that HD 189733 could have activity cycles on a time scale of a few years.
Our X-ray observations suggest that the configuration of the magnetic field of HD 189733 has a range of stellar longitudes with enhanced field, and that the passage of the planet over these longitudes could trigger high flaring activity. The wavelet analysis of the PN light curve predicts the presence of an extended loop a few stellar radii in length, as derived in the case of active young stars and reinforces the idea that the close-in planet could play a role in triggering extra activity in such structures. The intensity of the magnetic field is of the same order of the global dipolar field of the star. This fact supports the idea that the geometry of the flaring structure is thin and elongated rather than be a small scale structure wrapped around very intense magnetic field close the stellar surface. The way to prove or confute this scenario relies on observations of other intense flares where the wavelet analysis could be applied.
The variability amplitude of HD 189733 is higher than in field stars in the ROSAT band ( keV), at odds with an old age of the star and more similar to young G-K type Pleiades. On the other hand, the detection of the M4 stellar companion at only erg/s puts a lower limit on the age of the system at Gyr. To date, HD 189733 has been observed in X-rays for 170 ks with XMM-Newton, 150 ks with Chandra and 50 ks with Swift. The presence of four intense flares with releases of energy of ergs observed in a total exposure time of ks is remarkable. Very young stars in Orion Nebula Cloud have a flare frequency of only one large flare every ks (Wolk et al., 2005; Caramazza et al., 2007), although those flares have a higher energy budget of about erg.
In summary, the excess of flaring activity, the size of the loop involved, and the X-ray variability amplitude in HD 189733 could be interpreted as consequences of star-planet interaction of magnetic origin. The presence of the planet would induce extra time variability and coronal activity that the star alone could not manifest.
6 Conclusions
In this paper we have reported on the third XMM-Newton observation of HD 189733 at the eclipse of the planet. The main findings of this study are:
-
•
We observed a third strong flare after the secondary transit of the planet.
-
•
A wavelet analysis of the light curve reveals that in this case the flaring structure may be as big as four stellar radii. The magnetic field in this loop is in the range 40-110 G, in agreement with the estimates of global magnetic field of the star derived from spectropolarimetry (see Fares et al., 2010).
-
•
This large length suggests an origin due to magnetic interaction between the star and the close in planet. Qualitatively speaking, a magnetic field associated with the planet can exert a force on the plasma and the coronal loop when the planet passes close to regions of the stellar surface with enhanced magnetic field.
-
•
The detection of the M type companion HD 189733B at level of erg/s confirms the very old age of this star, at odds with the age of the primary estimated from gyrochronology.
-
•
The discrepancy of age between HD 189733A and HD 189733B hints a tidal interaction of the main star with its hot Jupiter and the transfer of angular momentum.
-
•
The updated analysis of RGS data confirms the dense corona of HD 189733 similar to more X-ray luminous and active stars.
In the introduction we have discussed that star-planet interaction could be either of gravitational/tidal or magnetic origin. The difference of age estimates from magnetic activity indicators between the primary and secondary components of the HD 189733 system implies that a tidal transfer of angular momentum must be occurring.
The additional suggestion here is that big flares are seen at specific planetary phases and stellar longitudes. More importantly, the discovery of a magnetic loop of the order of a few stellar radii and thus a significant fraction of the star-planet separation, provides a very strong, although not decisive, evidence of magnetic star planet interaction as well.
References
- Arnaud et al. (1999) Arnaud, K., Dorman, B., & Gordon, C. 1999, in Astrophysics Source Code Library, record ascl:9910.005, 10005
- Arnaud (1996) Arnaud, K. A. 1996, in Astronomical Society of the Pacific Conference Series, Vol. 101, Astronomical Data Analysis Software and Systems V, ed. G. H. Jacoby & J. Barnes, 17
- Aschwanden & Alexander (2001) Aschwanden, M. J. & Alexander, D. 2001, Sol. Phys., 204, 91
- Aschwanden & Benz (1997) Aschwanden, M. J. & Benz, A. O. 1997, The Astrophysical Journal, 480, 825
- Bouchy et al. (2005) Bouchy, F., Udry, S., Mayor, M., et al. 2005, A&A, 444, L15
- Brickhouse (2003) Brickhouse, N. S. 2003, in IAU Joint Discussion, Vol. 17, IAU Joint Discussion
- Caramazza et al. (2007) Caramazza, M., Flaccomio, E., Micela, G., et al. 2007, A&A, 471, 645
- Catala et al. (2007) Catala, C., Donati, J.-F., Shkolnik, E., Bohlender, D., & Alecian, E. 2007, MNRAS, 374, L42
- Cohen et al. (2010) Cohen, O., Drake, J. J., Kashyap, V. L., Sokolov, I. V., & Gombosi, T. I. 2010, ApJ, 723, L64
- Cohen et al. (2011) Cohen, O., Kashyap, V. L., Drake, J. J., et al. 2011, ApJ, 733, 67
- Cuntz et al. (2000) Cuntz, M., Saar, S. H., & Musielak, Z. E. 2000, ApJ, 533, L151
- Damiani et al. (2003) Damiani, F., Flaccomio, E., Micela, G., et al. 2003, ApJ, 588, 1009
- Fares et al. (2012) Fares, R., Donati, J.-F., Moutou, C., et al. 2012, MNRAS, 423, 1006
- Fares et al. (2010) Fares, R., Donati, J.-F., Moutou, C., et al. 2010, MNRAS, 406, 409
- Fares et al. (2013) Fares, R., Moutou, C., Donati, J.-F., et al. 2013, MNRAS, 435, 1451
- Feigelson et al. (2004) Feigelson, E. D., Hornschemeier, A. E., Micela, G., et al. 2004, ApJ, 611, 1107
- Gabriel & Jordan (1969) Gabriel, A. H. & Jordan, C. 1969, MNRAS, 145, 241
- Gómez de Castro et al. (2013) Gómez de Castro, A. I., López-Santiago, J., & Talavera, A. 2013, MNRAS, 429, L1
- Guinan (2013) Guinan, E. F. 2013, Journal of the American Association of Variable Star Observers (JAAVSO), 41, 153
- Gurdemir et al. (2012) Gurdemir, L., Redfield, S., & Cuntz, M. 2012, PASA, 29, 141
- Ip et al. (2004) Ip, W.-H., Kopp, A., & Hu, J.-H. 2004, ApJ, 602, L53
- Kashyap et al. (2008) Kashyap, V. L., Drake, J. J., & Saar, S. H. 2008, ApJ, 687, 1339
- Krejčová & Budaj (2012) Krejčová, T. & Budaj, J. 2012, A&A, 540, A82
- Lanza (2008) Lanza, A. F. 2008, A&A, 487, 1163
- Lanza (2009) Lanza, A. F. 2009, A&A, 505, 339
- Lanza (2010) Lanza, A. F. 2010, A&A, 512, A77
- Lanza et al. (2010) Lanza, A. F., Bonomo, A. S., Moutou, C., et al. 2010, A&A, 520, A53
- Lanza et al. (2011) Lanza, A. F., Bonomo, A. S., Pagano, I., et al. 2011, A&A, 525, A14
- Lecavelier des Etangs et al. (2012) Lecavelier des Etangs, A., Bourrier, V., Wheatley, P. J., et al. 2012, A&A, 543, L4
- López-Santiago et al. (2010) López-Santiago, J., Crespo-Chacón, I., Micela, G., & Reale, F. 2010, ApJ, 712, 78
- Marino et al. (2000) Marino, A., Micela, G., & Peres, G. 2000, A&A, 353, 177
- Marino et al. (2003) Marino, A., Micela, G., Peres, G., & Sciortino, S. 2003, A&A, 406, 629
- Marino et al. (2006) Marino, A., Micela, G., Pillitteri, I., & Peres, G. 2006, A&A, 456, 977
- Mathioudakis et al. (2006) Mathioudakis, M., Bloomfield, D. S., Jess, D. B., Dhillon, V. S., & Marsh, T. R. 2006, A&A, 456, 323
- McCleary & Wolk (2011) McCleary, J. E. & Wolk, S. J. 2011, AJ, 141, 201
- Mitra-Kraev et al. (2005) Mitra-Kraev, U., Harra, L. K., Williams, D. R., & Kraev, E. 2005, A&A, 436, 1041
- Ness et al. (2004) Ness, J.-U., Güdel, M., Schmitt, J. H. M. M., Audard, M., & Telleschi, A. 2004, A&A, 427, 667
- Pillitteri et al. (2011) Pillitteri, I., Günther, H. M., Wolk, S. J., Kashyap, V. L., & Cohen, O. 2011, ApJ, 741, L18
- Pillitteri et al. (2004) Pillitteri, I., Micela, G., Sciortino, S., Damiani, F., & Harnden, F. R. 2004, A&A, 421, 175
- Pillitteri et al. (2010a) Pillitteri, I., Sciortino, S., Flaccomio, E., et al. 2010a, A&A, 519, A34
- Pillitteri et al. (2010b) Pillitteri, I., Wolk, S. J., Cohen, O., et al. 2010b, ApJ, 722, 1216
- Pillitteri et al. (2013) Pillitteri, I., Wolk, S. J., Megeath, S. T., et al. 2013, ApJ, 768, 99
- Pont (2009) Pont, F. 2009, MNRAS, 396, 1789
- Poppenhaeger et al. (2010) Poppenhaeger, K., Robrade, J., & Schmitt, J. H. M. M. 2010, A&A, 515, A98+
- Poppenhaeger & Schmitt (2011) Poppenhaeger, K. & Schmitt, J. H. M. M. 2011, ApJ, 735, 59
- Poppenhaeger et al. (2013) Poppenhaeger, K., Schmitt, J. H. M. M., & Wolk, S. J. 2013, ArXiv e-prints
- Reale (2007) Reale, F. 2007, A&A, 471, 271
- Reale et al. (2004) Reale, F., Güdel, M., Peres, G., & Audard, M. 2004, A&A, 416, 733
- Robrade & Schmitt (2007) Robrade, J. & Schmitt, J. H. M. M. 2007, A&A, 473, 229
- Saar et al. (2004) Saar, S. H., Cuntz, M., & Shkolnik, E. 2004, in IAU Symposium, Vol. 219, Stars as Suns : Activity, Evolution and Planets, ed. A. K. Dupree & A. O. Benz, 355–+
- Santapaga et al. (2011) Santapaga, T., Guinan, E. F., Ballouz, R., Engle, S. G., & Dewarf, L. 2011, in Bulletin of the American Astronomical Society, Vol. 43, American Astronomical Society Meeting Abstracts 217, 343.12
- Scharf (2010) Scharf, C. A. 2010, ApJ, 722, 1547
- Shkolnik et al. (2008) Shkolnik, E., Bohlender, D. A., Walker, G. A. H., & Collier Cameron, A. 2008, ApJ, 676, 628
- Shkolnik et al. (2003) Shkolnik, E., Walker, G. A. H., & Bohlender, D. A. 2003, ApJ, 597, 1092
- Shkolnik et al. (2005) Shkolnik, E., Walker, G. A. H., Bohlender, D. A., Gu, P., & Kürster, M. 2005, ApJ, 622, 1075
- Shkolnik (2013) Shkolnik, E. L. 2013, ApJ, 766, 9
- Smith et al. (1999) Smith, R. K., Brickhouse, N. S., Raymond, J. C., & Liedahl, D. A. 1999, in Bulletin of the American Astronomical Society, Vol. 31, AAS/High Energy Astrophysics Division #4, 735
- Torrence & Compo (1998) Torrence, C. & Compo, G. P. 1998, Bull. Amer. Meteor. Soc., 79, 61
- Wolk et al. (2005) Wolk, S. J., Harnden, Jr., F. R., Flaccomio, E., et al. 2005, ApJS, 160, 423
- Zaitsev & Stepanov (1989) Zaitsev, V. V. & Stepanov, A. V. 1989, Soviet Astronomy Letters, 15, 66
Facilities: XMM-Newton.