The Ultraviolet Attenuation Law in Backlit Spiral Galaxies111Based in part on observations made with the NASA Galaxy Evolution Explorer. GALEX is operated for NASA by the California Institute of Technology under NASA contract NAS5-98034.
Abstract
The effective extinction law (attenuation behavior) in galaxies in the emitted ultraviolet regime is well known only for actively star-forming objects and combines effects of the grain properties, fine structure in the dust distribution, and relative distributions of stars and dust. We use GALEX, XMM Optical Monitor, and HST data to explore the UV attenuation in the outer parts of spiral disks which are backlit by other UV-bright galaxies, starting with the candidate list of pairs provided by Galaxy Zoo participants. New optical images help to constrain the geometry and structure of the target galaxies. Our analysis incorporates galaxy symmetry, using non-overlapping regions of each galaxy to derive error estimates on the attenuation measurements. The entire sample has an attenuation law across the optical and UV which is close to the Calzetti et al. (1994) form; the UV slope for the overall sample is substantially shallower than found by Wild et al. (2011), which is a reasonable match to the more distant galaxies in our sample but not to the weighted combination including NGC 2207. The nearby, bright spiral NGC 2207 alone gives accuracy almost equal to the rest of our sample, and its outer arms have a very low level of foreground starlight. Thus, this widespread, fairly “grey” law can be produced from the distribution of dust alone, without a necessary contribution from differential escape of stars from dense clouds. Our results indicate that the extrapolation needed to compare attenution between backlit galaxies at moderate redshifts from HST data, and local systems from SDSS and similar data, is mild enough to allow use of galaxy overlaps to trace the cosmic history of dust in galaxies. For NGC 2207, HST data in the near-UV F336W band show that the covering factor of clouds with small optical attenuation becomes a dominant factor farther into the ultraviolet, which opens the possibility that widespread diffuse dust dominates over dust in star-forming regions deep into the ultraviolet. Comparison with published radiative-transfer models indicates that the role of dust clumping dominates over differences in grain populations, at this coarse spatial resolution.
1 Introduction
Our understanding of the effects of dust grains in galaxies has increased dramatically with such new capabilities as sensitive far-infrared measures, spatially resolved modeling of the spectral-energy distributions (SEDs) of star/grain mixes, and photometry of resolved galaxies giving independent reddening maps from the stars themselves (Berry et al. 2012, Dalcanton et al. 2012). The emerging starlight is modified in ways which depend crucially on the relative distributions of stars and dust, and on the small-scale structure in the dust.
These factors produce proportionally greater uncertainties in the emitted ultraviolet range, affecting much of the data relevant to galaxy evolution. As extensive HST surveys are allowing exploration of the evolution of galaxy morphology, they can also help track the evolution of the dust content of galaxies if we can connect UV and optical attenuation measures. Existing models have a wide range in the predicted behavior of both dust mass and resulting attenuation with redshift (Calzetti & Heckman, 1999), since dust production, destruction, and the shrinking ISM mass fraction compete in ways that are not well constrained at large redshifts. Broadly, attenuation from SED fits and photometric redshifts has shown a peak at , declining at earlier and later epochs (Rowan-Robinson, 2003). Observationally, fits to SEDs from the UV to FIR by Iglesias-Páramo et al. (2007) indicate that the dust content of low-mass galaxies has increased from to the present, while galaxies at high stellar mass show no such trend. Deep surveys over wide spectral ranges are now deep and wide enough to test models for the evolution of dust. Connection of the history of dust mass to observables must fold in at least implicit knowledge of the dust distribution on both large and small scales.
A result which has found wide applicability is the effective extinction law derived by Calzetti et al. (1994), based on the SEDs of star-forming galaxies. It is relatively flat with wavelength as compared to the behavior found from star-by-star studies, implying that it is strongly affected by the relative distributions of stars and dust and by unresolved fine structure in the dust distribution itself. The UV range is particularly sensitive to these effects, due to the short lifetimes of the stars which dominate the UV light from star-forming systems, and to the inevitable bias in favor of more transparent areas within a finite region of a galaxy (Fischera et al., 2003). Keel & White (2001) found that that measured reddening behavior in two backlit spiral galaxies becomes flatter (grayer) when the data are smoothed over successively larger regions before analysis. Effects of dust structure must be included in SED models in order to retrieve either the intrinsic stellar SED or the effective extinction. Comparison of galaxy disks seen at various angles can provide independent information on some of the distribution issues (i.e. Wild et al. 2011).
This issue highlights the distinction between the observable quantity attenuation, measured on some size scale, and the actual extinction attributable to the grain properties, which is typically manifested in what are essentially point-source measurements of light from individual stars, where mixture and scattering effects are negligible (Witt & Gordon, 2000). In interpreting observations of galaxies, the net loss of direct starlight is often termed extinction, although attenuation or effective extinction are more precise description. Absorption is a property of the grains, while extinction includes both actual absorption and scattering out of the line of sight; we actually measure attenuation (sometimes described as effective extinction), combining these with scattering into the line of sight, potentially important for large areas within galaxies. These essentially coincide when deriving extinction from individual stars, since scattering from a diffuse medium can be negligibly small compared to the light of a star.
For large regions of a galaxy, scattering may be important. Scattering within each galaxy of a pair will be removed by symmetry, so that the asymmetric component of scattering of light from the background galaxy into the line of sight by grains in the foreground system remains a potential concern. As shown by White et al. (2000), this component drops very rapidly with galaxy separation; it also drops with increased clumping of the dust (Witt & Gordon, 2000). The strong forward scattering of local grain populations implies that the scattering contribution may drop strongly again at small galaxy separations as the required scattering angle grows. We note that none of the optical images of our targets show the characteristic bluing toward the edges of dust lanes which is a sign of scattering
We have explored the use of backlit galaxies to measure dust attenuation for local systems, with the utility of the technique extended enormously with the production of a catalog of nearly 2000 such pairs (Keel et al., 2013) based on examination of Sloan Digital Sky Survey (SDSS) images by volunteers within the Galaxy Zoo project (Lintott et al., 2008). This large starting sample allows us to select significant subsamples based on galaxy type or geometry. For this study, we concentrate on systems that are otherwise of limited value in dust studies - spiral/spiral pairs, where the high UV flux of the background spiral makes up for its lack of detailed symmetry compared to E/S0 background systems. Errors in estimating the light loss are unavoidably larger than in the optical using E/S0 background galaxies, so we combine data from multiple systems and, where possible, average along the spiral pattern to suppress fluctuations due to background structure. A key feature of this backlighting approach is that it is weighted by area rather than by the luminosity of embedded stars, values, which is clearly more representative for background sources and may be most directly representative of the effect in emerging radiation when averaging over regions of a galaxy several kpc in size. This approach is explicitly sensitive to a grey component, which is left poorly constrained by purely spectral techniques, and is sensitive to arbitrarily cold dust components. These features make it a useful complement to, for example, far-IR and submillimeter survey results.
For most of our studies of dust in backlit galaxies, we have fairly strict symmetry requirements, so we can trace radial behavior. For this project, since we are most interested in the wavelength behavior of attenuation, we can relax this requirement as long as we can quantify the effects of galaxy asymmetry on our derived attenuation values. Thus, our sample here includes some galaxies showing mild effects of interactions (most notably NGC 2207/IC 2163).
In this paper, we report an extension of backlighting measurements into the ultraviolet, where most previous attenuation results within galaxies are limited either to very nearby systems (Bianchi et al. 1996, Dalcanton et al. 2012) or to actively star-forming galaxies (Calzetti et al., 1994). One motivation for this study is the promise of using similar techniques in deep HST images to compare the dust signatures across a a significant redshift range, where the typical scaling with wavelength might become a dominant factor in comparison with the nearby Universe. Our results trace the UV attenuation into the outer regions of disks, in some cases to areas where the foreground surface brightness is so low that the properties are not affected by features of the foreground galaxies. Where absolute quantities are important, we use the WMAP “consensus cosmology” (Spergel et al., 2003), values, notably H km s-1 Mpc-1.
2 Observations
2.1 Galaxy Sample
To measure dust effects using the backlighting approach in the ultraviolet , we need background galaxies that are UV-bright, which in practice means spiral systems (with their attendant lack of exact symmetry). We considered spiral/spiral galaxy pairs from the large catalog of overlapping-galaxy pairs generated from Galaxy Zoo candidates (Keel et al., 2013). A subset was inspected in detail, based on availability of long GALEX exposures (integration seconds in at least the NUV band), large angular size, and suitability for dust analysis based on symmetry and the geometry of overlap, as evaluated from higher-resolution optical images. Many of these candidates proved unsuitable for dust analysis due to low UV surface brightness in the region of interest, lack of symmetry in the UV, or unfortunate location of UV-bright star-forming regions (identifiable by color as well as brightness).
2.2 Data:
2.2.1 Ultraviolet
Ultraviolet imagery came primarily from the GALEX archive (Martin et al., 2005). GALEX carried a 0.5m telescope, using a dichroic beamsplitter to simultaneously observe in both NUV (1925-2730 Å at half-peak) and FUV (1410-1640 Å) bands. The resolution is approximately 5.0′′ FWHM. For some targets, observed after failure of the far-UV detector, only NUV data are available; for others, the total NUV exposures are significantly longer than for FUV. These factors, combined with the increasingly clumpy structure of galaxies toward shorter wavelengths, means our useful sample size shrinks and error bars grow corresponding between NUV and FUV bands. In practice, we found that only exposures 600 seconds and longer provided sufficient signal-to-noise for our analysis.
For the nearby, bright pair NGC 2207/IC 2163, we use data from the XMM-Newton Optical/UV Monitor (OM; Mason et al. 2001). Its 0.3m primary mirror focuses the image onto a microchannel plate whose output is rapidly read via an intensified CCD, covering a field of 16.2′ square at 0.48′′/pixel. Relevant UV filters for our program are UVW1 (2450-3200 Å), UVM2 (2050-2450 Å), and U, with effective wavelength near 3440 Å . The PSF for the XMM-OM is tighter than for GALEX, with FWHM ′′ in the UV filters. Long integrations are available in the NGC 2207 field: 13380 seconds in UWM2 (roughly corresponding to GALEX NUV) and 8920 seconds in UVW1 (somewhat longer in wavelength than GALEX NUV). The XMM-OM data in , and to a smaller extent , were affected by a reflection artifact from an out-of-field source superimposed the southern part of NGC 2207 (XMM-Newton Community Support Team, 2012); the -band reflection is minor enough that we can analyze this image, but we use the ground-based data rather than XMM-OM . Suitable data are not available to extend analysis of this system to shorter wavelengths; GALEX observed NGC 2207 in the FUV only during its all-sky survey, and a long NUV exposure was obtained only after failure of the FUV detector.
2.2.2 Optical
We have obtained new optical images of many candidate galaxy pairs; often the higher resolution and signal-to-noise ratio help make the interpretation clear, even when the attenuation measurement for this project is limited to the resolution of the UV images. When no absorption is detected in the optical images, we infer that the galaxy in question lies in the background of the pair. The new images came from several sources.
Most images came from the 3.5m WIYN telescope with OPTIC fast-guiding camera (Tonry et al., 2002), which provides a 10′ field sampled with 0.14′′ pixels. We used this system in three sessions from April 2008 to May 2010. Image quality usually ranged from 0.5-0.8′′ FWHM; for most fields, bright stars were available allowing us to use the system’s on-chip high-speed guiding. Passbands were and ; fringing from night-sky emission in the was corrected using median-combined frames to generate a reference pattern. For most pairs, exposures were min in and 10 min in .
The KPNO 2.1m telescope was used at its Ritchey-Chretien focus, in April and May 2012. A TI CCD provided a field of 11′ at 0.305′′/pixel, slightly vignetted at one edge. Galaxy pairs were generally observed in (20 min) and (10 min) bands.
For the nearby southern pair NGC 2207/IC 2163, we used the SARA-S remotely-operated 0.6m telescope at Cerro Tololo. An Apogee camera with a Kodak CCD provided a field 10.3′ on a side at 0.61′′/pixel, with filters. Image quality ranged from 1.9′′ FWHM at to 2.1′′ FWHM at .
For VV 488 = MCG -02-58-11, we use the and images from the CTIO 1.5m telescope reported by White et al. (2000).
It proved crucial to have these optical data at substantially higher resolution and signal-to-noise ratio than the UV images. They show the context of each system and its level of symmetry (or departures from symmetry) so that we can interpret the UV data with much greater confidence. The optical images were analyzed to yield maps of estimated attenuation at their full resolution, or discover limiting factors which prevented doing so. In some cases, despite a favorable geometry of the two galaxies, the optical data show no attenuation in the apparent foreground galaxy (so either this is the background system or there is very little dust along the backlit lines of sight). Some others are too distorted to apply any of our symmetry approaches. Consequently, a comparatively small set of backlit galaxies provides our information on the UV attenuation and its wavelength dependence. These categories of pairs are listed in Table 1 (for those with UV attenuation measures) and Table 2 (not suitable for such measures; some of these are still suitable for optical analysis).
2.3 Analysis methods
As set out by, for example, White & Keel (1992), White et al. (2000), and Holwerda et al. (2009), the basic technique for retrieving attenuation from an overlapping galaxy system relies on the expression
where is the observed intensity at a given point, and and represent estimates of the intensities of foreground and background galaxy light without any attenuation (using symmetry considerations). We often find it useful to work in transmission rather than optical depth , since the errors from statistics of the data are better behaved and more symmetric than for . We neglect effects of scattering; the relevant effect comes from the difference in light from the background galaxy scattered by the foreground between the region under analysis and its symmetric point, which declines very steeply with the line-of-sight separation between the galaxies (White et al., 2000). Depending on the structure of the galaxies and quality of the data available, we use one of three techniques exploiting different levels of symmetry to estimate the foreground and background contributions to the light at each point.
Ellipse fitting: here we model one or both galaxies by fitting ellipses at small steps in semimajor axis to the isophotes, then interpolating to make model two-dimensional images; we use the ellipse and bmodel tasks within IRAF/STSDAS222IRAF is distributed by the National Optical Astronomy Observatory, which is operated by the Association of Universities for Research in Astronomy (AURA) under cooperative agreement with the National Science Foundation. STSDAS is a product of the Space Telescope Science Institute, which is operated by AURA for NASA, which implement the algorithm from Jedrzejewski (1987). Errors in the estimates are are generated by propagating the scatter in values along the relevant isophotal ellipses for each galaxy, propagating the standard deviation of these values through calculations of transmission and optical depth .
Point symmetry: where the galaxies do not have the detailed symmetry needed for the other techniques, we use simple symmetry by rotating each galaxy image by 180∘, either for a full mapping of the attenuation or measurement averaged over a resolved region. The error in modeling each galaxy in this way is evaluated by the scatter in apertures of the same size located elsewhere on the relevant isophote for each galaxy
Arm tracing: here we assume that spiral arms have similar intensity profiles with radius, using arms in a non-overlapped region as a guide to the behavior of ridge-line intensity with radius and the scatter due to fine-scale structure in the arms as evaluated at the relevant spatial resolution. Then the estimate of the non-backlit profile of an arm is taken by scaling the reference arm profile to match non-backlit parts of the arm being analyzed, allowing intensity scaling. Our technique for doing this starts by interactive marking of a number of points on the ridgeline of each arm using a long-wavelength image ( or ). These points are interpolated in polar coordinates centered on the galaxy nucleus, sampled typically at 1∘ intervals. Then we can work with one-dimensional (resampled) profiles of intensity along each spiral arm as a function of position angle . The reference arm can be smoothed (typically using a median filter) to reduce the impact of discrete star-forming regions on the profile shape. The error expected in using this as a model of the arm being analyzed is taken from the scatter about the mean shape for multiple independent pieces of the reference arm, of the same angular extent as the dust regions being measured. This approach reduces our sensitivity to differences in the normalization of arm intensity or departures from exact symmetry in otherwise grand-design spirals.
Images were aligned using stars in common between optical and UV fields (or in a few sparse fields, using galaxy nuclei plus scale and orientation parameters known from other fields). We rebinned the UV data to the scale of the optical images to avoid loss of information, and smoothed the optical data to the resolution of the UV images with the appropriate Gaussian kernel measured using stars in both image sets. Our general approach was to use the optical images, with better resolution and signal-to-noise ratio, to guide our understanding of each pair’s geometry, and then do identical processing on registered and PSF-matched optical and UV images to retrieve attenuation values for matching pieces of the galaxies.
To avoid potential biases in sample properties, we evaluated the suitability of each pair for these measurements before measuring transmission. This was based based on geometry, surface brightness in the overlapping areas, and absence of UV-bright knots in a position to distort measures in the overlap area. The regions analyzed were selected based on optimal location for backlighting (combining background surface brightness with line of sight penetrating well into the foreground disk) and evidence for dust from the higher-resolution optical images, to avoid contamination by (false) null detections from galaxies which actually lie in the background.
3 Extinction measures - individual systems
3.1 NGC 2207/IC 2163
This pair is a very nearby interacting system. Extinction in the outer arms of NGC 2207 where they cross in front of IC 2163 was addressed by Elmegreen et al. (2001). Using the spatial resolution of HST data, they found diffuse “intercloud” dust along the arms with , and relatively discrete clouds with . The interaction between these galaxies has been modeled extensively. incorporating both morphological and kinematic information, with the most prominent distortion being the ocular form of IC 2163 (Elmegreen et al., 1995) This has, so far, left both galaxies symmetric enough to allow retrieval of dust attenuation in two arms of NGC 2207, since the foreground arms are relatively dim where seen against bright parts of IC 2163.
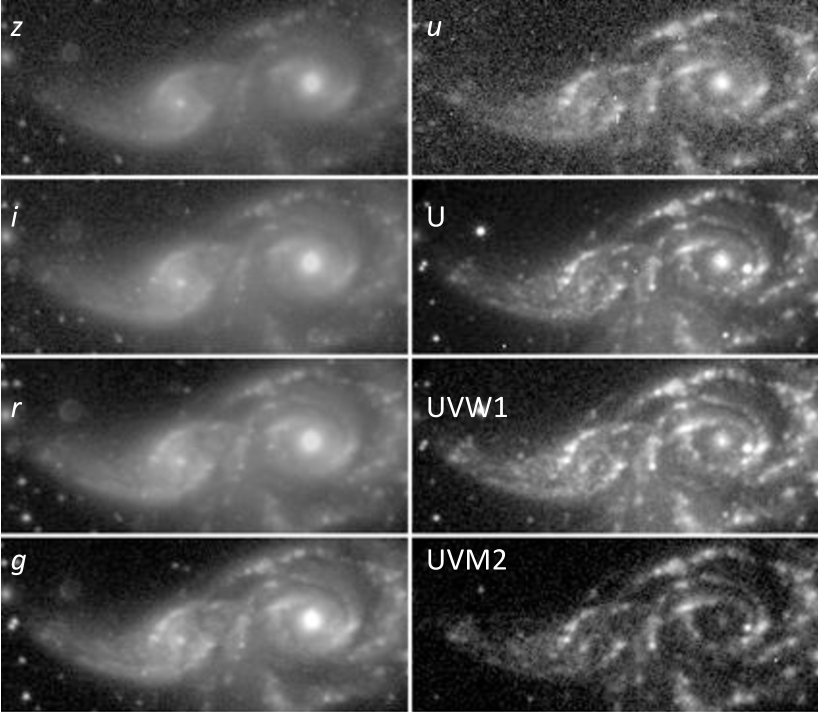
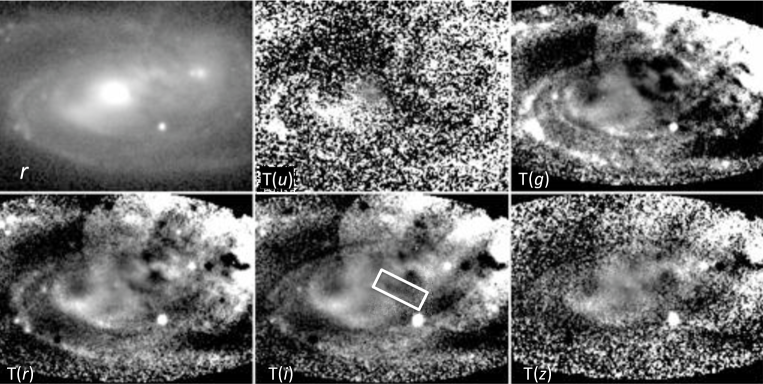
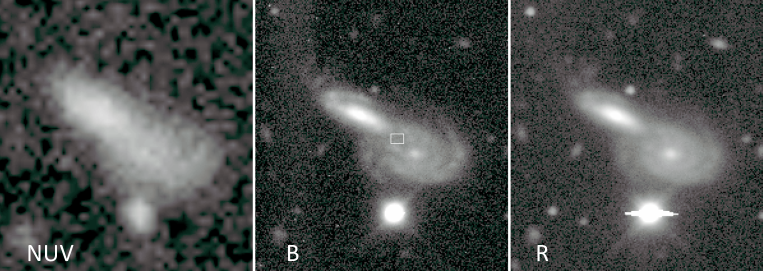
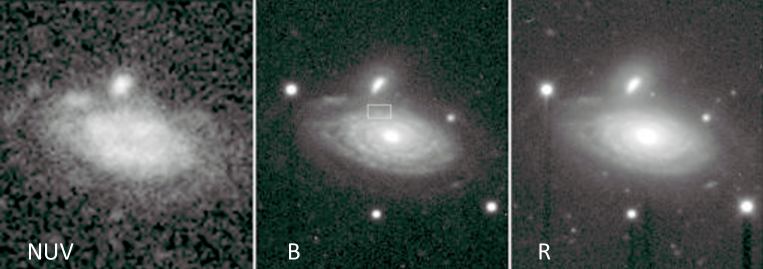
For NGC 2207/IC 2163, we use the XMM-Newton Optical Monitor data in the UV, providing higher spatial resolution than GALEX. Fig. 1 compares our images of this system from to UVM1 (0.95 - 0.25 m). Our interpretation is aided by archival HST WFPC2 images (Elmegreen et al., 2000). The attenuation in NGC 2207 was measured most accurately using the arm-tracing technique to estimate the background intensity and its error, and rotational symmetry for the foreground arms in NGC 2207 itself; for the outermost arm in particular, the foreground intensity is so low that its correction makes a negligible contribution to the error.
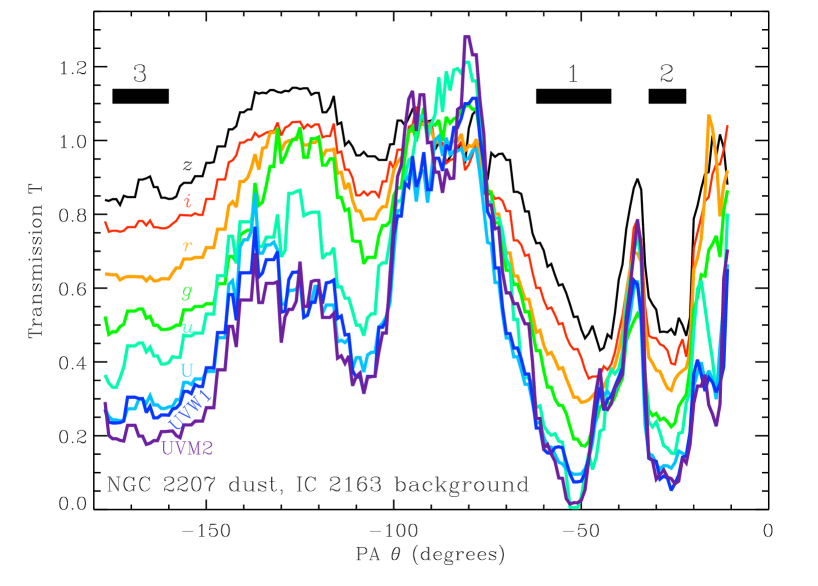
Our most detailed results are shown in Fig. 2, which compared the derived transmission values along the background arm of IC 2163 as functions of position angle. We trace the attenuation in three places where the outer arm of NGC 2207 crosses in front of the western (inner) arm of IC 2163 to its NW (two distinct segments at PA –37∘) and one to the SW (PA -171∘). The values averaged across these main foreground-arm crossings are listed with our overall summary in Table 3. Errors are based on the scatter in regions with (nominally) no foreground attenuation: to - and to .
From comparison with other systems, we also evaluated the multiband attenuation using a single box location in the outer arm of NGC 2207, using simple symmetry to evaluate the starlight contributions of both NGC 2207 and IC 2163 within this region. We use a -arcsecond box with major axis oriented 23∘ clockwise from N, centered 3.5” W and 3.1” S of the nucleus of IC 2163.
The UV transmissions we measure suggest that the effective covering fraction of clouds with significant optical depth must be much larger than in the optical. This must be so for a realistic mix of pixel-by-pixel optical depths, with the result that the cross-section of spiral features is larger than we see in higher-resolution optical images. We examine this for NGC 2207 using the archival HST WFPC2 images described by Elmegreen et al. (2001). We compare distributions of retrieved transmission in the F336W and F439W filters, approximately and bands respectively.
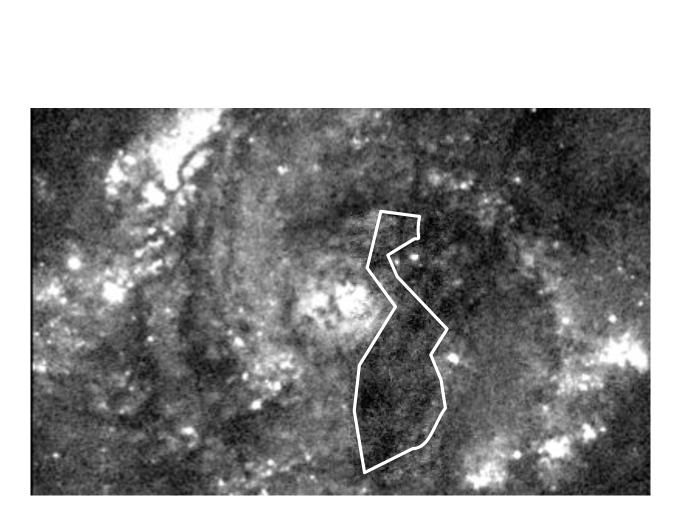
For the outer arm of NGC 2207 projected against the core of IC 2163 (Fig. 3), the foreground light correction is % in this region; we apply a constant surface brightness measured north of the bright disk of IC 2163, and model the background light with a first-order radially symmetric distribution (which is especially flat, essentially constant, in F336W). After smoothing over 0.5 ′′ due to the limited S/N in the filter, we derive distributions of relative area versus transmission within the dust lane (in a region comparable to our UV measures) as shown in Fig. 4.

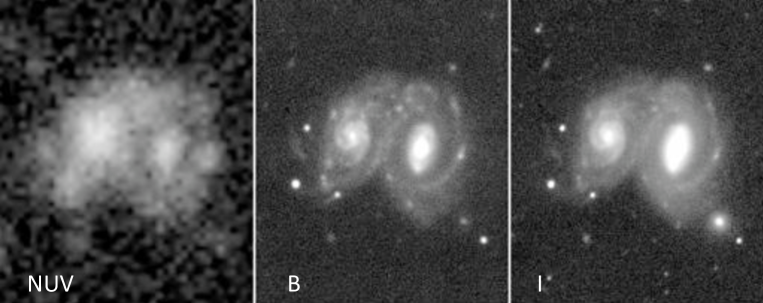
3.2 NGC 4567/8
This spiral pair in the Virgo cluster, despite considerable overlap in our view, is not strongly interacting. H I mapping, as shown by Chung et al. (2009), shows kinematic signs of disk warping in the large foreground system NGC 4568; the two disk redshifts coincide quite closely in the overlap region making it difficult to separate the two galaxies’ contributions to the H I column density in this region. Similarly, the CO velocity field in this region shows a smooth connection, leading Kaneko et al. (2013) to assess the system as in an early stage of interaction before first close approach.
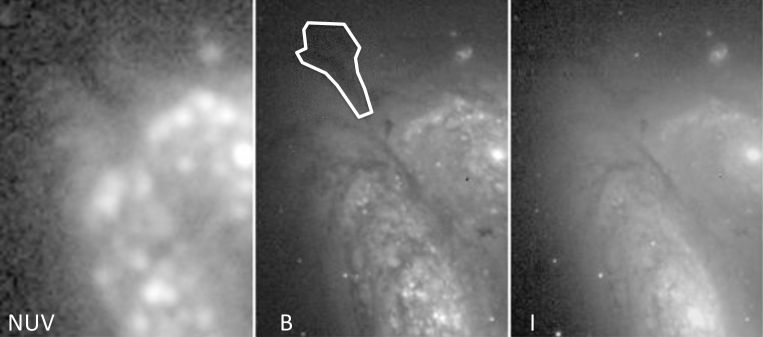
We measure a dust arm on the north side of NGC 4568, which lies far enough out in the galaxy to minimize effects of stellar spiral structure on the surface brightness (Fig. 5). In this area we can use ellipse fits to the background galaxy NGC 4567 and assess errors from foreground structure from the scatter among similarly-sized regions on either side of the dust lane after subtracting the background contribution. This dust feature, unlike other darker ones, is clear of the luminous, UV-bright star-forming regions which are common in the inner disks of both galaxies.
The transmission and derived attenuation values are listed in Table 3. The GALEX data give a usable measurement in the NUV band; the available FUV exposure is too short for a detection at this surface brightness.
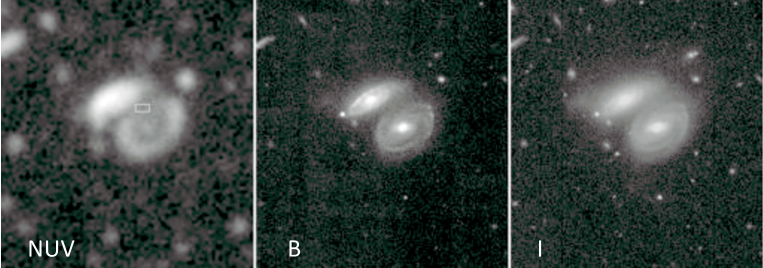
3.3 UGC 3995
This object, noted in the UGC (Nilson, 1973) as having a possible jet, was identified by Keel (1985) as a superimposed galaxy pair. Both spirals are seen nearly face-on. Their matching redshifts indicate potential interaction, but the spiral patterns are closely symmetric; potential distortions are at larger radii than we consider here.
“Snapshot” HST data in the F606W (approximately V) band by Malkan et al. (1998) were analyzed initially by Marziani et al. (1999), who quote in the interarm parts of the foreground disk, and in the arms. Using the favorable geometry, with the outer disk of UGC 3995B projected against the bulge of UGC 3995A, Holwerda & Keel (2013) have mapped the dust in more detail using the HST image and integral-field spectra from the CALIFA program (Sánchez et al., 2012), noting a distinct outer edge to strong attenuation and a systematic offset between the arm locations as defined by stars and dust.
The bulge component of UGC 3995A is faint in the UV, so we use arm-tracing rather than ellipse-fitting for this system. To measure attenuation consistently with wavelength, we use this approach for all wavelength bands in this work, rather than adopting the symmetry-based results at high resolution from HST data by Holwerda & Keel (2013).
As promising as the galaxy types look for UV imaging, the background arms are not very blue, so there is not enough signal for measurement in the GALEX bands. We can measure a region of the dust lane closest to the background nucleus in all 5 SDSS filters including , adding color information to the previous attenuation values and, for this system, a bridge wavelength toward the average UV behavior. At these wavelengths, the background light is so dominant that the corrections for foreground light based on the opposite side of the disk are %, and the error contributions from these corrections correspondingly smaller.
Our transmission maps (Fig. 6) show the effect noted by Holwerda & Keel (2013) in which the dust arms lie inward of the bright stellar ridge lines, typically by or 500 pc.
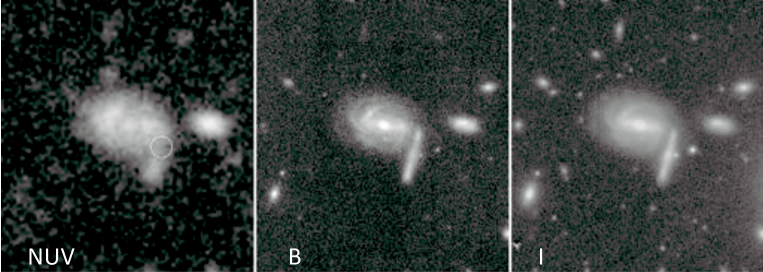
3.4 SDSS J143650.57+060821.4
We trace intensities along arms in both systems. This pair (hereinafter SDSS 1436 for brevity) is favorable in that the arms of the background, face-on galaxy are bluer than those of the foreground galaxy, so they are brighter in the UV away from the foreground dust and the error contributed by foreground structure is minimized. We have both WIYN OPTIC (BI) and KPNO 2.1m (BR) optical images, with slightly better surface-brighness sensitivity for the 2.1m data. The sense of overlap is clear from the light loss against the eastern arm of the western galaxy where the eastern arm of the other galaxy crosses it; the more face-on and symmetric galaxy is in the background.
These arms are nearly tangent to each other in projection; we measure transmission in a region where they are closest (Fig. 7). Errors are based on the scatter among similarly-sized slices of each arm (compared to its symmetric partner) in non-overlapped regions. Even if we consider the arm profiles ignoring the UV-bright knot opposite the overlap region, the NUV transmission has an error range spanning all physical values.
3.5 SDSS J161453.42+562408.9
The evidence for attenuation of light from the southern member of this pair by the northern galaxy is a pronounced deficit in the NUV intensity, with a much weaker deficit in the same area (Fig. 8). We estimate the foreground and background contributions in the overlap region by reflection symmetry, and evaluate errors from the scatter of multiple regions of the same size along the relevant global isophotes for each galaxy.
3.6 SDSS J163321.48+502420.5
The attenuation in this region appears in front of the northern part of the edge-on background galaxy, We use symmetry for both galaxies, modeling the NUV image of the foreground galaxy with a linear decline in surface brightness (a close fit which allows easy evaluation of scatter about the mean behavior). In this system, we measure the attenuation in a single box region (Fig. 9), where the error is dominated by foreground structure and evaluated by the scatter along the overlap isophote elsewhere in the foreground system.
3.7 SDSS J211644.67+001022.4
We use simple reflection symmetry to model the galaxy light, and evaluate the errors based on scatter of multiple regions of the same size along the relevant isophote of each galaxy. The system geometry and dust region are shown in Fig. 10.
3.8 NGC 5491
The evidence for attenuation is somewhat ambiguous in this pair, consisting of the drop in surface brightness of the outer arm of the southern spiral where it is projected against the (apparently) foreground northern companion. Using reflection symmetry, and evaluating errors from scatter in same-sized regions along the relevant isophotes in each galaxy, our data suggest actual light loss, clearly detected in both GALEX UV bands but only marginally in the optical bands. The geometry and region measured are shown in Fig. 11.
4 Attenuation measures - average behavior and reddening law
We combine the results from these galaxy pairs to constrain the mean attenuation law, connecting light loss and reddening. In doing so, we consider the error ranges as they affect not only the weighting of data, but normalization to the optical values. The optimum attenuation range in this respect has the values large enough to be well-measured, and the UV values not so large as to be nearly indeterminate. The combined values are listed in Table 4.
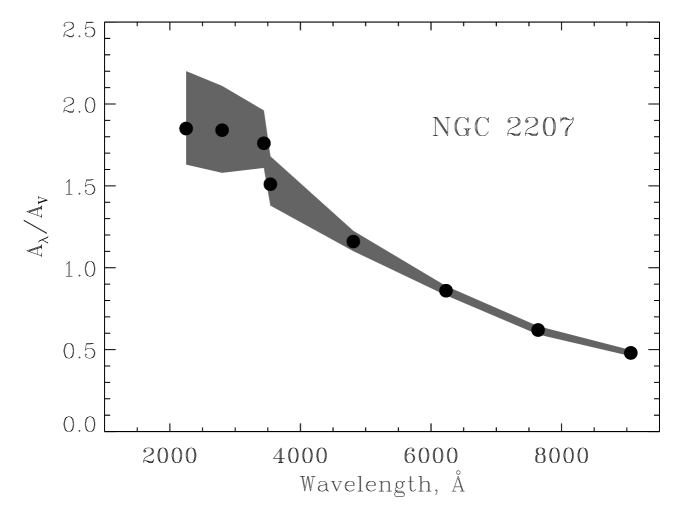
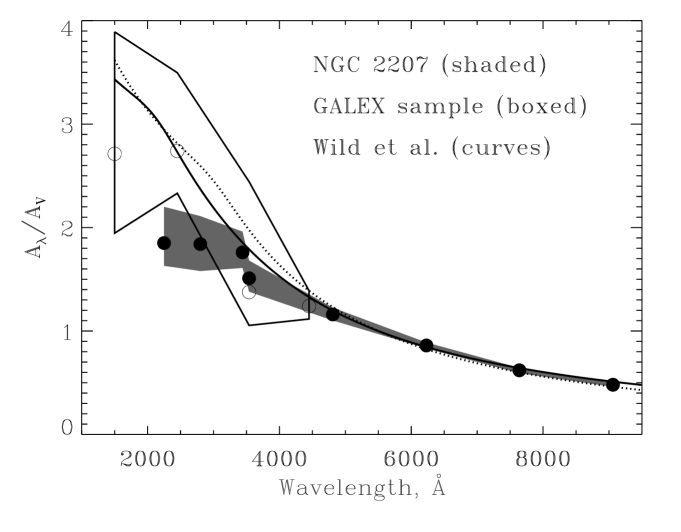
Since the data for NGC 2207 have high quality for each region, we show its values separately (Fig. 12). The shaded region encompasses the errors on variance-weighted means in each filter, normalized to by interpolation between and bands.
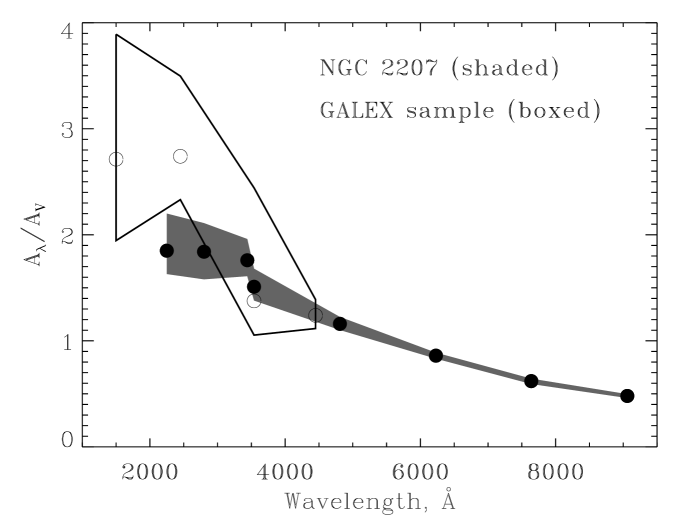
For the systems with GALEX images, we can extend the attenuation data to the FUV band near 1500 Å. The large range in S/N of these measures dictates care in combining data for the various galaxies. Some systems have the optical points measured very poorly, so they would compromise the normalization of the UV values. Accordingly, we normalize the NUV/B ratio via the weighted mean of objects with the B values measured at S/N (in practice, this means S/N). Likewise, we normalize the composite FUV/NUV ratio with a weighted mean of the 2 systems with non-open error bars (limits for other systems are not informative).
Fig. 13 compares these results to the NGC 2207 means. While the averages are somewhat higher than for NGC 2207, the error bounds (at the standard deviation level) overlap almost everywhere, so that at our precision a single attenuation law is a plausible fit to the whole data set. The error band is broad enough for such subtle effects as shifts of effective wavelength with reddening not to be of concern.
5 Radial behavior in the ultraviolet
We can examine the radial behavior of the attenuation, mindful of the inherent selection caused by the need to have transmitted light in the UV bands. Therefore, our most accurate results occur for transmission values not very close to either zero or unity, where the relative effects of symmetry errors are greatest. Arm and interarm regions are not clearly distinguished at the resolution of the GALEX data; only in SDSS 2116 is it likely that the UV measure is clearly dominated by arm dust. Taking the entire sample, the arm regions do show systematically greater attenuation at a given normalized radius than combined arm/interarm values, but our errors are too large to compare attenuation laws in spiral arms and between them. The high arm value are dominated by NGC 2207, for which the XMM-OM UV data do resolve the arms well.
Within these limitations, we summarize in Fig. 14 the UV attenuation as a function of normalized radius, corrected to equivalent face-on values with a cosine factor (for the assumed thin-disk geometry, the same as axial ratio ). The major (unsurprising) feature of these plots is that data identified as arm-dominated show higher attenuation than the other points averaged across arm and interarm regions.
Boissier et al. (2005) discuss the radial behavior of attenuation in the spiral M83 = NGC 5236 from a combination of UV, H and infrared tracers. These will likely be weighted toward star-forming regions, and might be expected to give a higher value than our area-weighted data. The outer edge of their relation, at , has A magnitude. For our sample, the derived face-on values are 0.6 – 1.9 over the range . The UVM2 filter data at a similar wavelength for the arms of NGC 2207 also fit broadly with their results, at .
Optical dust measurements from our data can naturally be performed and interpreted at much higher resolution than their continuation into the UV; we will present such results for a large sample of backlit spiral elsewhere, including both grand-design and flocculent systems.

6 Conclusions
We have used a combination of ground-based optical images with GALEX and XMM-OM data in the ultraviolet to measure the shape of the effective extinction (attenuation) law in galaxy disks over the range 1500-9000 Å . Only spiral background galaxies are bright enough at the UV wavelengths to serve for this technique, so the structure in both galaxies contributes significantly to the error in retrieving the transmission fractions, and subsequently optical depths. The data for the nearby spiral NGC 2207 are particularly good; since it was also observed with different filters than the GALEX system, we consider its attenuation behavior separately.
The effective extinction law derived by Calzetti et al. (1994) from the SEDs of star-forming galaxies has found wide applicability. It pertains to large areas of galaxies, and, like our results, shows a flatter slope than the intrinsic grain behavior seen in star-by-star investigation of nearby resolved galaxies (Cardelli et al. 1989 , Bianchi et al. 1996, Gordon & Clayton 1998). Calzetti et al. (1994) attribute this to a mix of effects: the progressive bias in favor of the more transparent parts of a patchy dust distribution at shorter wavelengths, and the potential effects of preferential escape of longer-lived stars from obscuring clouds around regions of recent star formation.
The Calzetti et al. (1994) law is a remarkably good fit to our observations (Fig. 15). SED fitting is insensitive to a grey component of attenuation; if we assume there is no actually grey offset, only a single free parameter remains affecting both normalization and slope, equivalent to . The curve in Fig. 15 shows the best-fit value for our data, , closely comparable to their derived mean . Our results extend the applicability of the Calzetti et al. (1994) form, to even the outer parts of spiral disks where star formation proceeds at very modest levels.

Particularly in the case of NGC 2207, the foreground-light correction and its error are small enough to insure that the slope of the reddening curve we find is not strongly affected by differential escape of stars from obscuring clouds; fine structure in the dust distribution must account for the attenuation behavior we find. In nearby, well-resolved spirals analyzed using background galaxies, the reddening slope changes with spatial resolution in a way consistent with a fractal cloud distribution on scales from tens to hundreds of parsecs (Keel & White, 2001). This raises at least the possibility that different dust distributions could occur, giving different reddening behavior, which suggests caution in applying these results to galaxies at high redshifts.
Wild et al. (2011) performed an SED analysis using many pairs of galaxies, matched in specific star-formation rate, metallicity, and axial ratio, to form attenuation curves for subgroups of galaxies, expressing the results as spliced power-law segments varying with each of the matching variables. For their results as well, comparison with our mean attenuation data may help separate the roles of dust distribution itself from the relative distributions of dust and stars. Our composite curve is consistent with their UV slopes, steeper than the Calzetti et al. value, over wide ranges in stellar mass and star-formation rate, for the mean of the GALEX sample, but not for NGC 2207 (Fig. 16). Using their expressions for more inclined disks reduces but does not eliminate this discrepancy; our sample has a mean axial ratio , with range 0.32-1.0 (Table 3). As Wild et al. (2011) note, much of the difference they find with axial ratio and star-formation rate may trace to distinct populations of grains near star-forming regions and in the diffuse ISM; the attenuation statistics with area in NGC 2207 suggest that a proportionally greater fraction of the UV extinction arises in more diffuse material.
Taken together, our data suggest a flatter UV attenuation curve than any of the Wild et al. forms; this could reflect the nature of backlighting measurements, which are area-weighted independent of the location of stars in the foreground galaxy. The GALEX sample by itself is reasonably well fit by the Wild et al. curve, however; the errors for these points are substantially larger than for the NGC 2207 data, leaving open the possibility of a difference.
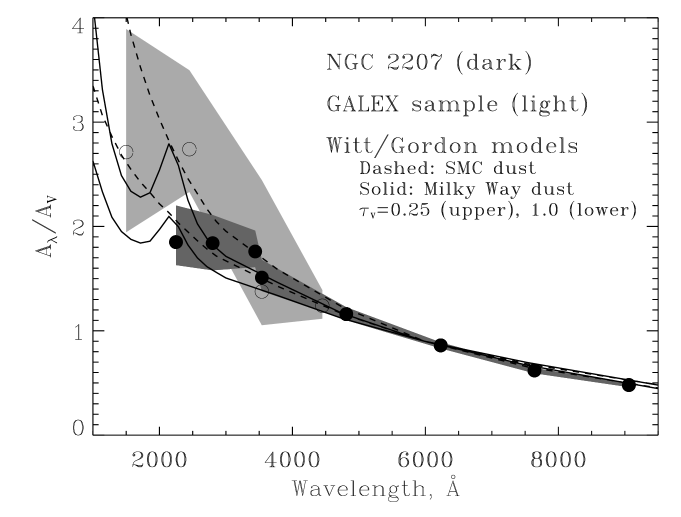
This situation clearly represents a sheet geometry, reasonably well approximating the shell geometry used in some radiative-transfer calculations. Calculations have been published including realistic degrees of clumping which we can compare to our results, for the cases of Milky Way and SMC-like dust populations (e.g. Witt & Gordon 2000). For this situation, internal scattering effects will be removed by symmetry, so the more relevant comparison is with the “direct” component of attenuation excluding scattering. The Witt & Gordon (2000) results, provided in tabular detail, include multiple levels of scaling to optical depth averaged over all lines of sight; for a fixed attenuation along one line of sight; this amounts to changing the degree of clumpiness of the dust. We show a comparison in Fig. 17. Using a simple figure of merit, the entire UV data set ( Å) favors both calculations (with ) over the values (); that is, the scenarios with clumpier grains. For the more precise NGC 2207 data, the evidence is even stronger, versus . The comparison is somewhat degenerate even between such extremes as Milky Way and SMC dust first because the NUV and UVM2 bands overlap with the 2175-AA extinction feature, and because increased clumping manifests itself in the calculations as a flatter UV slope in each case, progressively masking the difference due to grain extinction properties.
Our results suggest the applicability of something very close to the Calzetti et al. (1994) form for effective extinction of kpc-scale areas in the outer disks of spirals. This requires a mild extrapolation to the equivalent optical value, indicating that further work can use this technique to compare dust content and distribution of galaxies at significant redshifts observed in the emitted UV to the present-day galaxy population as understood in the optical regime.
References
- Berry et al. (2012) Berry, M., Ivezić, Ž., Sesar, B., et al. 2012, ApJ, 757, 166
- Bianchi et al. (1996) Bianchi, L., Clayton, G. C., Bohlin, R. C., Hutchings, J. B., & Massey, P. 1996, ApJ, 471, 203
- Boissier et al. (2005) Boissier, S., Gil de Paz, A., Madore, B. F., et al. 2005, ApJ, 619, L83
- Calzetti et al. (1994) Calzetti, D., Kinney, A. L., & Storchi-Bergmann, T. 1994, ApJ, 429, 582
- Calzetti & Heckman (1999) Calzetti, D., & Heckman, T. M. 1999, ApJ, 519, 27
- Chung et al. (2009) Chung, A., van Gorkom, J. H., Kenney, J. D. P., Crowl, H., & Vollmer, B. 2009, AJ, 138, 1741
- Cardelli et al. (1989) Cardelli, J. A., Clayton, G. C., & Mathis, J. S. 1989, ApJ, 345, 245
- Dalcanton et al. (2012) Dalcanton, J. J., Williams, B. F., Lang, D., et al. 2012, ApJS, 200, 18
- Elmegreen et al. (1995) Elmegreen, B. G., Sundin, M., Kaufman, M., Brinks, E., & Elmegreen, D. M. 1995, ApJ, 453, 139
- Elmegreen et al. (2001) Elmegreen, D. M., Kaufman, M., Elmegreen, B. G., et al. 2001, AJ, 121, 182
- Elmegreen et al. (2000) Elmegreen, B. G., Kaufman, M., Struck, C., et al. 2000, AJ, 120, 630
- Fischera et al. (2003) Fischera, J., Dopita, M. A., & Sutherland, R. S. 2003, ApJ, 599, L21
- Gordon & Clayton (1998) Gordon, K. D., & Clayton, G. C. 1998, ApJ, 500, 816
- Holwerda et al. (2009) Holwerda, B. W., Keel, W. C., Williams, B., Dalcanton, J. J., & de Jong, R. S. 2009, AJ, 137, 3000
- Holwerda & Keel (2013) Holwerda, B. W., & Keel, W. C. 2013, arXiv:1305.5358
- Iglesias-Páramo et al. (2007) Iglesias-Páramo, J., Buat, V., Hernández-Fernández, J., et al. 2007, ApJ, 670, 279
- Jedrzejewski (1987) Jedrzejewski, R. I. 1987, MNRAS, 226, 747
- Kaneko et al. (2013) Kaneko, H., Kuno, N., Iono, D., et al. 2013, PASJ, 65, 20
- Keel (1985) Keel, W. C. 1985, AJ, 90, 2207
- Keel & White (2001) Keel, W. C., & White, R. E., III 2001, AJ, 121, 1442
- Keel et al. (2013) Keel, W. C., Manning, A. M., Holwerda, B. W., et al. 2013, PASP, 125, 2
- Lintott et al. (2008) Lintott, C. J., Schawinski, K., Slosar, A., et al. 2008, MNRAS, 389, 1179
- Lupton et al. (2004) Lupton, R., Blanton, M. R., Fekete, G., et al. 2004, PASP, 116, 133
- Malkan et al. (1998) Malkan, M. A., Gorjian, V., & Tam, R. 1998, ApJS, 117, 25
- Martin et al. (2005) Martin, D. C., Fanson, J., Schiminovich, D., et al. 2005, ApJ, 619, L1
- Marziani et al. (1999) Marziani, P., D’Onofrio, M., Dultzin-Hacyan, D., & Sulentic, J. W. 1999, AJ, 117, 2736
- Mason et al. (2001) Mason, K. O., Breeveld, A., Much, R., et al. 2001, A&A, 365, L36
- Nilson (1973) Nilson, P. 1973, Acta Universitatis Upsaliensis. Nova Acta Regiae Societatis Scientiarum Upsaliensis - Uppsala Astronomiska Observatoriums Annaler, Uppsala: Astronomiska Observatorium, 1973,
- Rowan-Robinson (2003) Rowan-Robinson, M. 2003, MNRAS, 345, 819
- Sánchez et al. (2012) Sánchez, S. F., Kennicutt, R. C., Gil de Paz, A., et al. 2012, A&A, 538, A8
- Spergel et al. (2003) Spergel, D. N., Verde, L., Peiris, H. V., et al. 2003, ApJS, 148, 175
- Tonry et al. (2002) Tonry, J. L., Luppino, G. A., Kaiser, N., Burke, B. E., & Jacoby, G. H. 2002, Proc. SPIE, 4836, 206
- White & Keel (1992) White, R. E., & Keel, W. C. 1992, Nature, 359, 655 (WK92)
- White et al. (2000) White, R. E., III, Keel, W. C., & Conselice, C. J. 2000, ApJ, 542, 761 (WKC)
- Wild et al. (2011) Wild, V., Charlot, S., Brinchmann, J., et al. 2011, MNRAS, 417, 1760
- Witt & Gordon (2000) Witt, A. N., & Gordon, K. D. 2000, ApJ, 528, 799
- XMM-Newton Community Support Team (2012) XMM-Newton Community Support Team, XMM-Newton Users Handbook, issue 2.10, http://xmm.esac.esa.int/external/xmm_user_support/documentation/uhb/XMM_UHB.html (2012), section 3.5.6.
| System | R25 | GALEX exp (s): | Optical data | Models: | |||
|---|---|---|---|---|---|---|---|
| arcsec | NUV | FUV | Foreground | Background | |||
| NGC 2207 | 0.0091 | 127 | 8919 | 13380 | SARA-S | arm tracing | arm tracing |
| NGC 4568 | 0.0075 | 137 | 10170 | 1706 | HST, WIYN | ellipse | ellipse |
| NGC 5491 | 0.0197 | 14 | 1967 | 1322 | KP2m | symmetry | symmetry |
| UGC 3995 | 0.0158 | 27 | 1535 | 1535 | HST, SDSS | symmetry | ellipse |
| SDSS J143650.57+060821.4 | 0.0588 | 19 | 2485 | 2485 | KP2m | arm tracing | arm tracing |
| SDSS J161453.42+562408.9 | – | 20 | 21858 | 6118 | WIYN,KP2m | symmetry | symmetry |
| SDSS J163321.48+502420.5 | 0.0439 | 21 | 2698 | 2698 | WIYN | ellipse | mirror symmetry |
| SDSS J211644.67+001022.4 | 0.0318 | 16 | 4513 | 4513 | KP2m | symmetry | symmetry |
| GALEX exp (s): | ||||
|---|---|---|---|---|
| System | NUV | FUV | Optical data | Problem |
| NGC 4231 | 11734 | 11734 | WIYN | too far apart |
| NGC 4911 | 1688 | 1688 | WIYN, HST | bg too dim in UV |
| NGC 5679 | 1670 | 1670 | HST,WIYN | UV resolution too poor |
| NGC 6365 | 961 | 0 | KP2m | symmetry failure in UV |
| SDSS J084726.06+533814.9 | 2922 | 1696 | WIYN | too dim at overlap |
| SDSS J102517.76+170821.0 | 1722 | 1722 | WIYN | too far apart |
| SDSS J103244.35+543847.5 | 1680 | 1680 | WIYN | symmetry problem |
| SDSS J105454.32+100250.0 | 1551 | 1551 | WIYN | bg too small/faint in UV |
| SDSS J121326.98+504237.4 | 2440 | 1288 | WIYN | UV surface brightness too low |
| SDSS J121626.29+470131.6 | 11774 | 11774 | WIYN | interacting, distorted |
| SDSS J124415.63+314242.6 | 3370 | 1672 | WIYN | interacting, distorted |
| SDSS J125725.25+272416.4 | 31099 | 29932 | WIYN | fg asymmetry |
| SDSS J131222.90+461906.1 | 3116 | 1584 | WIYN | warped, bad symmetry, faint UV |
| SDSS J131354.20+441048.6 | 1442 | 1592 | WIYN | bg too dim in UV |
| SDSS J131404.57+472145.3 | 2540 | 1655 | WIYN | no absorption detected |
| SDSS J142718.87-014042.4 | 1680 | 1680 | WIYN | too far apart - arms in wrong place |
| SDSS J154954.44+085140.6 | 1424 | 1058 | WIYN | bg too dim in UV |
| UGC 6212 | 3213 | 3213 | WIYN | overlap surface brightness too low |
| VV 488 | 629 | 0 | CTIO 1.5m | background too dim in UV |
| Foreground galaxy | Type | PA∘ | R/R25 | Band | Transmission | ||
|---|---|---|---|---|---|---|---|
| NGC 2207 (box) | SAB(rs)bc | 0.65 | 100 | 0.78 | UVM2 | - | |
| UVW1 | |||||||
| OM U | |||||||
| NGC 2207 region 1 | 0.76 | UVM2 | |||||
| UVM1 | |||||||
| OM U | |||||||
| NGC 2207 region 2 | 0.78 | UVM2 | |||||
| UVM1 | |||||||
| OM U | |||||||
| NGC 2207 region 3 | 0.80 | UVM2 | |||||
| UVM1 | |||||||
| OM U | |||||||
| NGC 4568 | Sbc | 0.39 | 27 | 0.73 | NUV | ||
| B | |||||||
| I | |||||||
| NGC 5491 | SBc: | 0.81 | 137 | 0.68 | FUV | ||
| NUV | |||||||
| B | |||||||
| R | |||||||
| UGC 3995 | Sbc | 1.0 | 0.89 | 0.95 | |||
| SDSS J143650.57+060821.4 | Sc | 0.58 | 154 | 0.75 | NUV | - | |
| B | |||||||
| R | |||||||
| SDSS J161453.42+562408.9 | Sbc | 0.51 | 119 | 0.95 | FUV | ||
| NUV | |||||||
| B | |||||||
| I | |||||||
| SDSS J163321.48+502420.5 | SBbc | 0.62 | 75 | 0.82 | NUV | ||
| B | |||||||
| I | |||||||
| SDSS 211644.67+001022.4 | Sc | 0.32 | 59 | 0.66 | FUV | ||
| NUV | |||||||
| B | |||||||
| R |
| Sample | Band | |
|---|---|---|
| NGC 2207 | UVM2 | |
| UVW1 | ||
| U | ||
| GALEX | FUV | |
| NUV | ||
| B |