Magneto-optical spectroscopy with polarization-modulated light
Abstract
We present a combined theoretical and experimental study of magnetic resonance transitions induced by polarization-modulated light in cesium vapor exposed to a transverse magnetic field. Signals are obtained by phase-sensitive analysis of the light power traversing the vapor cell at six harmonics of the polarization modulation frequency. Resonances appear whenever the Larmor frequency matches an integer multiple of the modulation frequency. We have further investigated the modifications of the spectra when varying the modulation duty cycle. The resonance amplitudes of both in-phase and quadrature components are well described in terms of the Fourier coefficients of the modulation function. The background-free signals generated by the polarization modulation scheme have a high application potential in atomic magnetometry.
pacs:
32.30.Dx, 07.55.Ge, 07.55.Jg, 78.20 LsI Introduction
Magneto-optical spectroscopy of atomic media is a powerful tool that uses resonant optical interactions for detecting magnetic resonance in atoms (a comprehensive review is given by Alexandrov, et al. Alexandrov et al. (2005)). Magnetic resonance transitions are conventionally excited by a magnetic field oscillating at the atoms’ Larmor frequency, but it has been known since the seminal work by Bell and Bloom in 1961 Bell and Bloom (1961) that an amplitude-modulated (AM) resonant light beam can also induce magnetic resonance transitions. More recently, the Bell-Bloom method, in combination with phase-sensitive detection, has found a renewed interest Gawlik et al. (2006); Schultze et al. (2012), in particular for its application in high sensitivity atomic magnetometry Budker and Romalis (2007). Alternatively, modulation of either the light’s frequency or polarization at the Larmor frequency induces magnetic resonance. While frequency modulation spectroscopy has become a well established method for high sensitivity magnetometry Budker et al. (2002); Andreeva et al. (2002), little work has been devoted to polarization modulation Aleksandrov (1973); Gilles et al. (1991); Klepel and Suter (1992); Fescenko et al. (2013). Recently, resonant polarization modulation has been used to solve specific technical issues. The authors of Ben-Kish and Romalis (2010) have demonstrated that polarization modulation between circular and linear polarization states eliminates both dead-zones and heading errors in an alkali atom magnetometer. Polarization modulation between circular polarization states at the ground state hyperfine transition frequency was shown to increase the contrast of the clock resonance as described in Jau and Happer (2007) and references therein.
A theoretical model deriving algebraic expressions for the rich resonance structure of magnetic resonance transition driven by amplitude, frequency, and polarization modulation has recently been presented Grujić and Weis (2013). So far the model predictions were shown to give an excellent description of experimental results obtained with amplitude modulation using phase-sensitive detection Grujić and Weis (2013) and for polarization modulation with low-pass-filtered detection Fescenko et al. (2013). Here, we address polarization modulation in combination with phase-sensitive detection. We characterize, both experimentally and theoretically, the magneto-optical resonance spectra observed in a transverse magnetic field, when the helicity of the exciting laser beam is periodically reversed with different duty cycles. We first introduce our experimental and theoretical methods, and then discuss the full magneto-optical resonance spectra as a function of the modulation duty cycle. We show that resonances appear when the Larmor frequency is a harmonic of the modulation frequency, and that the relative resonance amplitudes are well described in terms of the Fourier coefficients of the polarization modulation function.
II Method
Experiments are carried out in a conventional magneto-optical spectroscopy apparatus Breschi et al. (2013); Fescenko et al. (2013). Light from a 894 nm distributed feedback diode laser passes an electro-optical modulator which flips the light polarization between and polarizations at a constant frequency Hz. The degree of circular polarization was determined to be and , for and , respectively. The laser frequency can be tuned to any hyperfine component of the cesium D1-line (), however, the experiments reported here were carried out on the transition which provides the highest magneto-optical resonance contrast Auzinsh et al. (2008). The modulated beam passes an evacuated paraffin–wall-coated spherical cell containing cesium vapor at room temperature ( C) saturated vapor pressure. The laser beam diameter is about times smaller than the cell diameter ( mm) so that lensing or birefringence effects from the cell itself do not critically affect the polarization quality. This is testable in that linear polarization components will create resonances at half of the Larmor frequency due to the symmetry and evolution of any created spin alignment. We did not see resonances in the experimental spectra arising from spin-alignment. The final excellent agreement between model and experimental results (c.f. §III) strongly implies that the cell has negligible effect on the light polarization.
The cell is isolated in a magnetically controlled environment Breschi et al. (2013), with nominal residual field components below a few nT. The amplitude of a static magnetic field applied orthogonally to the laser propagation direction, and hence the Larmor frequency , is scanned in the range . The experimental signal is formed by detecting the light power transmitted through the cell: the photocurrent signal is converted into voltage, amplified, and then demodulated via a lock-in amplifier which allows the simultaneous recording of the in-phase and quadrature signals at six harmonics of the modulation frequency.
II.1 Model
For signal interpretation we apply the model developed in Grujić and Weis (2013) for a spin-oriented atomic sample under periodically modulated excitation and detection. The key results of that model are summarized here. The power transmitted through the cell is given by the Lambert–Beer law, which, for an optically thin atomic vapor of length , is well approximated by , where is the optical absorption coefficient, and the sample length. For a laser beam resonant with a hyperfine transition, incident on atoms with a longitudinal spin orientation , the absorption coefficient becomes . Here, is the peak absorption coefficient of unpolarized atoms, , the light helicity, and the orientation analyzing power. Dropping time independent terms, the transmitted laser power is given by
| (1) |
where is the time dependent longitudinal spin orientation resulting from the time-dependent solutions of the Bloch equations under polarization modulation. A square-wave modulation function is chosen to make a fast switch between the two circular polarization states without spending significant time in linearly-polarized intermediate states. We allow for modulation with arbitrary duty cycle () chosen to be symmetric with respect to and constrained to have , whose Fourier expansion is given by
| (2) | ||||
| (3) |
In-phase and quadrature parts of extracted by demodulation at can be written as
| (4) |
where and are, respectively, absorptive and dispersive Lorentzian resonances given by
| (5) | ||||
| (6) |
with amplitudes
| (7) | ||||
| (8) |
where is the optical pumping saturation power. We note that the model was developed for the low power limit (,), and that the experiments were carried out in that range.
III Analysis of the resonance spectrum
We have studied the demodulated signals as a function of the detection harmonic and modulation duty-cycle . Since in the Fourier expansion of a symmetric square wave the even coefficients vanish, one sees from Eqs. (7) and (8) that lock-in resonances appear only at odd and even . To compare experimental and theoretical results we normalize the in-phase and quadrature signals to the highest amplitude absorptive and dispersive signals, respectively, found when , and . No other scaling factors are needed. The normalized model signals thus read
| (9) |
| (10) |
Theory also predicts .
Experimental amplitudes are obtained by fitting the recorded data with the absorptive and dispersive Lorentzians of Eqs. (5) and (6), yielding fit amplitudes that represent the model amplitudes (7) and (8), respectively. We then normalize all fitted in-phase (quadrature) amplitudes to the in-phase (quadrature) amplitude of the (, , ) resonance. The experimental ratio was found to be , in accord with the theory prediction. In this way, we eliminate all secondary experimental parameters affecting the signal, e.g., detector quantum efficiency, current-voltage converter gains, etc. The normalization of the model predictions, of course, removes unknown theory parameters (e.g., , , , etc).
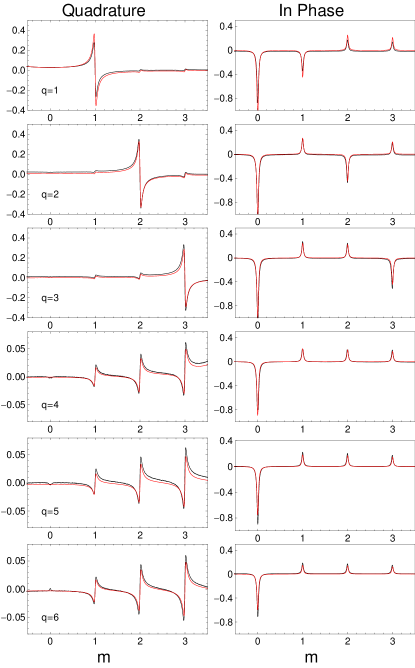
In Fig. 1 and 2 we compare experimental and theoretical spectra for different values of when and . No scaling has been applied beyond the normalization procedure above.
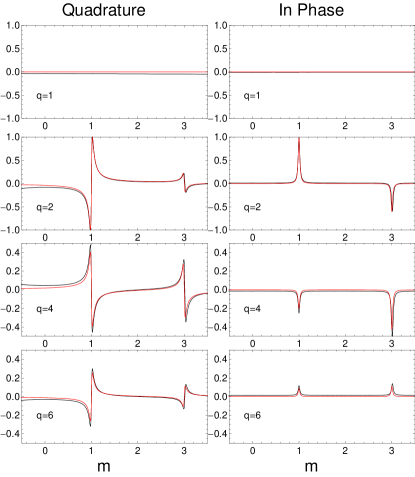
As predicted, resonances are observed when the Larmor frequency is a multiple of the modulation frequency, i.e., . An important point to note is that in contrast to experiments with frequency- or amplitude-modulated light, polarization modulation yields background-free in-phase and quadrature signals. The amplitude of the zero-field level-crossing (Hanle) resonance is proportional to , Eq. (3), and thus vanishes for 50% duty cycle.
Figure 1 presents the signals obtained for , where one can see the largest signal at and (the absorptive and dispersive reference resonances for normalization). This resonance is the most interesting for atomic magnetometry, and work is ongoing to fully characterize the signal and study the final sensitivity limit of the method. The duty cycle pumping, i.e., excitation with a symmetric square wave, essentially corresponds to the so-called push-pull-optical-pumping Jau et al. (2004), whose effect is the synchronization of the pumping light’s polarization modulation with the harmonic evolution of the atomic quantum state in the external field. Notable in the case is that all odd resonances are predicted to be zero by the model (as discussed at the start of the section), and the data (only one trace for is plotted in the figure) shows no signal at the detection limit in those cases. Figure 2 presents the signals obtained for , where odd resonances are non-null.
The magnetic resonance linewidths show no dependence on and , consistent with the fact that the linewidth is determined by relaxation mechanisms and power broadening common to all resonances. In the anti-relaxation wall-coated cell, the primary relaxation mechanisms arise from spin-exchange collisions and loss of the atoms to the alkali reservoir via the entrance channel, followed in importance by collisions between alkali atoms and the anti-relaxation coating, and magnetic field inhomogeneities, none of which have an expected dependence on or .
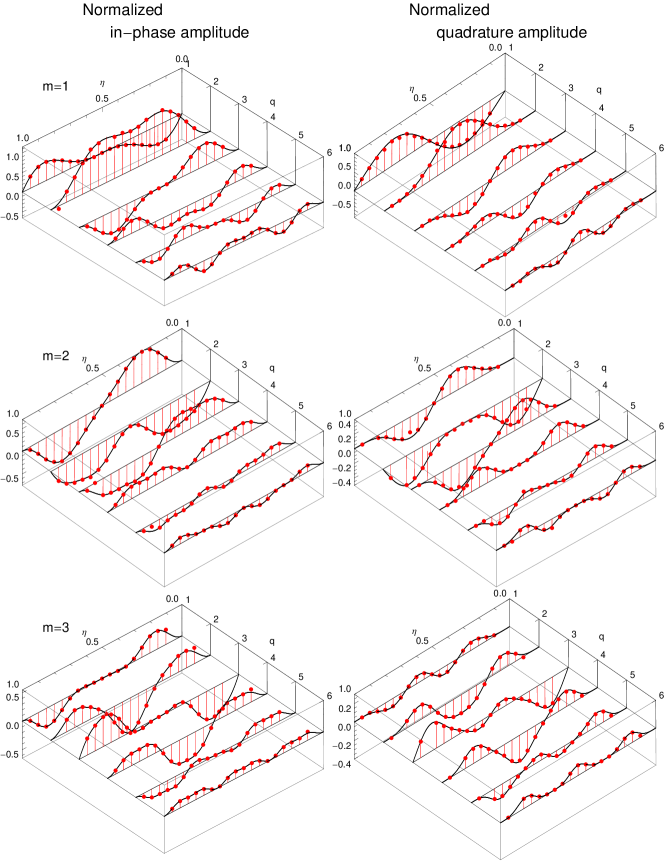
We have investigated the dependence of the spectra on the duty cycle by varying between 0.1 and 0.9 in steps of 0.05. For each value of we measured the amplitudes of the resonances occurring at , , and (i.e., for ) in each of the six demodulation channels . Figure 3 shows the experimental amplitudes (after normalization) as a function of and , together with the model predictions that are in excellent agreement with experiment. We note the alternating symmetric/anti-symmetric -dependence with respect to for odd and even , respectively.
The magnetic resonance linewidth depends on because the effective power driving either the or transition–and hence the power-broadening of the line–depends on the duty cycle . For this reason the balanced excitation with is expected to produce the narrowest resonances, as observed in experiment.
IV Summary and Conclusions
We have studied magneto-optical resonances that occur at multiples of the Larmor frequency when the polarization of a resonant laser beam traversing an alkali atom vapor is switched between left- and right- circular polarization. The lock-in demodulated signals have a rich spectral structure that is well reproduced by algebraic model predictions. The linear zero-crossings of the quadrature resonances can be used as discriminator signals for magnetic field measurements. The optimal resonance for magnetometry applications is the one with , and , since it has the largest amplitude and simultaneously the narrowest linewidth. The application of the polarization modulation approach reported here to atomic magnetometry has a distinctive advantage compared to similar approaches using amplitude or frequency modulation, viz., the absence of a DC background on the in-phase signal. In a feedback-locked magnetometer, an imperfect phase setting transfers a part of the DC background onto the quadrature signal thereby introducing a shift in the magnetic field measure and increasing power noise.
Finally polarization modulation with variable duty cycle can also find applications in the preparation and manipulation of specific atomic states, i.e., in metrology Di Domenico et al. (2010) and in quantum information processing Wang et al. (2007).
Acknowledgements.
This work is supported by SNF-Ambizione grant PZ00P2_131926. We thank the mechanical workshop and the electronics pool of the Physics Department for expert technical support.References
- Alexandrov et al. (2005) E. B. Alexandrov, M. Auzinsh, D. Budker, D. F. Kimball, S. M. Rochester, and V. V. Yashchuk, J. Opt. Soc. Am. B 22, 7 (2005).
- Bell and Bloom (1961) W. E. Bell and A. L. Bloom, Phys. Rev. Lett. 6, 280 (1961).
- Gawlik et al. (2006) W. Gawlik, L. Krzemień, S. Pustelny, D. Sangla, J. Zachorowski, M. Graf, A. O. Sushkov, and D. Budker, Appl. Phys. Lett. 88, 131108 (2006).
- Schultze et al. (2012) V. Schultze, R. IJsselsteijn, T. Scholtes, S. Woetzel, and H.-G. Meyer, Opt. Exp. 20, 14201 (2012).
- Budker and Romalis (2007) D. Budker and M. Romalis, Nature Physics 3, 227 (2007).
- Budker et al. (2002) D. Budker, D. F. Kimball, V. V. Yashchuk, and M. Zolotorev, Phys. Rev. A 65, 055403 (2002).
- Andreeva et al. (2002) C. Andreeva, S. Cartaleva, Y. Dancheva, V. Biancalana, A. Burchianti, C. Marinelli, E. Mariotti, L. Moi, and K. Nasyrov, Phys. Rev. A 66, 012502 (2002).
- Aleksandrov (1973) E. B. Aleksandrov, Sov. Phys. Usp. 15, 436 (1973).
- Gilles et al. (1991) H. Gilles, B. Cheron, and J. Hamel, Opt. Commun. 81, 369 (1991).
- Klepel and Suter (1992) H. Klepel and D. Suter, Opt. Commun. 90, 46 (1992).
- Fescenko et al. (2013) I. Fescenko, P. Knowles, A. Weis, and E. Breschi, Opt. Exp. 21, 15121 (2013).
- Ben-Kish and Romalis (2010) A. Ben-Kish and M. V. Romalis, Phys. Rev. Lett. 105, 193601 (2010).
- Jau and Happer (2007) Y.-Y. Jau and W. Happer, Phys. Rev. Lett. 99, 223001 (2007).
- Grujić and Weis (2013) Z. D. Grujić and A. Weis, Phys. Rev. A 88, 012508 (2013).
- Breschi et al. (2013) E. Breschi, Z. D. Grujić, and A. Weis, Appl. Phys. B (published online), 1 (2013).
- Auzinsh et al. (2008) M. Auzinsh, R. Ferber, F. Gahbauer, A. Jarmola, and L. Kalvans, Phys. Rev. A 78, 013417 (2008).
- Jau et al. (2004) Y.-Y. Jau, E. Miron, A. B. Post, N. N. Kuzma, and W. Happer, Phys. Rev. Lett. 93, 160802 (2004).
- Di Domenico et al. (2010) G. Di Domenico, L. Devenoges, C. Dumas, and P. Thomann, Phys. Rev. A 82, 053417 (2010).
- Wang et al. (2007) B. Wang, Y. Han, J. Xiao, X. Yang, C. Zhang, H. Wang, M. Xiao, and K. Peng, Phys. Rev. A 75, 051801 (2007).