Superbroad Component in Emission Lines of SS 433
Abstract
We have detected new components in stationary emission lines of SS 433; these are the superbroad components that are low-contrast substrates with a width of 2000–2500 km in He I and H and 4000–5000 km in He II . Based on 44 spectra taken during four years of observations from 2003 to 2007, we have found that these components in the He II and He I lines are eclipsed by the donor star; their behavior with precessional and orbital phases is regular and similar to the behavior of the optical brightness of SS 433. The same component in H shows neither eclipses nor precessional variability. We conclude that the superbroad components in the helium and hydrogen lines are different in origin. Electron scattering is shown to reproduce well the superbroad component of H at a gas temperature of 20–35 kK and an optical depth for Thomson scattering 0.25–0.35. The superbroad components of the helium lines are probably formed in the wind from the supercritical accretion disk. We have computed a wind model based on the concept of Shakura-Sunyaev supercritical disk accretion. The main patterns of the He II line profiles are well reproduced in this model: not only the appearance of the superbroad component but also the evolution of the central two-component part of the profile of this line during its eclipse by the donor star can be explained.
keywords:
SS 433, close X-ray binaries, supercritical accretion, emission line formation.20133912826[843]
April 26, 2013
1 INTRODUCTION
SS 433 is the only known supercritical accretor in our Galaxy. This object is a massive eclipsing close binary system with an orbital period of 13.1 days (for a review, see Fabrika, 2004). The donor star overfills its critical Roche lobe and transfers mass to the relativistic component (very likely a black hole) on the thermal time scale; the mass transfer rate from the donor to the accretion disk is .
The ultraluminous X-ray sources (Feng & Soria, 2011) observed in external galaxies can be other examples of supercritical accretion disks. It is very likely that these objects are supercritical accretors like SS 433 (Fabrika & Mescheryakov, 2001), but their orientation is such that an observer can see the bottom of the supercritical disk funnel. Supercritical accretion is probably a necessary element for the growth of supermassive black holes (Volonteri & Rees, 2005) at early stages of the increase in quasar mass. The supercritical regime can be of fundamental importance not only for the black hole growth efficiency but also for the feedback on the galaxies and the formation of galaxies and clusters of galaxies via jets and winds. Given the importance of these processes, detailed studies of SS 433 and the structure of gas flows in this system are needed, because no other bright and close examples of supercritical accretion disks have been found.
Despite the large number of studies devoted to SS 433, the mass of the relativistic star in this system has not been measured reliably; the spread in mass determinations for the compact object is from 2 to 15 (see Fabrika & Bychkova 1990; Hillwig et al. 2004; Blundell et al. 2008; Kubota et al. 2010; see, however, Goranskij 2011). The system’s luminosity has been measured much more reliably (Cherepashchuk, 2002; Fabrika & Sholukhova, 2008), erg with its peak in the ultraviolet. Since the observed luminosity would be too high for a neutron star, a black hole with a supercritical accretion disk is believed to be in SS 433. For a black hole with a mass of , the rate of gas accretion into the disk of SS 433 roughly corresponds to 300–500 Eddington accretion rates.
The main energy release in SS 433 is accounted for by the relativistic component or, more precisely, its supercritical accretion disk. The observational manifestations of this system are completely determined by the disk orientation. Almost all of the accretion energy must be released in the hard X-ray range, but the X-ray luminosity of SS 433 ( erg ) is much lower than the bolometric one. The initial hard X-ray emission is thermalized in a powerful wind outlowing from the inner regions of the supercritical disk. The apparent size of the wind photosphere for an observer is cm. The system’s orientation is such that we cannot see the funnel base even at the times of best funnel visibility during the precessional motion of the disk. If the funnel bottom were seen, then SS 433 would probably be the most luminous X-ray source in the Galaxy with . An increase in the X-ray luminosity is predicted through the geometric collimation of emission by the supercritical disk funnel
SS 433 has precessing relativistic jets moving with a constant velocity that are formed in the funnel of the supercritical accretion disk and closely follow the disk and funnel orientation. The so-called “moving” or “relativistic” hydrogen and He I lines are formed in the jets; these emission lines move over the spectrum in accordance with the orientation of the jets relative to the observer. The spectrum of SS 433 exhibits weak absorption lines from which the orbital motion of the donor star was measured (Gies et al., 2002; Hillwig et al., 2004; Cherepashchuk et al., 2005; Kubota et al., 2010). However, the extended gaseous envelope that outlows from the donor but is no longer gravitationally bound to it may make a noticeable contribution in the absorption line. Even at the times of the deepest (“total”) eclipses of the accretion disk by the donor, the contribution from the supercritical disk to the total brightness of the system is larger than the contribution from the donor (Gies et al., 2002; Hillwig & Gies, 2008; Goranskij, 2011). According to this contribution, the extended envelope of the donor will distort signiicantly the donor’s absorption lines.
The brightest emission lines in SS 433 are the hydrogen ones that originate in the wind outflowing from the accretion disk and in the gas lost by the system through the Lagrangian point behind the disk (Blundell et al., 2008). The He I and Fe II emission lines originate in the same medium. All these lines show orbital motion with different amplitudes and with a phase lag relative to the instantaneous position of the accretion disk (Crampton & Hutchings, 1981; Kopylov et al., 1989). For this reason, it is difficult to measure the system’s mass using these lines.
The only line that reflects the motion of the relativistic component (in fact, the wind that is formed in the disk) is the He II line; it was used to measure the system’s mass function (Crampton & Hutchings, 1981; Fabrika & Bychkova, 1990). The width of the He II line is – km ; obviously, it is formed in the hottest part of the wind, possibly closer to the disk axis. The orbital radial velocity curve depends on the precessional phase, i.e., on the disk inclination to the line of sight. Knowing the behavior of this line is very important for understanding the reliability of measuring the masses.
Here, we investigate the He II line profile based on our and archival best-quality spectra and find a new component in the profile of this line that we call a “superbroad” component (SBC). We find the same components in the He I and hydrogen lines. We investigate the behavior of these components using the H and He I lines as an example. In the final part of the paper, we discuss the interpretation of the SBCs in these lines.
2 OBSERVATIONAL DATA
Our observational material consist of 44 optical spectra for SS 433 taken with different telescopes from 2003 to 2007. All spectra are only of good quality; these are the total spectra obtained during a single night. The dates of our spectroscopic observations, the precession and orbital phases, and the telescopes/instruments are given in Table 1.
In 2003, observations were carried out at the 6-m BTA telescope with the UAGS spectrograph (Cherepashchuk et al., 2005); the spectral resolution was 4 Å. At the same telescope but with the SCORPIO spectrograph (Afanasiev & Moiseev, 2005), spectra were taken in 2004–2007; the spectral resolution was 2 (2004), 2.5–3 (2005, 2006), and Å (2007). In October 2007, simultaneously with BTA, spectroscopy for SS 433 was performed at the Subaru telescope with the FOCAS spectrograph (Kubota et al., 2010); the spectral resolution was 1.5 Å.
Our spectra were supplemented with archival data. These are the 2004 spectra from the 4.2-m WHT telescope taken with the ISIS spectrograph (Clegg, 1981) with a resolution of 0.7 Å. Here, we selected a continuous set of observations consisting of six nights that covers the precessional phases when the line of sight was in the disk plane. We also used the archival data obtained in 2006 at the 8-m Gemini-North telescope with the GMOS spectrograph (Hillwig & Gies, 2008); the spectral resolution in these data was Å. The difference in the spectral resolution of our data does not affect the identification and analysis of SBCs in the line profiles.
| Date | JD 2450000+ | Telescope/spectrograph | ||||
|---|---|---|---|---|---|---|
| May 9, 2003 | 2769.51 | 0.885 | 0.079 | 16.25 | 0.796 | BTA/UAGS |
| May 10, 2003 | 2770.50 | 0.961 | 0.085 | 16.97 | 0.411 | BTA/UAGS |
| May 11,2003 | 2771.49 | 0.036 | 0.091 | 16.86 | 0.454 | BTA/UAGS |
| May 12, 2003 | 2772.51 | 0.114 | 0.097 | 16.44 | 0.667 | BTA/UAGS |
| May 13, 2003 | 2773.49 | 0.189 | 0.103 | 15.90 | 1.096 | BTA/UAGS |
| June 29, 200 | 3186.66 | 0.772 | 0.649 | 16.73 | 0.510 | WHT/ISIS |
| June 30,2004 | 3187.56 | 0.841 | 0.655 | 16.73 | 0.510 | WHT/ISIS |
| July 1,2004 | 3188.65 | 0.924 | 0.662 | 16.78 | 0.490 | WHT/ISIS |
| July 2, 2004 | 3189.67 | 0.002 | 0.668 | 16.87 | 0.450 | WHT/ISIS |
| July 3, 2004 | 3190.49 | 0.065 | 0.673 | 16.93 | 0.425 | WHT/ISIS |
| July 4, 2004 | 3191.55 | 0.146 | 0.680 | 16.80 | 0.480 | WHT/ISIS |
| Aug. 22, 200 | 3240.33 | 0.874 | 0.980 | 16.33 | 0.735 | BTA/SCORPIO |
| Aug. 23, 200 | 3241.32 | 0.950 | 0.986 | 16.96 | 0.412 | BTA/SCORPIO |
| Sep. 7, 2004 | 3256.29 | 0.094 | 0.078 | 16.31 | 0.750 | BTA/SCORPIO |
| Sep. 8, 2004 | 3257.27 | 0.169 | 0.084 | 16.21 | 0.824 | BTA/SCORPIO |
| Sep. 9, 2004 | 3258.29 | 0.247 | 0.091 | 16.09 | 0.922 | BTA/SCORPIO |
| June 7,2005 | 3529.47 | 0.976 | 0.762 | 17.17 | 0.339 | BTA/SCORPIO |
| June 8,2005 | 3530.45 | 0.051 | 0.768 | 16.92 | 0.427 | BTA/SCORPIO |
| June 9,2005 | 3531.44 | 0.127 | 0.774 | 16.83 | 0.466 | BTA/SCORPIO |
| June 10,2005 | 3532.47 | 0.205 | 0.780 | 16.60 | 0.576 | BTA/SCORPIO |
| May 20, 2006 | 3876.50 | 0.503 | 0.900 | 16.57 | 0.590 | BTA/SCORPIO |
| May 21,2006 | 3877.44 | 0.575 | 0.906 | 16.31 | 0.753 | BTA/SCORPIO |
| May 22, 2006 | 3878.49 | 0.655 | 0.913 | 16.24 | 0.801 | BTA/SCORPIO |
| May 23, 2006 | 3879.48 | 0.731 | 0.919 | 16.05 | 0.956 | BTA/SCORPIO |
| May 24, 2006 | 3880.44 | 0.804 | 0.925 | 16.04 | 0.966 | BTA/SCORPIO |
| May 25, 2006 | 3881.40 | 0.877 | 0.931 | 16.13 | 0.889 | BTA/SCORPIO |
| May 26, 2006 | 3882.40 | 0.954 | 0.937 | 16.51 | 0.625 | BTA/SCORPIO |
| May 30, 2006 | 3886.49 | 0.266 | 0.962 | 16.28 | 0.774 | BTA/SCORPIO |
| May 31, 2006 | 3887.49 | 0.343 | 0.968 | 16.29 | 0.767 | BTA/SCORPIO |
| June 7,2006 | 3893.99 | 0.840 | 0.008 | 16.18 | 0.847 | Gemini/GMOS |
| June 8,2006 | 3895.04 | 0.920 | 0.015 | 16.44 | 0.667 | Gemini/GMOS |
| June 9,2006 | 3895.96 | 0.990 | 0.020 | 16.70 | 0.525 | Gemini/GMOS |
| June 10,2006 | 3897.02 | 0.071 | 0.027 | 16.74 | 0.506 | Gemini/GMOS |
| June 11,2006 | 3898.01 | 0.147 | 0.033 | 16.39 | 0.698 | Gemini/GMOS |
| June 12,2006 | 3899.03 | 0.225 | 0.039 | 16.29 | 0.766 | Gemini/GMOS |
| June 13,2006 | 3900.03 | 0.301 | 0.045 | 16.05 | 0.955 | Gemini/GMOS |
| Oct. 4, 2007 | 4378.23 | 0.855 | 0.992 | 16.10 | 0.914 | BTA/SCORPIO |
| Oct. 5, 2007 | 4379.23 | 0.931 | 0.998 | 16.43 | 0.672 | BTA/SCORPIO |
| Oct. 6, 2007 | 4379.76 | 0.972 | 0.002 | 16.74 | 0.510 | Subaru/FOCAS |
| Oct. 6, 2007 | 4380.20 | 0.005 | 0.004 | 16.93 | 0.420 | BTA/SCORPIO |
| Oct. 7, 2007 | 4380.78 | 0.050 | 0.008 | 16.80 | 0.480 | Subaru/FOCAS |
| Oct. 7, 2007 | 4381.22 | 0.083 | 0.011 | 16.44 | 0.665 | BTA/SCORPIO |
| Oct. 8, 2007 | 4381.84 | 0.131 | 0.014 | 16.21 | 0.820 | Subaru/FOCAS |
| Oct. 10,2007 | 4383.77 | 0.278 | 0.026 | 16.03 | 0.970 | Subaru/FOCAS |
All data were reduced in a standard way, including the bias subtraction, flat fielding, the wavelength calibration of spectra, and the extraction of one-dimensional spectra. We performed all of the reduction operations in the ESO MIDAS system111http://www.eso.org/sci/software/esomidas/ (Warmels, 1992). Since we study only the line profiles here, all spectra were normalized to the continuum level. The continuum was always determined in the same way and constructed from the same reference points in the spectrum.
Here, the orbital phase (Min I) corresponds to the mid-eclipse of the accretion disk (relativistic component) by the donor star, and the precessional phase of the disk ( or “ moment”) corresponds to the maximum disk opening toward the observer or the maximum separation of the relativistic lines in the spectrum. The moments when the relativistic jets of SS 433 lie in the plane of the sky are called crossovers; they correspond to precessional phases and 0.66 (“edge-on disk”).
Most of the observations were carried out near precessional phases of about zero, because the gas outflowing from the accretion disk does not cover the donor only at these phases. These are the most optimal phases for investigating the orbital motion of the donor. Nevertheless, some of the observations in 2004 and the observations in 2005 were carried out when the disk was seen edge-on. During the 2006 observations at both BTA and Gemini, SS 433 was in an active state. Very powerful sporadic gas ejections from the disk occur in its active state (Fabrika & Irsmambetova, 2003; Fabrika, 2004); the object is very difficult to investigate. The remaining observations were carried out in the passive state of SS 433.
The photometry was obtained on the same night as the spectroscopy and was offset in time from the spectroscopy by no more than 2–3 h. The object’s sporadic variability in such time interval does not exceed 10 %. Usually, we used the images obtained immediately before the spectroscopy. Table 1 gives the magnitude measurements for SS 433. The BTA spectroscopic observations were accompanied by multicolor photometric UBVRI observations with a 1-m Zeiss telescope at the Special Astrophysical Observatory of the Russian Academy of Sciences (Kubota et al., 2010) or BVR observations with a 60-cm Zeiss telescope at the Crimean Station of the Sternberg Astronomical Institute of the Moscow State University (Cherepashchuk et al., 2005). We also used the direct images obtained during the spectroscopic observations when the telescope was pointed toward the object. The photometric data for the Gemini observations were taken from Kubota et al. (2010); these magnitudes were obtained by calibration from the Sloan g′ band to the band.
Table 1 gives the photometric coefficient calculated from the formula . This coefficient allows for the variability of SS 433 in continuum and is tied to , which corresponds to the mean out-of-eclipse brightness of SS 433 at the precessional phase of the largest disk inclination to the observer. We worked only with the normalized spectra. Brightness variations lead to variations in line intensities and equivalent widths in the normalized spectra. Lest the line intensities be distorted during the brightness variations in SS 433, we used this coefficient (unity was subtracted from the normalized spectra, and they were multiplied by ). Accordingly, all of the spectra here were corrected for the photometric coefficient. In our case (and everywhere in this paper), the relative line intensity or equivalent width is the same, with their variability reflecting the actual variability of the line fluxes.
Here, we study the He II and He I emission lines, the Bowen C III /N III - ( Å) blend, and H. Below, unless stated otherwise, the first three lines are called He II, He I, and C III /N III, respectively. All these lines are in the band. We disregard the variable contribution from these emission lines to the B band, because it is small. The strongest H line has an equivalent width of 40–50 Å; the lines in the spectrum of SS 433 change only slightly and, therefore, the intrinsic variability of these lines has virtually no effect on the total flux in the band.
3 SUPERBROAD COMPONENTS OF PROFILES
3.1 Analysis of Line Profiles
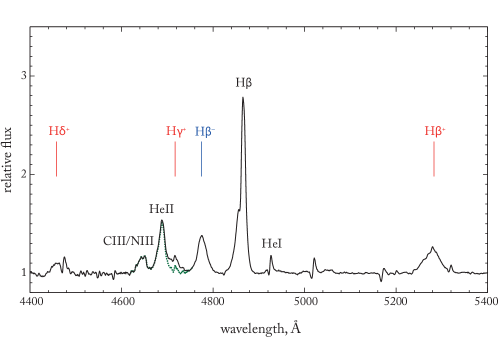
Figure 1 presents a BTA optical spectrum of SS 433. In addition to the bright stationary H and He II lines and the Bowen C III /N III blend, the spectrum exhibits lines from the relativistic jets that manifest themselves as “moving” hydrogen and He I emission lines and move over the spectrum because of a change in the jet inclination to the line of sight. Two groups of relativistic emission lines that are formed in the receding and approaching jets (in Fig. 1, H, H, H, and H, respectively) are observed. The location of the jets in space and the line positions in the spectrum are described by the kinematic model (Abell & Margon, 1979; Eikenberry et al., 2001).
When the relativistic emission lines blended with the lines of interest to us (He II, He I and H), we subtracted the relativistic line profiles. For example, the relativistic H emission line in Fig. 1 is superimposed on the wing of the stationary He II line. To subtract the relativistic emission line, we found an unblended relativistic line in the same spectrum; this is H in Fig. 1. According to the position and profile of H, we determined the position of H blending the He II line. If there were several relativistic lines in the spectrum for a given night, then we determined the Balmer decrement and found the intensity of the required relativistic line by interpolation. If there was only one free relativistic emission line in the spectrum, then the Balmer decrement for a given precessional phase was taken as the mean from Panferov et al. (1997). Figure 1 shows the corrected spectrum with the removed relativistic emission line.
When investigating the He II line profile, we identified the broad substrate of this line. The line profile often looks a multicomponent one; as a rule, two “narrow” (FWHM km ) and two “broad” (FWHM km ) components are observed. The new component is a very broad low-contrast substrate with a width of about 60 Å or 4000 km , which, nevertheless, is detected with confidence (Fig. 2–4). We called it a “superbroad” component (SBC). Similar components were detected in the He I and H lines under study and in the C III /N III blend, but the brightest SBC is observed in the He II line. Note that the same component has been observed and already identified in H (Dopita & Cherepashchuk, 1981; Bowler, 2010).
Since the left wing of the He II line and the right wing of the C III /N III blend overlap, we cannot reliably identify the SBCs of these lines separately. We suggest that the SBC is a result of the addition of the He II and C III /N III SBCs. The centroid of this combined SBC is approximately halfway between the He II and C III /N III lines (slightly shifted toward the helium line).
We used two Gaussians to fit the SBCs of the He II and C III /N III blend lines. We selected the reference points on the wings of the superbroad profile blueward of the C III /N III blend and redward of the He II line (given the He I line) as well as in the gap between these lines. In all our spectra, the reference points were always selected in the same places of the profile. Since the parameters of each individual Gaussian (C III /N III and He II) cannot be accurate, below we used only the sum of the intensities of both SBCs. The He I and H lines are single ones; the SBCs in them are easier to analyze. In these lines, the reference points were selected on the wings of the superbroad profile.
In all our spectra, the He II line clearly exhibits a SBC; the 2003 set of observations, in which the SBC is weak, constitutes an exception. Figures 2–4 present the spectra of SS 433 with the identified SBC in the He II and C III /N III, He I, H lines, respectively, from the BTA and Subaru observations in 2007. It should be noted that the spectral resolutions at these telescopes are different, and , respectively.
Figure 2 confirms that the SBCs of the He II line and the C III /N III blend cannot be measured separately, but the combined SBC is recorded with confidence. In particular, it can be clearly seen that the SBCs of these lines are strongly eclipsed by the donor star. The He I emission line and a diffuse interstellar band (DIB, ) are seen in the same figure rightward of the He II line; both these features are on the red wing of the SBC in the He II line.
The red asymmetry of the SBC in the He I line is clearly seen in Figure 3 . This line may be considered as a single one, although it blends with the Fe II line; the iron lines are considerably weaker than the helium lines in the spectrum of SS 433. In addition, both lines are very close in position. The SBC of the He I line is significantly eclipsed by the donor star, just as in the He II line.
The SBC of H is shown in Fig. 4. It is narrower than the corresponding components of the He II and He I lines; its profile is symmetric. Even if there is an asymmetry in the SBC of H, it is more likely the opposite one: the blue wing of this SBC may be brighter. The SBC in H shows no orbital eclipses.
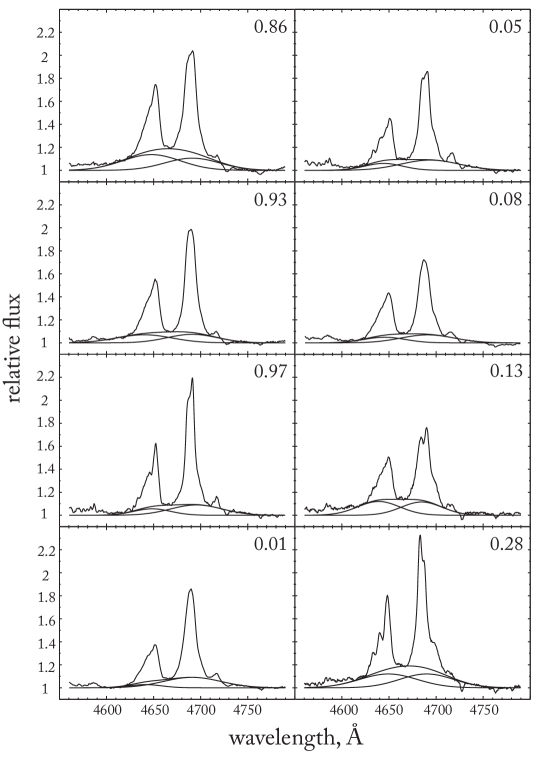
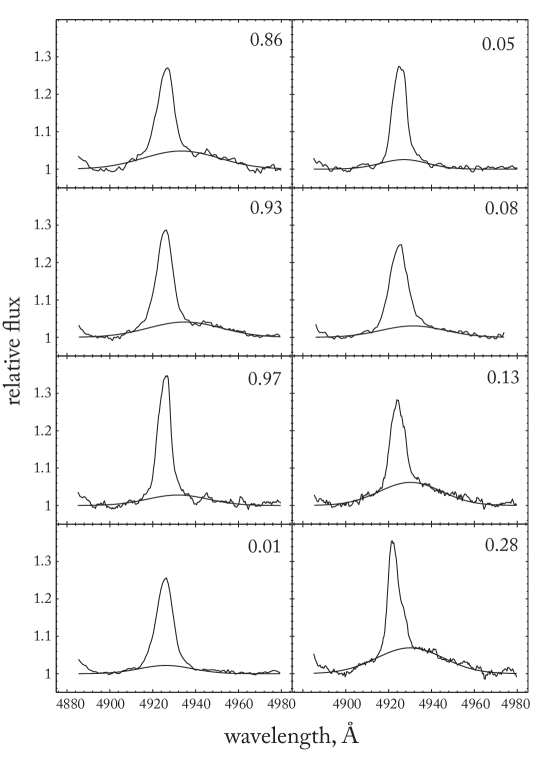

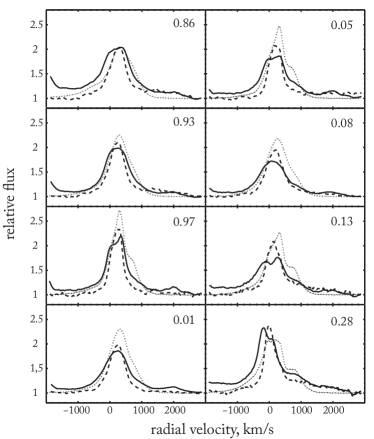
Figure 5 compares the He II, He I and H line profiles on the scale of radial velocities from the same spectra for 2007. In this figure, we introduced such a coefficient for the H and He I lines that the intensities of these lines at the first date of observations (orbital phase ) were equal to those of the He II line. This allows the relative eclipses in these three lines, when the region surrounding the relativistic object is eclipsed by the donor, to be seen. Comparison of the relative intensities shows that the H formation region is not eclipsed at all, while the He II formation region is eclipsed deeper than the He I one.
When comparing the profiles in Figs. 3–5, it should be kept in mind that the spectra were taken with different spectral resolutions. The total line flux does not depend on the resolution, while the line height does. The eclipse and out-of-eclipse profiles obtained with the same instrument should be compared.
It follows from Fig. 5 that the red wings of the SBCs in the He II and He I lines are virtually identical in the out-of-eclipse spectra, although they differ during eclipses. The blue wing of the He II line is distorted by the contribution from the C III /N III blend. The SBCs of the He II and He I lines extend to velocities of km . The red wing of He II exhibits the He I line; when recalculated to the radial velocities of He II, this line is located at 1730 km . On the contrary, the red wing of H has a different shape and evolves differently with orbital phase.
The identity of the red wings of the SBCs in the He II and He I lines, especially outside eclipses when the SBC formation and visibility regions are not distorted by the donor’s partial eclipse, suggests that these components in the He II and He I lines are the same in nature. The SBC profile in the He II line (the blue wing blends with C III /N III) may also be asymmetric, just as the SBC profile in the He I line. The SBC of H is different in origin.
The individual components in the line profiles and their behavior with orbital phase are clearly seen in the Subaru spectra in Fig. 5. Two narrow components in the He II and H lines and only one narrow component in the He I line are clearly identified. A broad red component is prominent in all three lines, with its relative intensities being different in different lines.
3.2 Orbital and Precessional Variability
In Fig. 6, the equivalent width of the sum of the He II and C III /N III SBCs is plotted against the orbital phase. A clear SBC eclipse is observed at the precessional phases of the maximally open disk (, the filled symbols in the figure). The observations at times close to the crossover (hollow squares and crosses) are also presented there; no SBC eclipses are observed at these phases, with the equivalent width of this component being small, 3–4 Å. The eclipse of the SBC formation region by the opaque conical wind (photosphere) of the accretion disk of SS 433 at edge-on disk phases can be a possible interpretation. In this case, the SBC of the He II line can be formed in the same place where the optical emission from the supercritical accretion disk originates. As is well known, during the crossover, the amplitude of the eclipses by the donor is small, their shape is irregular, and the system’s total optical brightness is considerably lower than that at a precessional phase (Panferov et al., 1997; Goranskij et al., 1998; Cherepashchuk, 2002). Note that even the depths of the optical eclipses and the SBC eclipses (Table 2) are approximately identical. However, since the SBC intensities were obtained through a Gaussian analysis, they may contain a systematic error, in contrast to the optical brightness that is measured directly.
During the October 7, 2007 observations at the open-disk phase, the SBC turned out to be weak (), the same as at the crossover phases. There was also a weak SBC during the 2003 observations (Table 1). We did not plot the data for this year in Fig. 6 in order not to overload the figure. The SBC equivalent width in 2003 was 3–4 Å and barely changed with orbital phase. SS 433 may have been in a very low state of activity at this time.
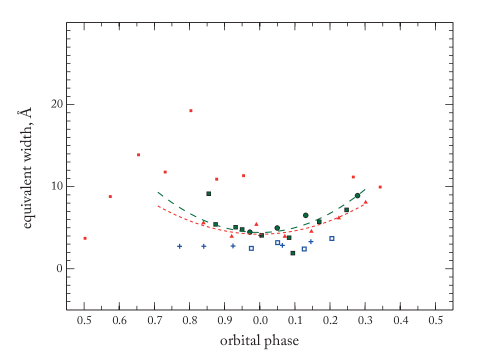
In an active state, the SBC in Fig. 6 varies sporadically, with only the BTA data exhibiting a large scatter. The Gemini spectroscopy, which began a week after the completion of the BTA observations, already shows a regular behavior of the SBC. In active states, which last from 30 to 90 days, the mean optical brightness of the object increases approximately by a factor of 1.5, and powerful flares with characteristic time scales of hours to days are observed (Fabrika, 2004; Fabrika & Irsmambetova, 2003). In an active state, neither the times of flares nor the times of gas ejections in the jets and the wind in He II can be predicted; the active states of SS 433 themselves cannot be predicted either. During flares, the SBCs of the He II and C III /N III lines become brighter by a factor of 2–3. Despite the active state, the Gemini 2006 data, on the whole, fit into the overall picture of observations in a quiescent state.
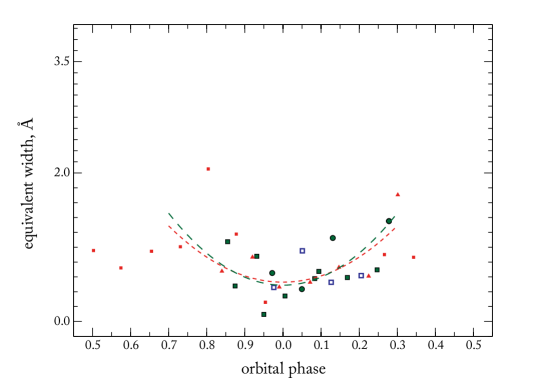
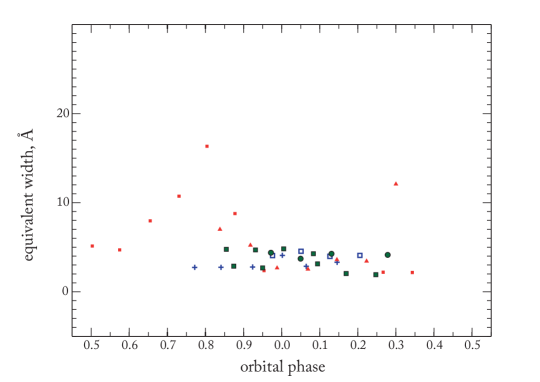
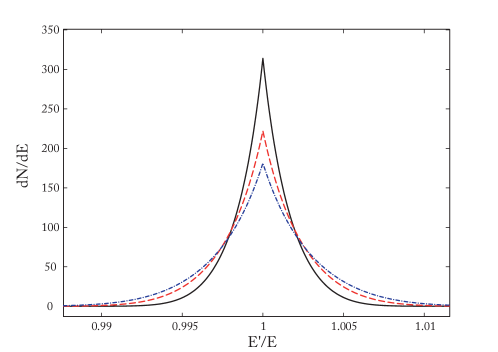
Figure 7 shows the behavior of the SBC equivalent widths in the He I line. This line did not fall into the spectral range of the WHT observations. The behavior of the SBC in the He I line agrees well with the behavior of the SBCs in the He II C III /N III lines: the same deep eclipse near phase and the absence of eclipses at the crossover phases. Figure 8 shows the behavior of the SBC equivalent widths in H; it is radically different. The SBC of H undergoes no eclipses; its intensity does not depend on the orbital motion in the system. In spite of this, it is also sensitive to flares in an active state, just as in the He II and He I lines. Recall that, in contrast to He I, the SBC of H has a symmetric profile.
Table 2 gives the eclipse depths in quiescent and active states from the fits shown in Figs. 6–7 as well as the mean equivalent widths and FWHM of the SBCs in these lines. For the “eclipse depth” here, we adopted the difference of the values at phases 0.25 and 0.0. For the active state, we provide only the data from Gemini for 2006. The errors associated with the choice of the reference points based on which the components are fitted by a Gaussian make a major contribution to the measurement error of the SBC equivalent width. To estimate the fitting error, we varied the regions of possible positions of the reference points. These regions are well determined in the line profiles. The error was calculated by the Monte Carlo method; the distribution of parameters of all possible fits for the reference points in specified regions was considered. For the BTA,WHT, Subaru, and Gemini spectra, the errors of the equivalent widths (), on average, are 0.3 Å (0.6 Å for WHT).
| He II C III /N III | He I | H | |
|---|---|---|---|
| (EW) (Q) % | 0 | ||
| (EW) (A), % | 0 | ||
| EW (Q), Å | 6.4 | 0.7 | |
| EW (A), Å | 5.4 | 0.8 | |
| FWHM (Q), Å | |||
| FWHM (A), Å |
*The width of the separate He II line is Å in the quiescent state and Å in the active state.
We found no noticeable changes in the widths of the SBCs in these lines with orbital or precessional phase. Table 2 gives the mean SBC widths for a precessional phase . In the crossover, the widths of the He II + C III /N III and He I SBCs increase insignificantly, by 7 and 10 %, respectively; the width of the SBC in H remains unchanged. It follows from Table 2 that during the active state of SS 433, the SBC of both the Bowen blend and the separate He II line narrows, while the SBC of H broadens. In the active state, the data only from Gemini (2006) are presented. The width of the sum of the He II line and the C III /N III blend may not change greatly, because its value is determined mainly by the separation between these two lines. We also provide the width of the separate He II line. However, it should be kept in mind that the error in the FWHM of this line from the blend can be significant.
We propose that the SBCs of the He II + C III /N III and He I lines are similar in origin, because their behavior is in many respects similar. These components can be formed in the high-velocity wind from the supercritical disk of SS 433. The opening angle of the wind funnel can be such that the width of the line SBC will be weakly sensitive to a change in disk precessional phase. The SBCs of these lines are formed in the same place where the optical emission originates: they are eclipsed by the donor. The absence of eclipses at edge-on disk precessional phases is also understandable: the outer edge of the funnel in the wind covers the inner parts of the funnel. The SBC formation region is located in the funnel of the wind from the supercritical disk. The asymmetric profile of the He I SBC can be a P Cyg profile in the wind from the supercritical disk. Below, we will consider the model for the SBC formation in the He II and He I lines in more detail.
The SBCs in H and the helium lines differ in many respects. The SBC of H exhibits no eclipses, and it has a relatively symmetric profile. The SBC width in H is comparable to that in the He I line, but the SBC profile in the latter is significantly asymmetric. Below, we will check whether the SBC of H can be formed through the scattering of radiation by free electrons.
4 SBC FORMATION IN H: THE SCATTERING MODEL
If the typical width of the SBCs in the He I and He II lines is taken to be FWHM – km , then we will find that for the SBCs to be formed in the disk, its characteristic size must be cm, which is smaller than the size of the donor in SS 433 by tens of times. Such an accretion disk must be completely covered by the donor in less than half an hour. On the contrary, fairly long and extended eclipses of the He II SBC formation region are observed. Because of the powerful outflow, the photospheric radius of the donor star is greater than the radius of its critical surface (Filippova et al., 2006). Therefore, the SBCs of the helium lines cannot be formed in the accretion disk. The SBC of H cannot be formed in the disk either, because we observe no eclipses of this component by the donor star. The SBCs of our lines cannot be formed in the circumbinary ring that most likely exists around the system (Filippenko et al., 1988; Fabrika, 1993; Blundell et al., 2008; Perez & Blundell, 2010; Bowler, 2011) either. The virial velocities of such a ring are an order of magnitude lower than those we observe in the SBCs.
The SBC of H must be formed in fairly extended region lest orbital eclipses be observed in it. In addition, the width of this component does not depend on precessional nodding in the system. The model of SBC formation in H as a result of scattering looks most plausible. The mean equivalent width of H is Å, while the equivalent width of its SBC is 4–5 Å (Fig. 4 and Table 2). A small optical depth (approximately equal to the ratio of the equivalent widths of the SBC and the line), , is sufficient for the formation of such a weak SBC.
The line broadening effect arises when photons from the H recombination line are scattered by free electrons. In this case, the optical depth of the medium in H must be greater than unity. Generally, the line broadening effect due to electron scattering is significant at high photon energies (X-ray lines) and high electron temperatures. However, it is observed in the optical spectra of luminous blue variables (LBVs) and hot supergiants (see, e.g., Humphreys et al., 2011; Sholukhova et al., 2011). In the case of optical lines, the relativistic corrections are of no importance, and the electron scattering is always Thomson one: .
The line profile resulting from a single scattering of monochromatic radiation is determined by the redistribution function. The redistribution function is specified as the probability of a photon with frequency and direction to have frequency and direction after its scattering. For the isotropic problem and the Maxwellian distribution of electrons, the redistribution function was found with a high accuracy by Sazonov & Sunyaev (2000). For the optical H line, it will suffice to use the redistribution function of the zeroth order of accuracy that describes the Doppler broadening (see also Hummer & Mihalas, 1967).
Figure 9 presents our calculation of single scatterings of the monochromatic H line for various electron temperatures of the gas (1, 2, and 3 eV). The profile has broad wings, and the profile wings become broader with increasing electron temperature. Since the redistribution function is normalized to unity, the energy in the line before and after scattering is the same.
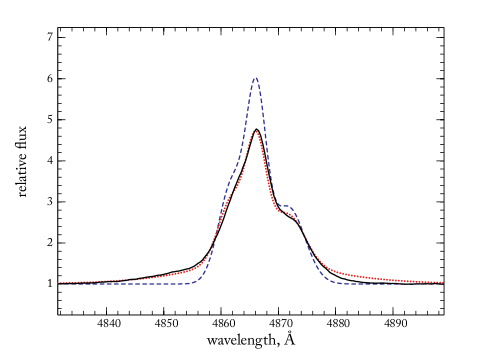
Since the optical depth for scattering is small, scattering cannot change significantly the shape of the H profile. To model the H profile, we chose the real profile of this line and represented it as three Gaussian components with FWHM from 200 to 400 km (Fig. 10), so that to describe best the central part of the profile. In this way, we obtained the model profile before scattering. Subsequently, we scattered a fraction of photons from this model profile (in accordance with the optical depth ). Figure 10 shows an example for the observation at an orbital phase of 0.97. Minimizing the residuals by the least-squares method, we found the probable domain of parameters: – kK and Thomson optical depth –.
It follows from Fig. 10 that the red wing of the SBC disagrees with the observed one. In the simple model of isotropic electron scattering, the line wings are always symmetric. An asymmetric SBC profile can be obtained if the region where scattering occurs moves. In particular, motion with a velocity from to km is needed to reconcile the SBC profiles in Fig. 10. As a rule, the emission lines in the spectrum of SS 433 consist of 3–4 components (Figs. 2–4) shifted relative to one another by 300–400 km . If the parameters and will be slightly different in different components of the H profile, then the asymmetric SBC profiles can also be explained. Besides, anisotropic scattering could also be responsible for the asymmetry in the observed profile. In view of the complexity of the gas flows in the system, we cannot concretize the scattering model. Here, it is important that electron scattering may well explain the SBC in H.
5 SBC FORMATION IN THE He II AND He I LINES: THE WIND MODEL
In contrast to H, the SBCs of the He II + C III /N III and He Ilines show distinct eclipses by the donor star at the precessional phases of the maximally open disk and eclipses by the outer edge of the disk (wind) at edge-on disk precessional phases. As has been mentioned above, this means that the helium line SBC formation region is located in the same place where the bright optical continuum source is, in the wind funnel of the supercritical disk.
Above, we have concluded that the SBCs of He II and He Iare similar in nature. The red wings of the SBCs in these lines are identical, while the blue wing of the first line is distorted by the Bowen blend; in the blue wing of the second line, the self-absorption is observed (which also argues for the Doppler broadening of the SBCs in these lines). We propose that the SBCs of the He II and He I lines are formed in the high-velocity regions of the wind from the disk of SS 433. Below, we calculate the He II line profile within the model of a wind from a supercritical accretion disk. Our goal is to show that both the emergence of a SBC with a width up to Å and the formation of relatively narrow components in the profile with a width of several hundred km are possible in this model.
As a result of the high accretion rate in SS 433, , much of the infalling material is ejected from the system through radiation pressure in the inner parts of the supercritical disk. Our model is based on the concept of supercritical disks by Shakura & Sunyaev (1973), according to which the accretion rate in the disk within the spherization radius cm is , where is the mass of the compact object, and is the Eddington luminosity. Allowance for the advection of radiation in the disk within the spherization radius (Lipunova, 1999; Poutanen et al., 2007) does not change the outflow pattern fundamentally.
The velocity of the wind outflowing within the spherization radius is approximately equal to the virial one at this radius. Part of the outflowing gas from the innermost regions is collimated and observed in the form of relativistic jets from SS 433. The brightest hydrogen and helium emission lines are formed in the relatively slow wind (a few thousand km ). The photosphere of this wind has a characteristic size cm; the temperature of the photosphere is K (Fabrika, 2004). If the SBC formation region is projected onto the hot photosphere (for example, the far wall of the wind funnel), then a P Cyg profile, i.e., a red asymmetry of the profile, can arise, which we observe for the SBC of the He I line.
We use the Sobolev (1957) approximation to construct the model line profile, because the velocity gradients in the wind exceed considerably the width of the thermal profile. A simple wind geometry is specified in the model; the wind is bounded by two spherical sectors. The wind funnel opening angle and the funnel wall thickness are model parameters (Fig. 11).
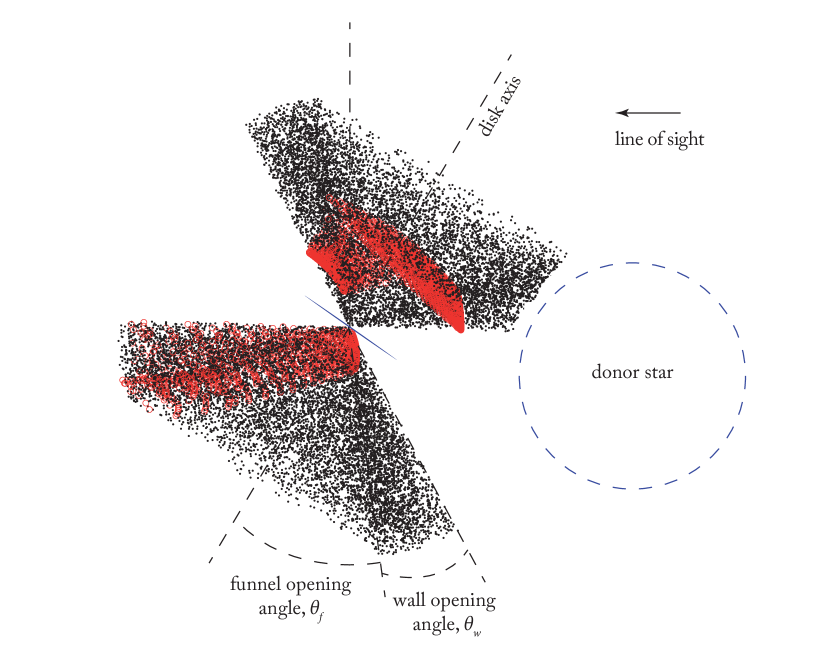
We calculated the wind in a region with a radius of cm, which roughly corresponds to the system’s size. In the plane of the sky, the region was broken down into 100 in y and 200 in z (the jet axis) cells, with the radiation conditions being homogeneous in each of them. The funnel opening angle (Fig. 11) and the wall opening angle are model parameters. Other parameters are the gas ejection velocity within the spherization radius (the parameter in the virial velocity ), the exponent in the dependence of the gas emissivity in the line on radius , the exponent of the emissivity in its dependence on polar angle (the funnel wall heating efficiency), and the radial velocity semiamplitudes of the compact object and the donor and . The thin accretion disk (at ) is also shown in Fig. 11, the disk size was calculated (Leibowitz, 1984; Kallrath & Milone, 1999) from the mass ratio .
Individual portions of gas were distributed over the domain of Monte-Carlo computation; we used points in the model. To calculate the line profile, we summed the radiation from all the wind portions visible to an observer; the line profile was then convolved with a thermal profile of width FWHM km .
Individual parts of the wind in the model are eclipsed by the donor star, the accretion disk, and the photosphere of the wind itself; the eclipsed regions are determined by the precessional and orbital phases. These phases also determine the location of the wind photosphere that we calculate by integrating the optical depth for Thomson scattering to from infinity along the line of sight. The shape of the photosphere can be complex. The wind region on the line of sight located between the photosphere and observer is assumed to be visible.
We computed two wind models. In the first model (the model with mixing), the entire wind outflowing within the spherization radius is averaged over the momenta, being still deep in the funnel under the wind photosphere. The wind velocity at this radius is everywhere the same; the observer sees different radial velocities due to different projections onto the line of sight. In the second model (the ballistic model), all portions of gas move without any interaction along their trajectories. Having begun its motion from radius with an initial velocity , the gas moves only in the gravity field of the compact object.
The two models are two extreme cases of outward wind propagation. On the one hand, we fail to obtain outflow velocities appreciably higher than km in the model with mixing and with the known accretion rate in SS 433; on the other hand, it is obvious that there must be an interaction of the winds within the spherization radius in the supercritical disk funnel. The gas outflow pattern can be very complex. Nevertheless, these two simple models explain the main trends in the He II line profile. Our model is not self-consistent, but it may well simulate the Shakura-Sunyaev supercritical disk.
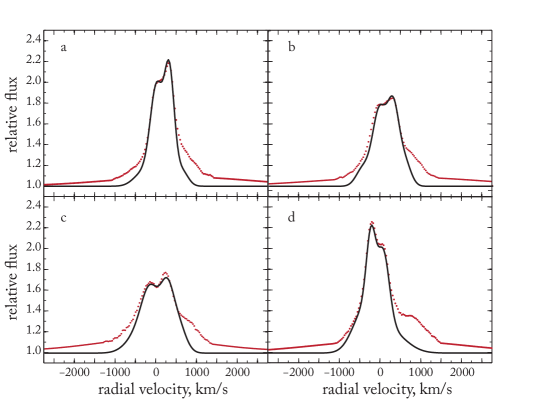
In Fig. 12, the model He II profiles constructed in the model with mixing are compared with the observations. The orbital and precessional phases in the model correspond to the real ones. The SBCs in the “observed” He II profiles are the Gaussian fits of these components that were added to the real He II profiles (with the subtracted SBC) from Fig. 2. The model with mixing can reproduce neither the broad components nor the SBCs. However, it reproduces well the narrow components originating in the wind. The pattern of asymmetry in the profile of this line (at the phases of the maximally open disk before, during, and after an eclipse by the donor) shown in the figure is typical of SS 433. Our model does reproduce the typical evolution of the He II profile.
The model parameters with which the observed profiles are described best (Fig. 12) are the following: the exponents in the dependences of the gas emissivity on distance and polar angle are – and , respectively, the funnel opening angle is , and the wall opening angle is . We estimate these parameters as approximate ones. Investigating the He II profile is not among the goals of this paper; we are planning to do this in the next paper. Here, we describe the SBCs of the line profiles.
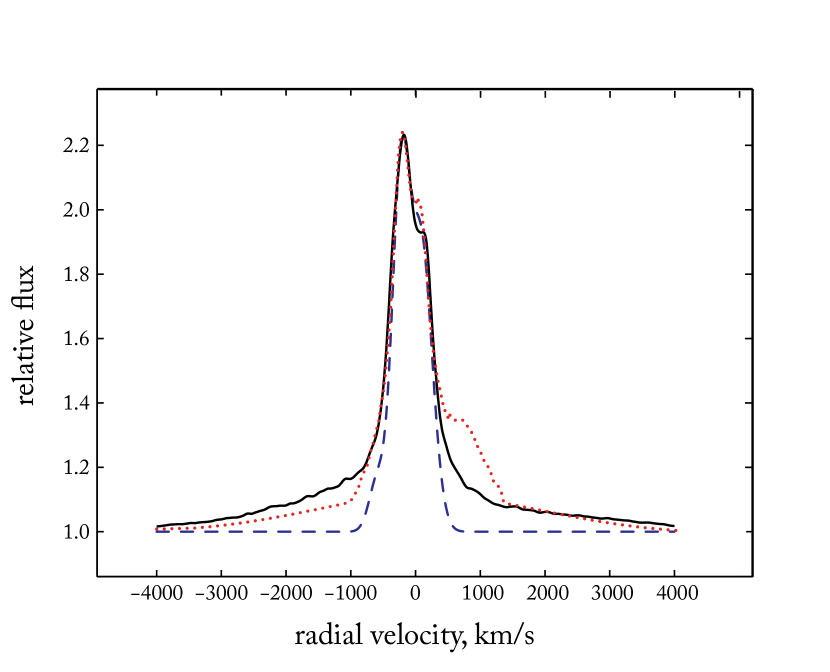
Figure 13 shows the two model profiles obtained in the approximation with mixing and in the ballistic approximation. A SBC appears in the latter case; consequently, we can explain this component in the ballistic approximation. Note that we cannot accurately reconstruct the blue wing of the SBC, because the C III /N III blend is in close proximity. None of our models can explain the broad components (Figs. 2–4 and 12). In fact, both our approximations are extreme cases. The interaction of the winds in the supercritical disk funnel may well give rise to intermediate-width components.
Above, we put forward the arguments that the SBCs of the helium lines are formed through a velocity spread in the wind, and that this component in H is formed through electron scattering. Indeed, the helium and hydrogen line formation regions are different; the former are eclipsed by the donor. The SBC in He I has a very large red asymmetry that is difficult to explain by electron scattering. In He II, we reliably detect only the red wing of the SBC; this component might be symmetric. All that we know about the formation geometry of the He II and H lines is that they are emitted in the wind from the supercritical disk, and the formation region of the former line is considerably smaller than that of the latter one. For this reason, the optical depth for electron scattering for the He II line must be smaller than that for H; recall that the optical depth for electron scattering found by modeling the SBC of H is about 0.25–0.35.
An additional factor affecting the role of electron scattering in the formation of the H and He II profiles is the optical depth in these lines. Scattering in a line increases the effective photon path in the scattering region, “tangling” the photon escape trajectory.
According to Pozdnyakov et al. (1983), most of the photons from a spectral line will undergo at least one scattering by free electrons if the following condition is met:
Here, is the optical depth for scattering the line photons by free electrons, and is the optical depth in the line. If, alternatively, the reverse condition is met, then the line photons, on average, undergo less than one but more than scatterings by electrons.
The optical depth in a line is defined as , where is the number density of the ions corresponding to the transition, is the absorption cross section that for the line center is
here, is the oscillator strength of the transition under consideration, is the Doppler width of the line. For the transition in the hydrogen atom, , while for the transition in He II, (the AtomDB database; Foster et al. (2012)). At the same temperature, we find .
Let us compare the optical depths in the He II and H lines by assuming their formation regions to be identical. At a mass loss rate in the wind from SS 433 M , an outflow velocity of km , and distances of cm, the particle number density in the wind can be cm-3.
Estimating the number of particles corresponding to the transitions in these lines in the Saha-Boltzmann approximation, we find that the condition is met at temperatures – K. Since H is emitted in a much more extended region and at lower temperatures, the appearance of scattered components in this line is much more probable than in the He II line.
6 CONCLUSIONS
We detected new components in the profiles of main stationary lines for SS 433 (the hydrogen, He I, He II lines and the Bowen C III /N III blend) and investigated these components in the He II , He I , and H emission lines. SBCs are recorded with confidence in the profiles of the brightest lines. They are low-contrast substrates with a width of 2000–2500 km in He I and H and 4000–5000 km in He II that are considerably broader than the lines themselves. It is unlikely that the SBCs will affect the accuracy of measuring the radial velocities of the lines in SS 433 because of their large width.
We found that the SBCs of the He II and He I lines are eclipsed by the donor star. The behavior of the SBC eclipse depth for these lines as a function of the disk inclination to the line of sight (precessional phase) turned out to be similar in main features to the behavior of the optical brightness of SS 433. The same component in H shows no variability with precessional phase and has no orbital eclipses. This leads us to conclude that the SBCs of the helium and hydrogen lines are different in origin. Since the SBC of the He I emission line has a distinctly asymmetric P Cyg profile, electron scattering cannot be responsible for the appearance of the SBCs in the helium lines.
In the case of H, the most probable mechanism for the formation of this component is the line broadening through electron scattering. We described a simple model of the H formation region that is extended enough for the eclipses to be unobservable. We found that the gas in this region with a temperature – kK (rather closer to the low border) and an optical depth for Thomson scattering – reproduces well the SBC width and intensity in H.
The SBCs of the helium lines are formed in the high-velocity gas of SS 433. We used the model of supercritical disk accretion proposed by Shakura & Sunyaev (1973), whose main component is the presence of a powerful wind from the accretion disk within the spherization radius. We computed a model of the wind from the supercritical disk that corresponds in main features to the Shakura-Sunyaev approximation. The main patterns of the He II line profiles are well reproduced in this model. We can explain not only the appearance of the SBCs but also the evolution of the central two-component part of the profile of this line during its eclipse by the donor star.
Our model may well be used to analyze the profiles of the lines in SS 433 originating in the supercritical disk, but this requires spectroscopic observations with a resolution of at least . We leave a more detailed study of the behavior of the He II line using our model for the next paper.
Acknowledgements.
We wish to thank S. Yu. Sazonov for helpful discussions. We used archival data from the 4.2-m William Herschel Telescope (WHT) of the Isaac Newton Group (ING) at the Observatorio del Roque de los Muchachos. This work was supported by the Russian Foundation for Basic Research (project N 10–02–0046), the Program for Support of Leading Scientific Schools of Russia (N 4308.2012.2), and the Ministry of Education and Science of Russia (N 8406, 8416).References
- Abell & Margon (1979) G. Abell and B. Margon, Nature 279, 701 (1979).
- Afanasiev & Moiseev (2005) V. L. Afanasiev and A. V. Moiseev, Astron. Lett. 31, 194 (2005).
- Blundell et al. (2008) K. Blundell, M. Bowler, and L. Schmidtobreick, Astrophys. J. 678, L47 (2008).
- Bowler (2010) M. Bowler, Astron. Astrophys. 516, A24 (2010).
- Bowler (2011) M. Bowler, Astron. Astrophys. 531, A107 (2011).
- Cherepashchuk (2002) A. Cherepashchuk, Space Sci. Rev. 102, 23 (2002).
- Cherepashchuk et al. (2005) A. Cherepashchuk, R. Sunyaev, S. Fabrika, et al., Astron. Astrophys. 437, 561 (2005).
- Clegg (1981) R. Clegg, Gemini 31, 8 (1991).
- Crampton & Hutchings (1981) D. Crampton and J. Hutchings, Astrophys. J. 251, 604 (1981).
- Dopita & Cherepashchuk (1981) M. A. Dopita and A. M. Cherepashchuk, Vistas Astron. 25, 51 (1981).
- Eikenberry et al. (2001) S. Eikenberry, P. Cameron, B. Fierce, et al., Astrophys. J. 561, 1027 (2001).
- Fabrika (1993) S. Fabrika, Mon. Not. R. Astron. Soc. 261, 241 (1993).
- Fabrika & Bychkova (1990) S. Fabrika and L. Bychkova, Astron. Astrophys. 240, L5 (1990).
- Fabrika & Irsmambetova (2003) S. Fabrika and T. Irsmambetova, in New Views on MICROQUASARS, Proceedings of the 4th Microquasars Workshop (Institut d’Etudes Scientifiques de Cargese, Corsica, France, 2003), p. 276.
- Fabrika (2004) S. Fabrika, Astrophys. Space Phys. Rev. 12, 1 (2004).
- Fabrika & Mescheryakov (2001) S. Fabrika and A. Mescheryakov, in Galaxies and their Constituents at the Highest Angular Resolutions, Proceedings of the IAU Symposium No. 205, Manchester, UK, Aug. 15–18, 2000 Ed. by R. T. Schilizzi (IAU, 2001), p. 268.
- Fabrika & Sholukhova (2008) S. Fabrika and O. Sholukhova, in Proceedings of the 7th Microquasar Workshop: Microquasars and Beyond, Foca, Izmir, Turkey, Sep. 1?5 (2008), p. 52.
- Feng & Soria (2011) H. Feng and R. Soria, New Astron. Rev. 55, 166 (2011).
- Filippenko et al. (1988) A. Filippenko, R. Romani, W. Sargent, et al., Astron. J. 216, 822 (1988).
- Filippova et al. (2006) E. Filippova, M. Revnivtsev, S. Fabrika, et al., Astron. Astrophys. 460, 125 (2006).
- Foster et al. (2012) A. Foster, L. Ji, R. Smith, et al., Astrophys. J. 756, 128 (2012).
- Gies et al. (2002) D. R. Gies, W. Huang, and M. V. McSwain, Astrophys. J. 578, L67 (2002).
- Goranskij (2011) V. Goranskij, Perem. Zvezdy 31, 5 (2011).
- Goranskij et al. (1998) V. Goranskij, V. Esipov, and A. Cherepashchuk, Sov. Astron. 42, 209 (1998).
- Hillwig & Gies (2008) T. Hillwig and D.Gies, Astrophys. J. 676, L37 (2008).
- Hillwig et al. (2004) T. Hillwig, D. Gies, W. Huang, et al., Astrophys. J. 615, 422 (2004).
- Hummer & Mihalas (1967) D. Hummer and D. Mihalas, Astrophys. J. 150, L57 (1967).
- Humphreys et al. (2011) R. Humphreys et al., Astrophys. J. 743, 118 (2011).
- Kallrath & Milone (1999) J. Kallrath and E. F. Milone,Eclipse Binary System: Modeling and Analysis (Springer, New York, 1999).
- Kopylov et al. (1989) I. M. Kopylov, L. V. Bychkova, S. N. Fabrika, et al., Sov. Astron. Lett. 15, 474 (1989).
- Kubota et al. (2010) K. Kubota, Y. Ueda, S. Fabrika, et al., Astrophys. J. 709, 1374 (2010).
- Leibowitz (1984) E. M. Leibowitz, Mon. Not. R. Astron. Soc. 210, 279 (1984).
- Lipunova (1999) G. V. Lipunova, Astron. Lett. 25, 508 (1999).
- Panferov et al. (1997) A. Panferov, S. Fabrika, and V. Rakhimov, Astron. Rep. 41, 342 (1997).
- Perez & Blundell (2010) S. Perez and K. Blundell, Mon. Not. R. Astron. Soc. 408, 2 (2010).
- Poutanen et al. (2007) J. Poutanen, G. Lipunova, S. Fabrika, et al., Mon. Not. R. Astron. Soc. 377, 1187 (2007).
- Pozdnyakov et al. (1983) L. Pozdnyakov, I. Sobol, and R. Syunyaev, Astrophys. Space Phys. Rev. 2, 189 (1983).
- Sazonov & Sunyaev (2000) S. Sazonov and R. Sunyaev, Astrophys. J. 543, 28 (2000).
- Shakura & Sunyaev (1973) N. Shakura and R. Sunyaev, Astron. Astrophys. 24, 337 (1973).
- Sholukhova et al. (2011) O. N. Sholukhova, S. N. Fabrika, A. V. Zharova, et al., Astrophys Bull. 66, 123 (2011).
- Sobolev (1957) V. Sobolev, Sov. Astron. 1, 678 (1957).
- Volonteri & Rees (2005) M. Volonteri and M. Rees, Astrophys. J. 633, 624 (2005).
- Warmels (1992) R. Warmels, ASP Conf. Ser. 25, 115 (1992).