1\Yearpublication2014\Yearsubmission2013\Month1\Volume335\Issue1\DOIThis.is/not.aDOI
XXXX
High-resolution absorption spectroscopy of the circumgalactic
medium
of the Milky Way
Abstract
In this article we discuss the importance of high-resolution absorption spectroscopy for our understanding of the distribution and physical nature of the gaseous circumgalactic medium (CGM) that surrounds the Milky Way. Observational and theoretical studies indicate a high complexity of the gas kinematics and an extreme multi-phase nature of the CGM in low-redshift galaxies. High-precision absorption-line measurements of the Milky Way’s gas environment thus are essential to explore fundamental parameters of circumgalactic gas in the local Universe, such as mass, chemical composition, and spatial distribution. We shortly review important characteristics of the Milky Way’s CGM and discuss recent results from our multi-wavelength observations of the Magellanic Stream. Finally, we discuss the potential of studying the warm-hot phase of the Milky Way’s CGM by searching for extremely weak [Fe x] and [Fe xiv] absorption in optical QSO spectra.
keywords:
Galaxy: halo - Galaxy: structure - quasars: absorption lines - techniques: spectroscopic1 Introduction
Observational and theoretical studies demonstrate that the circumgalactic medium (CGM) is a key component in the on-going process of galaxy formation and evolution. The CGM is usually defined as diffuse neutral and ionized gas that is located within the virial radius of a galaxy, but outside of its (main) stellar body. The gas circulation in the CGM is governed by the accretion of metal-poor gas from the intergalactic medium (IGM), providing fuel for star-formation in galaxies, and the expulsion of metal-enriched material as part of outflows and galactic winds, the latter process being a result of star-formation activity. Consequently, large-scale feedback processes, which are regulated mostly by the physical conditions in the gas, determine the gas distribution in the CGM and its kinematics.
In view of the extreme multi-phase nature of the CGM (that has typical gas temperatures and densities in the range K and cm-3, respectively), absorption spectroscopy towards extragalactic background sources represents a particularly powerful method to study the nature and distribution of circumgalactic gas in the local and distant Universe. This is because of the presence of a large number of diagnostic lines of low, intermediate, and high metal ions in the ultraviolet (UV) and at optical wavelengths. High-resolution absorption spectra of quasi-stellar objects (QSOs) and other extragalactic point sources therefore provide a wealth of information on the physical and chemical properties of the different gas phases in the CGM of the Milky Way and other galaxies (e.g., Wakker et al. 1999; Sembach et al. 2003; Richter et al. 2001a,2001b,2009,2011; Tripp et al. 2003; Fox et al. 2005,2010; Collins et al. 2009; Shull et al. 2009; Prochaska et al. 2011; Tumlinson et al. 2011a; Lehner et al. 2013; Keeney et al. 2013; Stocke et al. 2013).
Most CGM absorption-line studies at low redshift are limited to a single QSO sightline that passes the virial radius of a foreground galaxy (e.g., Thom et al. 2011; Tumlinson et al. 2011b; Ribaudo et al. 2011). Only for very nearby galaxies, the angular size of the circumgalactic region is expected to be large enough to have several sufficiently bright background QSOs per galaxy available that can be used for a multi-sightline analysis of circumgalactic gas. Because of these statistical restrictions, the Milky Way, M31, and other galaxies in the Local Group represent important test objects to investigate the properties of circumgalactic gas absorbers along a large number of randomly distributed sightlines and to link the observed sky distribution of the different CGM gas phases in the Local Group with the statistical properties of QSO absorption-line systems (Richter 2012; Rao et al. 2013).
2 Quasar absorption spectroscopy of the Milky Way’s circumgalactic medium
2.1 Kinematics of local circumgalactic gas
Absorption and emission measurements indicate that the Milky Way’s circumgalactic gas spans a LSR velocity range between and km s-1 (e.g., Wakker et al. 2004). The usual classification scheme of the Milky Way’s circumgalactic gas features includes the so-called “high-velocity clouds” (HVCs) and “intermediate-velocity clouds” (IVCs). We here define HVCs as gaseous structures at deg (located outside the Galactic disk) that are observed in H i 21cm emission or in absorption against an extragalactic background source at high radial velocities, km s-1 (see Wakker & van Woerden 1997; Richter 2006 for reviews on HVCs). Extra-planar clouds with somewhat smaller radial velocities in the range km s-1 are referred to as IVCs.
Optical absorption spectroscopy of halo stars that span a distance range of several kiloparsecs in the direction of known 21cm HVCs imply that most (if not all) of the HVCs are located within kpc of the Milky Way (e.g., Wakker et al. 2007,2008; Thom et al. 2006,2008; Lehner et al. 2011,2012). HVCs thus represent gaseous structures that are located in the inner and outer Galactic halo well within the virial radius of the Milky Way.
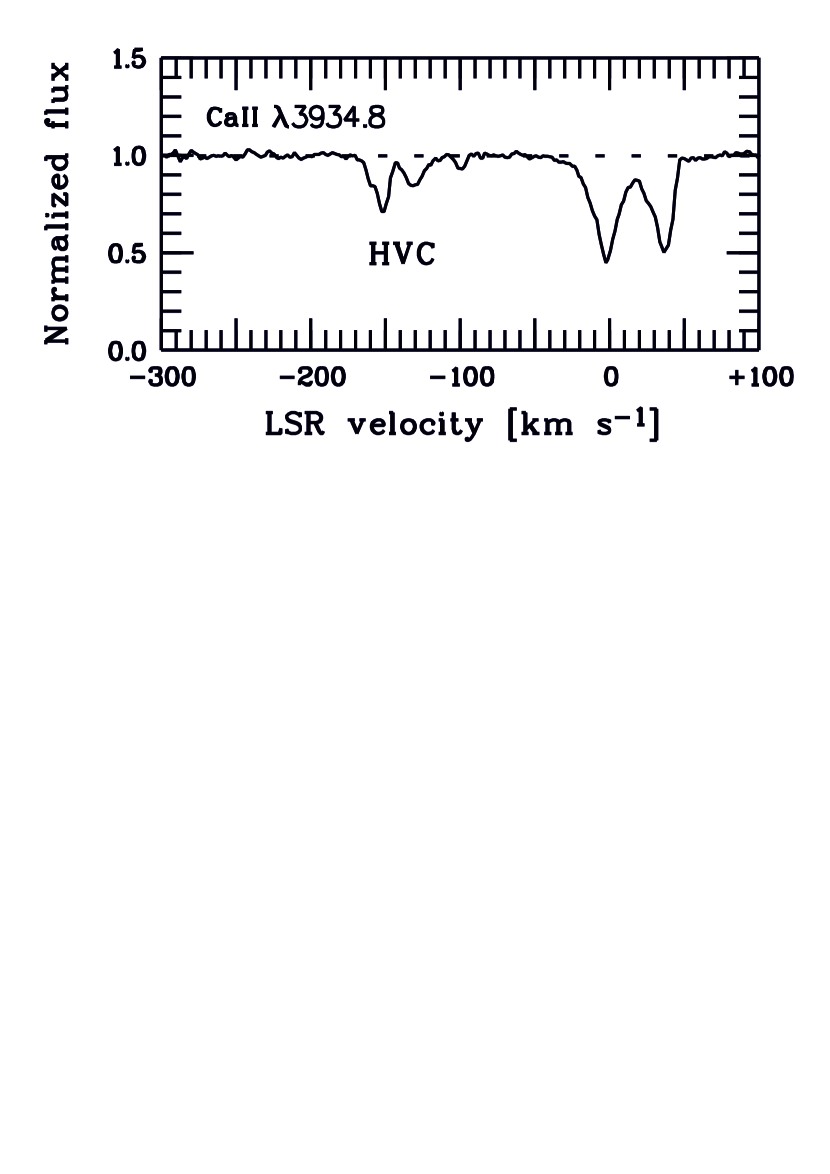
Using high-resolution () optical spectra of QSOs and other extragalactic background sources obtained with the Ultraviolet and Visible Echelle Spectrograph (UVES) installed on the Very Large Telescope (VLT), we have studied the distribution of neutral gas and its kinematics in the Milky Way halo along a large number of sightlines (Richter et al. 2005; Ben Bekhti et al. 2008,2011). As an example for these data, we show in Fig. 1 the velocity profile of Ca ii absorption in the VLT/UVES spectrum of the QSO PKS 1448232. Apart from the absorption related to the local disk of the Milky Way in the range to km s-1, high-velocity Ca ii absorption is visible between and km s-1, originating in neutral gas in an HVC in the Milky Way halo, located several kpc above the Galactic plane (see Richter et al. 2005). In Ben Bekhti et al. (2008,2011) we have analyzed several hundred of such Ca ii spectra and have studied the velocity distribution of extra-planar neutral gas structures in the Milky Way halo. We find that the majority of the Ca ii halo absorbers have radial velocities in the range km s-1, but there is an excess of absorbers with negative radial velocities. A similar trend is observed in the UV using Si ii as tracer for neutral gas in the Milky Way halo (Herenz et al. 2013). This excess possibly reflects a net-infall of neutral gas towards the Milky Way as part of the on-going gas accretion of the Galaxy (Richter 2012).
Based on UV observations of five-times ionized oxygen (O vi) with the Far Ultraviolet Spectroscopic Explorer (FUSE), Sembach et al. (2003) have shown that the velocity distribution of the highly-ionized circumgalactic gas component of the Milky Way extends to substantially higher radial velocities, with many O vi absorbers located in the velocity range km s-1. The (on average) higher radial velocities of circumgalactic O vi compared to Ca ii and Si ii most likely indicate that the highly-ionized gas phase in the CGM is spatially more extended than the neutral phase. For Milky Way-type galaxies, that do not drive massive winds of ionized gas into their circumgalactic environment, such a trend is not surprising: as the gas approaches the central region of the Galaxy’s potential well, the gas pressure increases, while the ionization fraction is expected to decrease because of enhanced cooling and recombination. Constrained simulations of the Milky Way and its gaseous environment further support this scenario (Nuza et al. 2013; Marasco et al. 2013).
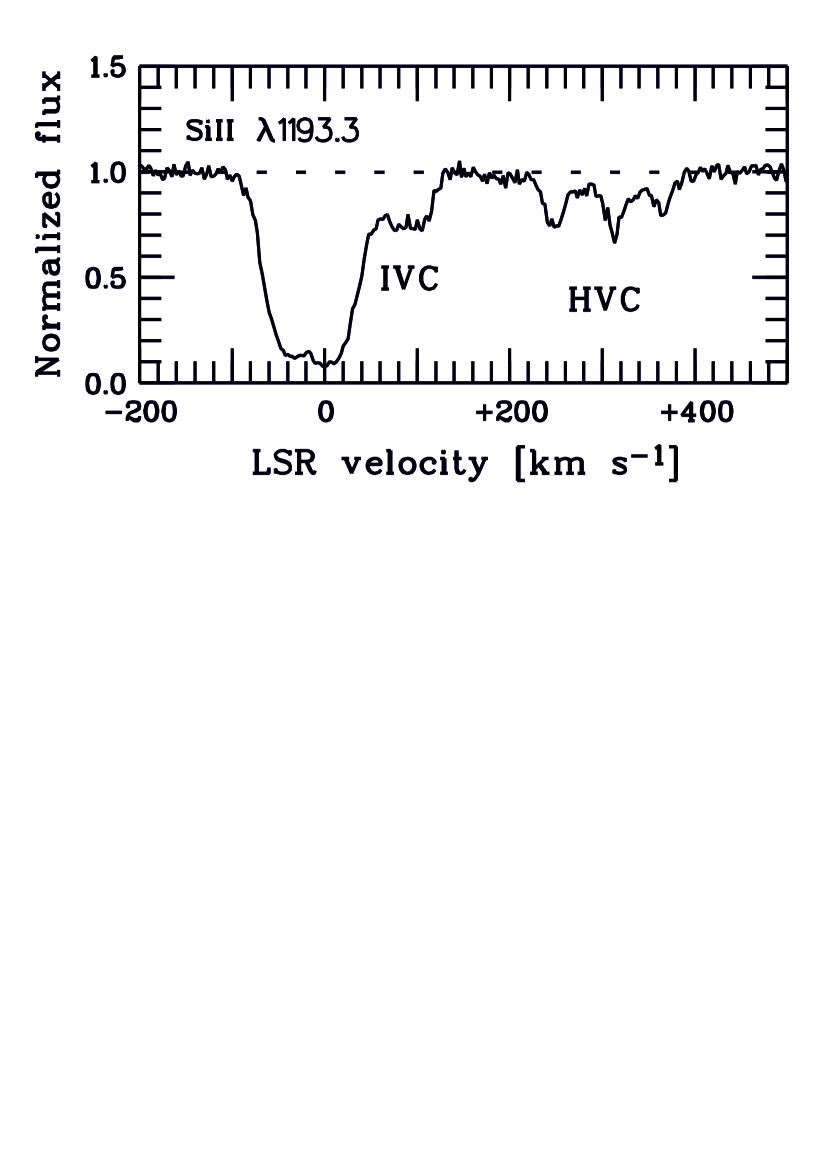
The velocity pattern of Galactic IVCs and HVCs can vary dramatically, reflecting the inhomogeneous space distribution and radial-velocitiy distribution of gas structures and satellite galaxies in the circumgalactic environment of the Milky Way and in the Local Group. This aspect is demonstrated in Fig. 2, where we show the complex velocity profile of Si ii absorption in the direction of the Seyfert 1 galaxy IRAS F042505718, based on data obtained with the Cosmic Origins Spectrograph (COS) onboard the Hubble Space Telescope (HST). At galactic coordinates deg and deg, this sightlines passes an IVC in the inner Milky Way halo and the so-called Magellanic Stream (at km s-1; see Sect. 2.3). In addition, some of the high-velocity Si ii absorption possibly originates in the extended ionized gaseous envelope of the Large Magellanic Cloud (LMC).
2.2 Characteristics of optical and UV spectra
Most of the low, intermediate and high metal ions have their transitions in the UV range. With sufficiently bright UV background sources (such as QSOs), the absorption lines arising from the transitions can be used very efficiently to explore the physical nature and chemical composition of gaseous material that is located between us and the background source. Among the most powerful diagnostic lines in the UV, that are commonly used to study cold, warm, and hot gas in the ISM, CGM, and IGM, are the lines from C ii , C iv , O i , O vi , Si ii , Si iii , Si iv , Mg ii , and Fe ii . Despite the importance of the UV range for our understanding of the diffuse gas component in the local Universe, current UV spectra of extragalactic (and Galactic) background sources are limited in spectral resolution and signal-to-noise (S/N) simply due to the fact that space-based observatories are required to obtain these data. With a resolving power of up to , the Space Telescope Imaging Spectrograph (STIS) onboard HST currently is the UV spectrograph with the highest spectral resolution, but only a very limited number of extragalactic background sources can be observed with STIS at a S/N of and a typical spectral resolution of . Another powerful UV spectrograph onboard HST is COS, which covers a NUV and FUV wavelength range similar to that of STIS, but which has a substantially higher sensitivity. Thus, COS is able to observe hundreds of extragalactic targets at high S/N, yet the spectral resolution is limited to .
To overcome the problem of lack in spectral resolution and to minimize the resulting systematic errors for the determination of column densities and absorber kinematics, supplementary optical spectra can be used. The optical regime covers only a very limited number of useful transitions of metal ions. These transitions are predominantly from neutral and singly-ionized species (e.g., Na i Ca ii , Ti ii ; but see Sect. 2.4). Optical spectrographs installed on m-class telescopes on the ground are, however, able to deliver hundreds of high-S/N spectra (S/N ) even at high spectral resolution (; see Fig. 1). Such spectra provide a deep insight into the velocity-component structure and gas kinematics of the absorbers (e.g., Welty et al. 1999) and thus can complement lower-resolution UV spectra that deliver detailed information on the chemical composition and the physical conditions of the gas.
In the following, we provide an example for the combined use of optical and UV spectral data to explore the nature of the Milky Way’s circumgalactic medium.
2.3 A prime example: absorption spectroscopy of the Magellanic Stream
One of the most prominent circumgalactic gas features of the Milky Way is the Magellanic Stream (MS). The Stream represents a massive () gaseous structure consisting of both neutral and ionized gas and is believed to be a result of the interaction of the two Magellanic Clouds as they approach the Milky Way (e.g., Wannier & Wrixon 1972; Gardiner & Noguchi 1996; Weiner & Williams 1996; Putman et al. 2003; Brüns et al. 2005). Although the MS has a relatively large distance of kpc, it covers about 4 percent of the 21cm high-velocity sky (see Wakker 2004). The Stream is known to contain heavy elements as well as dust grains and molecular hydrogen (Gibson et al. 2000; Sembach et al. 2001; Richter et al. 2001a; Fox et al. 2013; Richter et al. 2013). Ever since its detection more than 40 years ago it was speculated that the MS has its origin in one or the other Magellanic Cloud.
Because of the relatively large angular extent of the MS, there are a number of bright background quasars behind the Stream that can be used to study the chemical composition of the MS by way of absorption spectroscopy (e.g., Fox et al. 2005,2010). Tidal models indicate that the main body of the Stream most likely was stripped from its parent galaxy Gyr ago (e.g., Gardiner & Noguchi 1996; Connors et al. 2006; Besla et al. 2010,2012) and the MS does not contain any stars that could have influenced its metallicity since then. Therefore, the present-day abundance of heavy elements in the MS represents the chemical composition of its parent galaxy Gyr ago. From the analysis of a UV spectrum of the Seyfert 1 galaxy Fairall 9 obtained with the Goddard High Resolution Spectrograph (GHRS) onboard the HST, together with Parkes 21 cm H i data, Gibson et al. (2000) obtained a metallicity of the Stream of [M/H ( solar). Although this measurement represented a major step in our understanding of the Stream’s chemical composition, it was not accurate enough to clearly place the origin of the MS in either the SMC or the LMC.
To further increase the accuracy of the metallicity determination of the Stream towards Fairall 9 and other background targets and to study in detail the chemical composition of the gas and dust in the MS, more accurate spectral data are needed. As part of our ongoing project to study the properties of the Magellanic Stream in absorption, we recently have obtained for six lines of sight (including the Fairall 9 sightline) high-resolution optical data from VLT/UVES and medium-resolution UV data from HST/COS, all data sets providing absorption spectra with excellent S/N ratios (Fox et al. 2013). Only the combination of optical data with high spectral resolution and UV data with high S/N ratio enables us to fully resolve the Stream’s velocity-component structure and to substantially minimize the systematic errors in the determination of metal column densities, because the MS is a massive gas cloud with complex internal kinematics (e.g., Nidever et al. 2008).
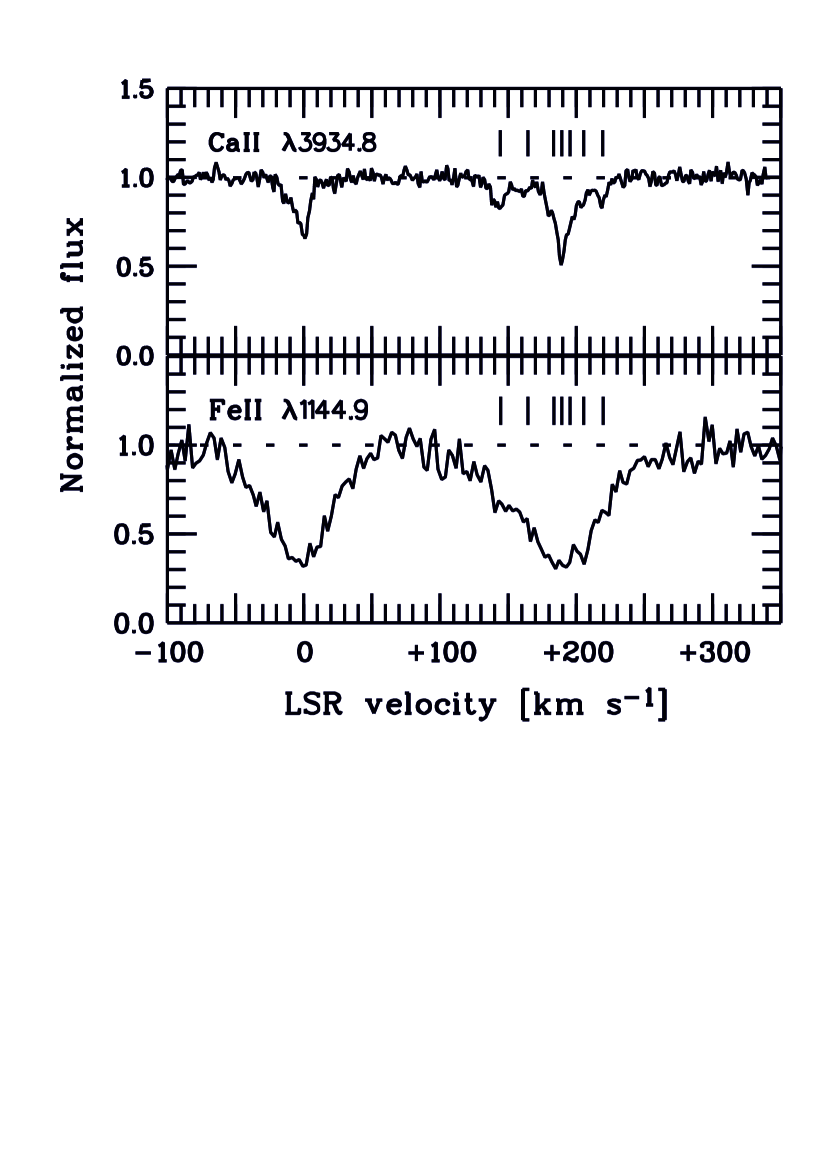
For the Fairall 9 sightline, the MS Ca ii absorption pattern seen in the optical UVES data indicates a complex internal velocity structure of the Stream in this direction with seven individual absorption components within a velocity range of km s-1 centered at km s-1 (Richter et al. 2013). In Fig. 3, upper panel, we show the velocity-component structure of the gas in the MS in the Ca ii line based on the high-resolution () UVES spectrum of Fairall 9. For comparison, Fe ii absorption in the lower-resolution COS spectrum () of Fairall 9 is shown in the lower panel of Fig. 3.
With this new spectral information at hand, we determine a surprisingly high metal abundance in the Stream along the Fairall 9 sightline. Using the unsaturated S ii absorption in the HST/COS data, in combination with H i 21cm data from the Galactic-All Sky Survey (GASS; McClure-Griffiths et al. 2009, Kalberla et al. 2010), the abundance in the MS turns out to be [S/H ( solar). This value is percent higher than the previous estimate for [S/H] in the MS towards Fairall 9 presented by Gibson et al. (2000; see Richter et al. 2013 for a discussion on the origin for this discrepancy). Most striking, this abundance is five-times higher than what is found along the other five MS sightlines presented in Fox et al. (2013) based on COS/UVES data sets with similar data quality. The substantial differences in the chemical composition of the MS towards Fairall 9 compared to the other sightlines suggest that the enrichment history of the Stream is far more complex than previously thought. Most likely, the main body of the MS, that has an abundance of solar (Fox et al. 2013), originates in the SMC, from which the bulk of the Stream’s material was separated Gyr ago. In contrast, the metal-rich gas towards Fairall 9 stems from the LMC, where the gas was locally enriched by a massive star burst, blown away from the galaxy, and then incorporated into the Stream.
The existence of a metal-enriched filament in the Stream towards Fairall 9 that originates in the LMC is supported by a kinematic study of the MS from Nidever et al. (2008), who performed a systematic Gaussian decomposition of the Stream’s H i velocity profiles using the LAB 21cm all-sky survey (Kalberla et al. 2005).
2.4 [FeX] absorption as possible tracer for a warm-hot CGM
The resonance lines of atomic and molecular species located in the UV serve as tracer of cold, warm, and hot gas in a temperature range of K. For collisionally ionized gas, O vi, with an ionization potential of creation of eV and its two strong transitions at and Å, is the best ion in the UV to study the warm-hot CGM around the Milky Way at K. UV observations carried out with FUSE have demonstrated that high-velocity O vi absorption is present in many directions of the sky with a large covering fractions of for column densities log (O vi (Sembach et al. 2003). The O vi absorption possibly indicates transition-temperature gas in the interfaces between cooler gas clouds and a surrounding hot coronal gas (see also Fox 2011).
Numerical simulations of large-scale structure formation predict that the dominant fraction of the baryonic matter in the IGM and CGM resides in a hot phase at million-degree temperatures (e.g., Cen & Ostriker 1999; Davé et al. 2001; Tepper-García et al. 2011). The high temperature of this gas phase (commonly referred to as warm-hot intergalactic medium, WHIM) arises from shock-heating of collapsing large-scale strucures. Because the cooling-time of the WHIM is on the order of the Hubble-time, simulations indicate that there exists a widespread, highly-ionized CGM gas phase around galaxies that cannot be readily observed in the UV due to the lack of appropriate transitions of high ions that have ionization potentials beyond that of O vi.
X-ray spectra of bright Blazars, obtained with Chandra and XMM-Newton, have been used to search for this high-temperature gas phase through line absorption in the higher ionization states of oxygen, O vii and O viii (e.g., Gupta et al. 2012). Following these authors, the total mass in the warm-hot CGM around the Milky Way may be as large as M (but see Bregman & Lloyd-Davies 2007). Due to the severe limitations in spectral resolution and S/N, however, the interpretation of the X-ray O vii/O viii absorption features with respect to origin, mass, and physical nature of the gas is afflicted with large systematic uncertainties (see Richter et al. 2008 for a more detailed discussion on this topic).
For a better understanding of the properties of warm-hot gas in the outer environment of galaxies it is of prime importance to search for alternative ways to trace hot gas in the Universe through absorption and to combine results from independent observational methods and from simulations. In search for strategies to detect million-degree gas throughout the Universe, York & Cowie (1983) discussed the possibility to use the optical intersystem lines of [Fe x] and [Fe xiv] as spectral tracers for million-degree gas. These lines have oscillator strengths as low as and and thus an extremely high S/N in optical spectra is required to detect these lines in the presence of hot, collisionally ionized gas. Note that it requires energies of eV to ionize Fe from Fe+8 to Fe+9 and eV from Fe+13 to Fe+14 (e.g., Sutherland & Dopita 1996 and references therein). Because the UV background at does not provide sufficient photons at such high energies, collisional ionization is the only mechanism that is expected contribute to a possible population of Fe+9 and Fe+13 ions in intergalactic and circumgalactic environments.
In a series of papers, Hobbs (1984a, 1984b, 1985), Hobbs & Albert (1985), and Pettini & D’Odorico (1986) searched for [Fe x] and [Fe xiv] absorption in the spectra of stars, but without success. Using the optical spectrum of the extremely bright supernova SN 1987A in the LMC, several groups (Wang et al. 1989; Pettini et al. 1989; Malaney & Clampin 1989) detected a weak absorption ( mÅ) feature near Å that they identified as Doppler-shifted [Fe x] absorption originating in hot gas in the direction of the LMC. This feature, if correctly identified, would imply a very large column of ionized gas in this direction of log (H ii) and would indicate the existence of a huge reservoir of baryonic matter hidden in hot gas. The interpretation of the observed absorption feature near Å in the spectrum of SN 1987A as [Fe x] absorption was disputed by Wampler et al. (1991), however, who attributed the observed feature to a Doppler-shifted diffuse interstellar band (DIB). Indeed, various DIBs and telluric lines strongly hamper a definite identification of [Fe x] absorption in this wavelength region (see, e.g., Jenniskens & Désert 1994). Since these studies of the optical spectrum of SN 1987A no further attempts (that we are aware of) have been made to search for hot gas in the CGM and IGM using the [Fe x] transition.
In an on-going long-term project that aims at studying optical absorption features in circumgalactic gas of the Milky Way and other galaxies using archival VLT/UVES data (Richter et al. 2005; Ben Bekhti et al. 2008,2011; Richter et al. 2011), we have revisited the issue of [Fe x] and [Fe xiv] absorption from a possibly existing hot gas component in the CGM. While this project is on-going, we here present some preliminary results and shortly outline our analysis strategy.
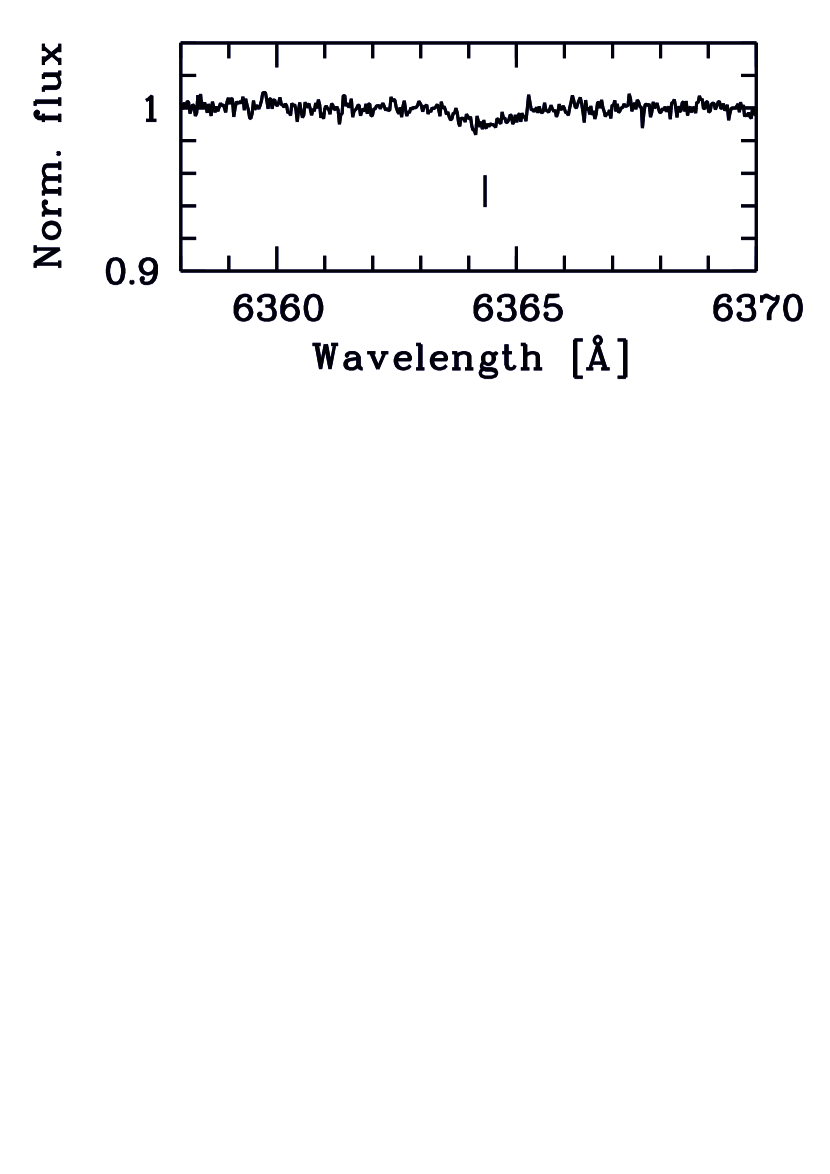
The majority of the more than 500 high-resolution () VLT/UVES QSO spectra that are available to us in the archive have a S/N of per resolution element. Only a few spectra in our VLT/UVES sample have a S/N near Å that is substantially higher than that, so that the direct search for [Fe x] and [Fe xiv] absorption along individual sightlines is limited to a few cases. To visualize the expected absorption characteristics of [Fe x] absorption we show in Fig. 4 the VLT/UVES spectrum of the bright quasar HE 05154414 in the wavelength range between and Å. In this spectrum, the S/N is as high as per resolution element at Å. A very weak, broad absorption feature is visible near Å, corresponding to a LSR velocity of km s-1 if the feature were Doppler-shifted [Fe x] absorption. On a first glance, this absorption feature appears to be a promising candidate for [Fe x] absorption from hot gas in the Local Group. With a FWHM of km s-1 it’s shape matches the expected large width of a Fe absorption line arising in million-degree circumgalactic gas, in which both thermal and non-thermal line broadening mechanisms are relevant. Moreover, the observed absorption feature is most likely not related to a DIB or a telluric line. However, with an equivalent width of almost mÅ the absorption is too strong to realistically represent [Fe x] absorption in local warm-hot circumgalactic gas, as it would trace an ionized gas column of log (H ii for collisionally ionized gas at a temperature of K. Numerical simulations of Milky Way-type galaxies and their gaseous environment (e.g., Nuza et al. 2013) suggest instead that the column densities of hot, ionized gas in the CGM are below log (H ii. [Fe x] absorption from warm-hot gas in the Milky Way environment thus is expected to be subtantially weaker than the feature observed towards HE 05154414.
In order to reach the very high S/N of that is necessary to detect such extremely weak [Fe x] lines the stacking of a large number of QSO spectra is required. We are currently working on such a stacking procedure using those VLT/UVES data sets that cover the [Fe x] wavelength range at a S/N ratio that allows us to safely remove DIBs, telluric lines, and other known blending features before the data is used in the stacking routine. In addition to the high-resolution UVES data, we are also planning to stack thousands of low-resolution spectra from the Sloan Digital Sky Survey (SDSS) to constrain the amount of hot gas in the Local Group using the [Fe x] transition. The first results from this project will be presented in a forthcoming paper (Richter et al. 2014).
3 Concluding remarks
High-resolution absorption spectroscopy is the most efficient method to explore the nature of diffuse intergalactic and circumgalactic gas in the local Universe. As we have adumbrated in this article, spectroscopic observations of the circumgalactic medium of the Milky Way indicate a high complexity of the gas kinematics and a large range in physical conditions in such gas. Future spectroscopic observations of the CGM at low that combine the strengths of optical and UV instruments and that also take into account the results from other wavelength regimes (e.g., infrared, radio, X-ray) will be of great importance to further constrain the role of the circumgalactic medium for the ongoing formation and evolution of galaxies and to characterize its connection to the cosmic web.
Acknowledgements.
Support for this research was provided by NASA through grant HST-GO-12604 from the Space Telescope Science Institute, which is operated by the Association of Universities for Research in Astronomy, Incorporated, under NASA contract NAS5-26555.References
- [] Ben Bekhti, N., Richter, P., Westmeier, T., & Murphy, M.T. 2008, A&A, 487, 583
- [] Ben Bekhti, N., Winkel, B., Richter, P., et al. 2011, A&A, 542, 110
- [] Besla, G., Kallivayalil, N., Hernquist, L., et al. 2010, ApJ, 721, L97
- [] Besla, G., Kallivayalil, N., Hernquist, L., et al. 2012, MNRAS, 421, 2109
- [] Bregman, J. N. & Lloyd-Davies, E. J. 2007, ApJ, 669, 990
- [] Brüns, C., Kerp, J., Stavely-Smith, L., et al. 2005, A&A, 432, 45
- [] Cen, R. & Ostriker, J. P. 1999, ApJ, 514, 1
- [] Collins, J. A., Shull, J. M., Giroux, M. L. 2009, ApJ, 705, 962
- [] Connors, T. W., Kawata, D., & Gibson, B. K. 2006, MNRAS, 371, 108
- [] Davé, R., Cen, R., Ostriker, J. P., et al. 2011, ApJ, 552, 473
- [] Fox, A. J., Richter, P., Wakker, B.P. et al. 2013, ApJ, 772, 110
- [] Fox. A. J. 2011, ApJ, 730, 58
- [] Fox, A.J., Wakker, B.P., Smoker, J.V., et al. 2010, ApJ, 718, 1046
- [] Fox, A. J., Wakker, B. P., Savage, B. D., et al. 2005, ApJ, 630, 332
- [Fox et al.(2010)] Fox, A. J., Wakker, B. P., Smoker, J. V., Savage, B. D., Richter, P., & Sembach, K. R. 2010, ApJ, 718, 1046
- [] Gardiner, L.T. & Noguchi, M. 1996, MNRAS, 278, 191
- [] Gibson, B. K., Giroux, M. L., Penton, S. V., et al. 2000, AJ, 120, 1830
- [] Gupta, A., Mathur, S., Krongold, Y., Nicastro, F., & Galeazzi, M. 2012, ApJ, 756, L8
- [] Herenz, P., Richter, P., Charlton, J.C., & Masiero, J.R. 2013, A&A, 550, A87
- [] Hobbs, L. M. 1984a, ApJ, 280, 132
- [] Hobbs, L. M. 1984b, ApJ, 284, L47
- [] Hobbs, L. M. & Albert, C. E. 1984, ApJ, 281, 639
- [] Hobbs, L. M. 1985, ApJ, 298, 357
- [] Jenniskens, P. & Désert, F.-X. 1994, A&AS, 106, 39
- [] Kalberla, P. M. W., Burton, W. B., Hartmann, D., et al. 2005, A&A, 440, 775
- [] Kalberla, P. M. W., McClure-Griffiths, N. M., Pisano, D. J., et al. 2010, A&A, 521, 17
- [] Keeney, B. A., Stocke, J. T., Rosenberg, J. L., et al. 2013, ApJ, 765, 27
- [] Lehner, N., Howk, J. C., Tripp, T. M., et al. 2013, ApJ, 770, 138
- [] Lehner, N., Howk, J. C., Thom, C., et al. 2012, MNRAS, 424, 2896
- [] Lehner, N. & Howk, J. C. 2011, Science, 334, 955
- [] Malaney, R. A. & Clampin, M. 1988, ApJ, 335, L57
- [] Marasco, A., Marinacci, F., & Fraternali, F. 2013, MNRAS, 433, 1634
- [] McClure-Griffiths, N. M., Pisano, D. J., Calabretta, M. R., et al. 2009, ApJS, 181, 398
- [] Nidever, D. L., Majewski, S. R., & Burton, W. B. 2008, ApJ, 679, 432
- [] Nuza, S., Parisi, F., Scannapieco, C., Richter, P. & Gottlöber, S. 2013, MNRAS, submitted
- [] Pettini, M. & D’Odorico, S. 1986, ApJ, 310, 700
- [] Pettini, M., Stathakis, R., D’Odorico, S., Molaro, P., & Vladilo, G. 1989, ApJ, 340, 256
- [] Prochaska, J. X., Weiner, B., Chen, H.-W., Mulchaey, J., & Cooksey, K. 2011, ApJ, 740, 91
- [] Putman, M. E., Staveley-Smith, L., Freeman, K. C., Gibson, B. K., & Barnes, D. G. 2003, ApJ, 586, 170
- [] Rao, S. M., Sardane, G., Turnshek, D. A., et al. 2013, MNRAS, 432, 866
- [] Ribaudo, J., Lehner, N., Howk, J. C., et al. 2011, ApJ, 743, 207
- [] Richter, P., Fox, A.J., Wakker, B.P. et al. 2013, ApJ, 772, 111
- [] Richter, P. 2012, ApJ, 750, 165
- [] Richter, P., Krause, F., Fechner, C., Charlton, J.C., & Murphy, M.T. 2011, A&A, 528, A12
- [] Richter, P., Charlton, J.C., Fangano, A.P.M., Ben Bekhti, N., & Masiero, J.R. 2009, ApJ, 695, 1631
- [] Richter, P., Paerels, F. B. S., & Kaastra, J. S. 2008, SSRv, 134, 25
- [] Richter, P. 2006, Reviews in Modern Astronomy, 19, 31
- [] Richter, P., Westmeier, T., & Brüns 2005, A&A, 442, L49
- [] Richter, P., Sembach, K. R., Wakker, B. P., & Savage, B. D., 2001a, ApJ, 562, L181
- [] Richter, P., Savage, B. D., Wakker, B. P., Sembach, K. R., & Kalberla, P. M. W. 2001b, ApJ, 549, 281
- [] Sembach, K. R., Wakker, B. P., Savage, B. D., et al. 2003, ApJS, 146, 165
- [] Sembach, K. R., Howk, J. C., Savage, B. D., & Shull, J. M. 2001, AJ, 121, 992
- [] Shull, J. M., Jones, J. R., Danforth, C. W., & Collins, J. A. 2009, ApJ, 699, 754
- [] Stocke, J. T., Keeney, B. A., Danforth, C. W., et al. 2013, ApJ, 763, 148
- [] Sutherland, R. S. & Dopita, M. A. 1993, ApJS, 88, 253
- [] Tepper-García, T., Richter, P., Schaye, J., et al. 2011, MNRAS, 413, 190
- [] Thom, C., Werk, J. K., Tumlinson, J., et al. 2011, ApJ, 736, 1
- [] Thom, C., Peek, J. E. G., Putman, M. E., et al. 2008, ApJ, 684, 364
- [] Thom, C., Putman, M.E., Gibson, B. K., et al. 2006, ApJ, 638, L97
- [] Tripp, T. M., Wakker, B. P., Jenkins, E. B., et al. 2003, AJ, 125, 3122
- [] Tumlinson, J., Thom, C., Werk, J. K., et al. 2011, Science, 334, 948
- [] Tumlinson, J., Werk, J. K., Thom, C., et al. 2011b, ApJ, 733, 111
- [] Wampler, E.J., Chen, J.-S., Setti, G. 1991, A&A, 248, 633
- [] Wang, Q., Hamilton, T., & Helfand, D.J. 1989, Nature, 341, 309
- [] Wannier, P., & Wrixon, G. T. 1972, ApJ, 173, L119
- [] Wakker, B. P., Howk, J. C., Savage, B. D., et al. 1999, Nature, 402, 388
- [] Wakker, B. P., York, D. G., Wilhelm, R., et al. 2008, ApJ, 672, 298
- [] Wakker, B. P., York, D. G., Howk, J. C., et al. 2007, ApJ, 670, L113
- [] Wakker, B. P. 2004, in ASSL, Vol. 312, High-Velocity Clouds, ed. van Woerden et al. (Kluwer Academic Publishers), 251
- [] Wakker, B. P. & van Woerden, H. 1997, ARA&A, 35, 217
- [] Weiner, B. J., & Williams, T. B. 1996, AJ, 111, 1156
- [] Welty, D. E., Frisch, P. C., Sonneborn, G., & York, D. G. 1999, ApJ, 512, 636
- [] York, D. C. & Cowie, L. L. 1983, ApJ, 264, 49