Characterizing a Dramatic Flare on an Ultracool Dwarf Found by the ASAS-SN Survey†
Abstract
We analyze a magnitude flare on the newly identified M8 dwarf SDSS J022116.84+194020.4 (hereafter SDSSJ0221) detected as part of the All-Sky Automated Survey for Supernovae (ASAS-SN). Using infrared and optical spectra, we confirm that SDSSJ0221 is a relatively nearby (d76 pc) M8 dwarf with strong quiescent H emission. Based on kinematics and the absence of features consistent with low-gravity (young) ultracool dwarfs, we place a lower limit of 200 Myr on the age of SDSSJ0221. When modeled with a simple, classical flare light-curve, this flare is consistent with a total -band flare energy 1034 erg, confirming that the most dramatic flares are not limited to warmer, more massive stars. Scaled to include a rough estimate of the emission line contribution to the band, we estimate a blackbody filling factor of 10–30% during the flare peak and 0.5–1.6% during the flare decay phase. These filling factors correspond to flare areas that are an order of magnitude larger than those measured for most mid-M dwarf flares.
Subject headings:
brown dwarfs — stars: chromospheres — stars: flare — stars: individual(SDSS J022116.84+194020.4) — stars: low-mass1. Introduction
M dwarfs are well known for their magnetic activity, both from quiescent H emission (e.g., Hawley et al., 1996) and dramatic flare events with emission spanning the entire electromagnetic spectrum (e.g., Osten et al., 2005). Though flares can be found across the entire M spectral class, flares are most often observed on mid-M dwarfs. Early-M dwarfs are on average less active than mid-M dwarfs, while late-M dwarfs are too faint for most flare-monitoring campaigns. Despite a low number of detected flares, quiescent activity is observed in a larger fraction of late-M dwarfs than mid-M dwarfs. In the Solar neighborhood, 80% of M8 dwarfs show H emission compared to 20% of M3 dwarfs (West et al., 2011).
The increase in the active fraction with spectral type is consistent with a changing relationship between activity, age, and rotation (Reiners & Basri, 2010). Active early-M dwarfs are found, on average, closer to the Galactic plane than active late-M dwarfs, indicating that late-M dwarfs are active for a longer portion of their lifetimes (West et al., 2008). Mid-M dwarfs that flare are found, on average, at lower Galactic heights than those with only H emission (Kowalski et al., 2009), implying that the average flare lifetime is shorter than the quiescent activity lifetime. The age of flaring late-M dwarfs is particularly interesting because the M7-M9 spectral types include the most massive brown dwarfs at ages 1 Gyr (Burrows et al., 1997).
Flares on early- and mid-M dwarfs follow well characterized patterns; small flares (– ergs) typically occur hourly or daily, while larger flares (– ergs) typically occur no more often than weekly (Lacy et al., 1976). These patterns vary with both spectral type and base activity level (Hilton, 2011; Davenport et al., 2012), but it is unclear whether late-M dwarfs flare more or less frequently than mid-M dwarfs. With 20 total detected late-M dwarf flares events (e.g., Rockenfeller et al., 2006; Hilton, 2011; Berger et al., 2013), the patterns followed by late-M dwarfs are unclear.
On UT 2013 August 14, SDSS J022116.84+194020.4 (hereafter SDSSJ0221) was flagged as transient ASASSN-13cb in the All-Sky Automated Survey for Supernovae (ASAS-SN; Shappee et al., 2013) with a flare peak emission of . We present follow-up observations and use models based on mid-M dwarf flares to estimate the properties of the flare. In Section 2, we present our observations and characterize SDSSJ0221, in Section 3 we examine the flare, and in Section 4 we place SDSSJ0221 in the context of late-M dwarf magnetic activity.
2. Observations and Survey Data
In addition to the detection of the flare, we examined the photometry available from sky surveys and obtained follow-up spectroscopy to investigate the properties of SDSSJ0221. Those data are described below.
2.1. Photometric Data
ASAS-SN111http://www.astronomy.ohio-state.edu/${∼}$assassin/index.shtml is an optical transient survey that images the sky visible from Haleakala, Hawaii every days down to , using two 14-cm telescopes in a common mount (Shappee et al., 2013, see). The -band images ( sec exposures per field) are automatically processed through a difference imaging pipeline that produces transient candidates within hr of the initial observation. We discovered the bright transient ASASSN-13cb (R. A. = 02 21 16.92, Decl. = 19 40 19.9) on UT 2013 Aug 14.52 (Stanek et al., 2013). The transient faded by between the two discovery images and by in confirmation images obtained 2.3 hr later. The photometry of ASASSN-13cb, presented in Table 1, was obtained from ASAS-SN images with aperture and PSF fitting photometry using IRAF and Daophot II (Stetson, 1992) and calibrated using magnitudes of several stars from the AAVSO Photometric All-Sky Survey222http://www.aavso.org/apass.
| TimeaaSince first flare detection (2013.621). | ||
|---|---|---|
| (h:m:s) | magnitude | (erg cm-2 s-1 Å-1 ) |
| 0:00:00 | 12.84 0.03 | |
| 0:01:57 | 13.33 0.04 | |
| 2:20:19 | 16.70 0.14 | |
| quiescent | 22.09 0.26 | (5.45 1.52) |
We retrieved photometry from the Sloan Digital Sky Survey (SDSS; York et al., 2000), the Two-Micron All Sky Survey (2MASS; Skrutskie et al., 2006), and the Wilkinson Infrared Sky Explorer mission (WISE; Wright et al., 2010) based on a coordinate cross-match to the ASAS-SN position. Each survey returned only one source within our 5″ search radius. Poor quality flags were not set in any bands, but the uncertainties on the , , and measurements were sufficiently high to indicate unreliable magnitudes. The magnitudes are listed in Table 2.
| Parameter | Value |
|---|---|
| SDSS (2005.933) | |
| R.A. | 02 21 16.84 |
| decl. | +19 40 20.4 |
| 22.80 0.13 | |
| 21.24 0.05 | |
| 18.65 0.02 | |
| 17.08 0.02 | |
| 2MASS (1997.805) | |
| R.A. | 02 21 16.77 |
| decl. | +19 40 20.1 |
| 15.00 0.04 | |
| 14.44 0.04 | |
| 13.91 0.05 | |
| WISE | |
| 13.69 0.03 | |
| 13.45 0.04 | |
| Spectroscopic | |
| Spectral type | M8 |
| H EW | 36 11Å |
| 1.5 | |
| Derived | |
| d ( vs. ) | 78.36 1.85 pc |
| d ( vs. ) | 91.81 2.27 pc |
| d ( vs. ) | 58.56 1.63 pc |
| d (mean) | 76 6 pc |
| 96.0 6.7 mas yr-1 | |
| 36.3 7.9 mas yr-1 | |
| 37 8 km s-1 | |
The colors of SDSSJ0221 are consistent with the median color of M8 dwarfs in the through bands. It is not peculiar in its color (used to select metal-poor M dwarfs; Lépine & Scholz, 2008) or its color (consistent with young ultracool dwarfs; Cruz et al., 2009). Distances calculated using the Bochanski et al. (2010) color-magnitude relations are given in Table 2, with uncertainties including both magnitude uncertainties and the scatter in the relations. We adopt a mean distance of pc; the uncertainty is dominated by the dispersion of the three distance estimates.
We measured a proper motions of mas yr-1 and mas yr-1 based on the difference between SDSS and 2MASS coordinates333The astrometric calibration of SDSS and 2MASS shows very good agreement (006) within typical coordinate uncertainties (; Pier et al., 2003).. The combination of the distance and proper motion results in a tangential velocity of 37 8 km s-1, placing it slightly faster than the median Vtan for ultracool dwarfs near the Sun (e.g., Faherty et al., 2009). Based on the Bayesian statistical proper motion models of Malo et al. (2013)444Using the web-based tool at http://www.astro.umontreal.ca/${∼}$malo/banyan.php, the kinematics of SDSSJ0221 are not consistent with any of the seven closest and youngest moving groups, implying an age 100 Myr.
2.2. Spectroscopic Data
We obtained low-resolution () optical spectra of SDSSJ0221 on three different nights (UT 2013 Aug 30 and Sep 1–2) using the Dual Imaging Spectrograph (DIS) on the ARC 3.5m telescope at APO and the Wide Field CCD Camera and Spectrograph (WFCCD) on the du Pont 2.5m telescope at LCO. We used the B400/R300 gratings and a 15 slit (3500-10000Å) with DIS and the 400 l/mm grism and a 17 slit with WFCCD (3700-9500Å). The spectra were reduced using LAcosmic (van Dokkum, 2001) for cosmic ray rejection and standard techniques in the IRAF twodspec and onedspec packages for spectral extraction and wavelength+flux calibration. The median combined spectrum is shown in Figure 1.
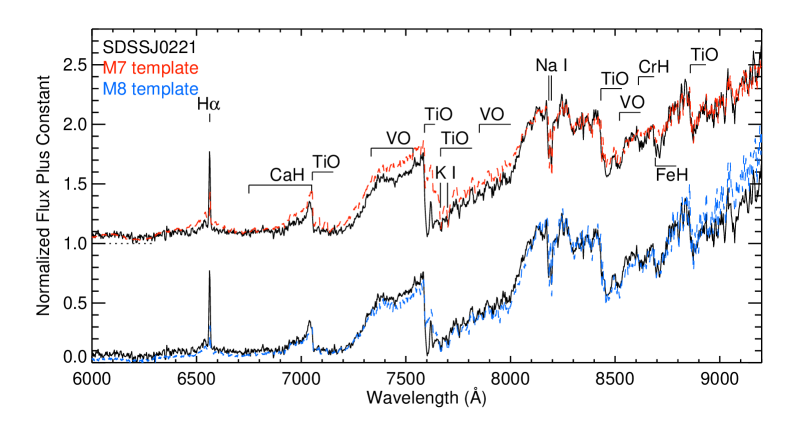
From these spectra, we obtain a spectral type of M8 for SDSSJ0221 using the automatic Hammer routines (based on spectral indices; West et al., 2004; Covey et al., 2007). The optical spectrum is shown compared to the M7 and M8 templates from Bochanski et al. (2007) in Figure 1. Visual comparison shows that the spectral features of SDSSJ0221 place it between the two types, but the spectrum is a better match to the M8 template, indicating an M8 type. We were unable to measure radial velocities from the individual spectra due to their low resolution.
We measure the H equivalent width (EW) of the individual spectra using the Hammer (West et al., 2004; Covey et al., 2007), obtaining a mean and standard deviation of Å (listed in Table 2) for seven total spectra. Using a value from Schmidt et al. (2013, in prep.), we calculate an activity strength of . This is well above the median and dispersion for H emission from M8 dwarfs (West et al., 2011). The full range of the measured H EWs (22–54 Å; –) is larger compared to its mean H EW than the range seen for an average late-M dwarf (Bell et al., 2012), but not remarkable given the strong emission and observed flare.
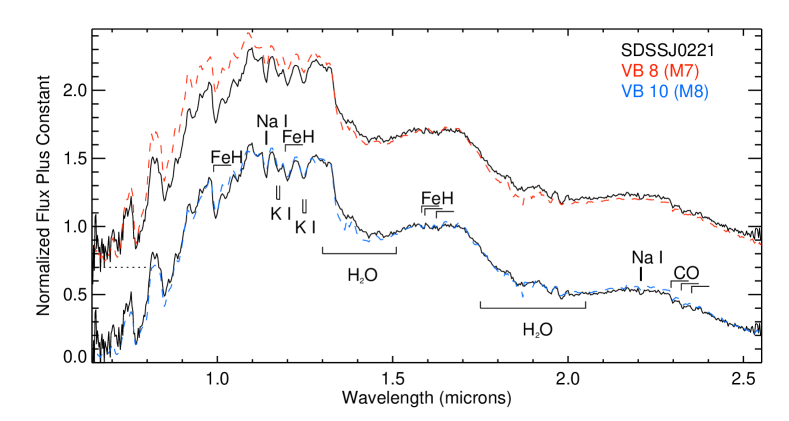
We obtained a low-resolution (R150) infrared spectrum on 2013 Sept 3 using SpeX (Rayner et al., 2003) on the Infrared Telescope Facility (IRTF), as well as standard calibration frames and a spectrum of the A0 star HD 16811. The data were reduced and telluric-corrected using SpexTool (Vacca et al., 2003; Cushing et al., 2004). The H2O indices compiled by Allers & Liu (2013) indicate an infrared spectral type of M7, but direct comparison to spectral standards (shown in Figure 1) results in a final infrared spectral type of M8.
The infrared spectrum also includes features that are sensitive to the surface gravity (age) of ultracool dwarfs. We calculated the the FeH, VO, K I, and H-cont indices from Allers & Liu (2013); the combined score from all four indices indicates features consistent with a typical field dwarf, placing a rough lower limit of 200 Myr on the age of SDSSJ0221. While the Li I absorption line could provide an additional limit on the age of SDSSJ0221, the optical spectrum does not have sufficient S/N and resolution to place limits on Li I.
3. Properties of the Flare
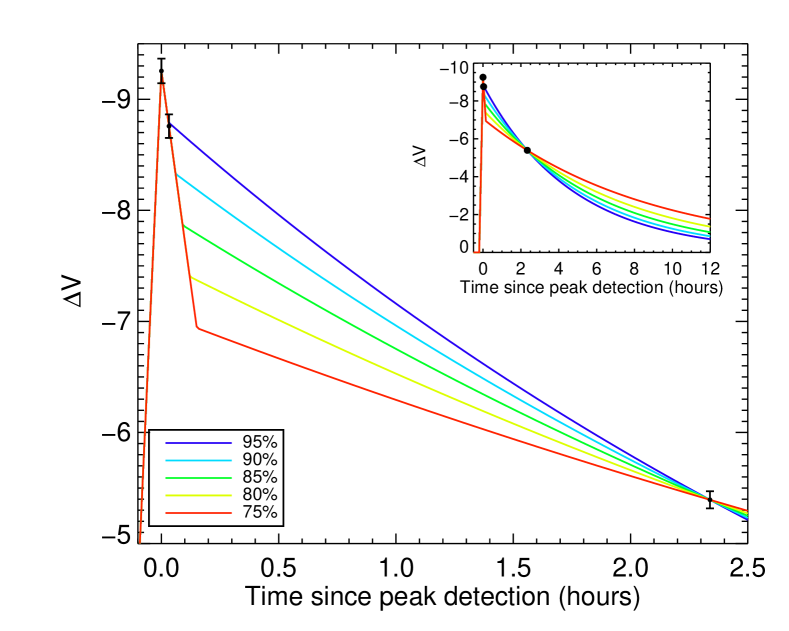
We calculated a quiescent -band magnitude of = 22.09 0.26 for SDSSJ0221 by calibrating the M8 template spectrum to the SDSS -band magnitude and then integrating the spectrum over a -band filter curve. This quiescent magnitude results in for the observed peak magnitude (shown in Figure 2). It is unlikely that we observed the flare at its true peak. However, more energetic flares occur are increasinly infrequent (Lacy et al., 1976), so it is also unlikely that the flare was much larger than observed. Kowalski et al. (2013) includes flares with impulsive decays lasting from 0.02 to 0.2 hours. If we assume a linear impulsive decay, this range of decay times is consistent with a range of peak magnitudes from the observed (at hr) to a (at hr) peak. For simplicity, we assume that the observed peak is also the total flare peak.
3.1. The Flare Lightcurve
Classical flares have a characteristic shape: an “impulsive” phase that includes a fast rise and decline (well approximated as linear changes in magnitude with time) and a “gradual” phase typically modeled by an exponential decay. Flare lightcurves have a wide variety of morphologies beyond simple, classical flares; some show multiple peaks (e.g., Hawley & Pettersen, 1991) or complex structures in their decay phase (e.g. Kowalski et al., 2010). With only three detections of SDSSJ0221 during the flare, we cannot place constraints on the flare morphology, but we can use a classical flare model to estimate the total energy of the flare.
We model the rise phase as a linear rise in with time, estimating a rise time of 0.2 hours (reasonable for a large flare; e.g., Hawley & Pettersen, 1991; Kowalski et al., 2010). The first two detections indicate a strong impulsive decay, lasting at minimum the two minutes between the first two observations. The third detection is consistent with a long gradual decay after a short impulsive phase. We model the impulsive decay as a linear fit to the first two points with a minimum length set to a 95% decay from the peak and a maximum length of a 75% decay from the peak. The maximum length is limited by the need to end at a magnitude bright enough so that the exponential decay does not fall below at hr. The gradual phase is modeled by an exponential decay beginning after the impulsive phase with a timescale consistent with the gradual phase detection.
We can estimate the equivalent duration (ED; the time required to emit the flare flux during quiescence) and total energy of the flare by integrating over the range of model lightcurves. Adopting a quiescent flux of ergs cm-2 s-1 Å-1, we measure EDs of – s for the five models. These are much larger than the -band EDs for typical flares (Kowalski et al., 2013; Walkowicz et al., 2011, 1000 s) and one order of magnitude larger than the -band ED for the largest flares detected (Kowalski et al., 2010)
Using a quiescent luminosity of ergs s-1, we calculate a total -band flare energy of – ergs. The conversion from to from Lacy et al. (1976) indicates that the -band energy of this flare is – ergs. The only flares with comparable published -band energies are the giant flares on AD Leo (Hawley & Pettersen, 1991) and YZ CMi (Kowalski et al., 2010), both at just over ergs. While the calculated for the flare on SDSSJ0221 is slightly larger, its uncertainties due to the estimation of the flare shape and the use of scaling relations are likely to be an order of magnitude. Extrapolating the flare frequency distributions of Hilton (2011) to ergs, flares this large should occur on active mid-M dwarfs monthly, and active late-M dwarfs once per year.
3.2. Emission in the -band
At optical and UV wavelengths, flare emission originates from two components. The major contributor is a K blackbody (e.g., Hawley & Fisher, 1992) thought to originate deep in the stellar atmosphere near the foot points of the magnetic field loops. Atomic emission lines (e.g., Fuhrmeister et al., 2010) and hydrogen Balmer continuum (Kunkel, 1970) are emitted as part of a second, lower density component. The continuum emission dominates the overall optical/UV energy budget of the flare, contributing 91–95% of the total during the impulsive phase and 69–95% during the gradual phase (Hawley & Pettersen, 1991).
Spectroscopic observations of the band during flares are rare, in part because there are only two strong emission lines, H and He I 5876. Hawley et al. (2003) calculated an energy budget for four flares on AD Leo with spectra overlapping the -band filter. They found that the continuum contributes 89–96% of the -band energy budget during the impulsive phase and 0–95% of the -band energy budget during the gradual phase. The large range of continuum emission in the band during the quiescent phase is due to the faintness of the blackbody compared to the line emission and stellar flux; in a large flare, the blackbody is likely to remain strong even during the decay phase.
We can examine the range of filling factors and blackbody emission temperatures consistent with the impulsive and gradual phase observations by calculating the blackbody contribution to the flux, , as
| (1) |
where is the filling factor of the blackbody spectrum, is the stellar radius, is the distance, and is the characteristic temperature of the blackbody distribution. We adopt R⊙ (the radius derived for M8 LP 349-25B; Dupuy et al., 2010) and pc (Section 2.1) for the radius and distance.
Kowalski et al. (2013) directly fit blackbody functions to blue optical spectra of flaring mid-M dwarfs, obtaining temperatures from to K for the peak and to K during the decay phase of impulsive flares. As the flare on SDSSJ0221 was larger than most of the flares examined, we adopt the slightly higher values to examine the area coverage of continuum emission; , , and K for the impulsive phase and and K for the gradual phase. The resulting model spectra are shown in Figure 3, both with the blackbody modeled as the only contribution to the flare -band flux and scaled so that the blackbody contributes 95% during the impulsive phase and 50% during the gradual phase.
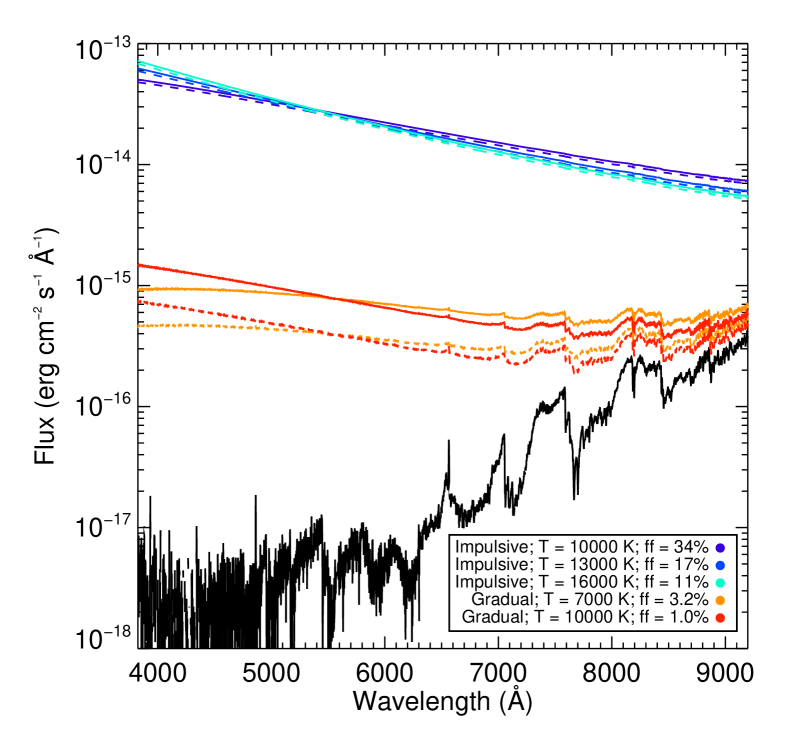
During the impulsive phase, blackbody emission with a characteristic temperature of , , and K would need to have filling factors of 32%, 16%, and 11% respectively to produce 95% of the observed flare emission. Those filling factors correspond to a physical area of (2–8) cm2 on an object this size, while the largest of the mid-M dwarf flares with detected peaks (Hawley et al., 2003; Fuhrmeister et al., 2008; Kowalski et al., 2013) have flare surface areas of – cm2 (0.05–0.2% of a R = 0.35R⊙ star). During the gradual phase, a or K blackbody spectrum would need filling factors of 0.5% or 1.6% respectively to produce 50% of the decay phase emission. These filling factors are similar to the physical area covered by the giant flare from Kowalski et al. (2010) during its decay phase.
4. Discussion
The low-gravity and kinematic indicators often used to select young brown dwarfs among ultracool dwarf populations indicate that SDSSJ0221 is older than 200 Myr. According to ultracool dwarf evolutionary models (Burrows et al., 1997) an M8 dwarf (corresponding to a K surface temperature) of 1 Gyr could be a massive brown dwarf, but with thin disk kinematics, SDSSJ0221 is more likely a few Gyr old and so is probably a star rather than a brown dwarf. Stars with dramatic flares are typically assumed to be young, but with the break down of the age-activity relation (Reiners & Basri, 2010) and the persistence of quiescent activity in late-M dwarfs for 8 Gyr (West et al., 2008), it is possible that ultracool dwarfs can have large flares even at typical thin disk ages.
The erg estimate of the energy released is comparable to the highest energies calculated for mid-M dwarf flares (Hawley & Pettersen, 1991; Kowalski et al., 2010). The flare is likely to have covered 10% of the stellar (or possibly brown dwarf) surface at its peak magnitude, significantly larger than the area coverage at the peaks of most flares (Hawley et al., 2003; Fuhrmeister et al., 2008; Kowalski et al., 2013), but comparable to that of the largest flares (Hawley & Pettersen, 1991; Kowalski et al., 2010).
The flare on SDSSJ0221 is not the only very large amplitude flare detected on a late-M dwarf; Schaefer (1990) report a very similar flare on CZ Cnc, and strong flares have been observed at other wavelengths (e.g., Tagliaferri et al., 1990; Fleming et al., 2000) and through optical spectroscopy (e.g., Liebert et al., 1999; Schmidt et al., 2007). Overall, however, there are not yet sufficient observations to characterize the flare frequency distribution of M7-M9 dwarfs and investigate the similarity of their emission mechanisms to those on more massive M dwarfs.
References
- Allers & Liu (2013) Allers, K. N., & Liu, M. C. 2013, ApJ, 772, 79
- Bell et al. (2012) Bell, K. J., Hilton, E. J., Davenport, J. R. A., Hawley, S. L., West, A. A., & Rogel, A. B. 2012, PASP, 124, 14
- Berger et al. (2013) Berger, E., et al. 2013, ArXiv e-prints, 1307.5324
- Bochanski et al. (2010) Bochanski, J. J., Hawley, S. L., Covey, K. R., West, A. A., Reid, I. N., Golimowski, D. A., & Ivezić, Ž. 2010, AJ, 139, 2679
- Bochanski et al. (2007) Bochanski, J. J., West, A. A., Hawley, S. L., & Covey, K. R. 2007, AJ, 133, 531
- Burgasser et al. (2004) Burgasser, A. J., McElwain, M. W., Kirkpatrick, J. D., Cruz, K. L., Tinney, C. G., & Reid, I. N. 2004, AJ, 127, 2856
- Burrows et al. (1997) Burrows, A., et al. 1997, ApJ, 491, 856
- Covey et al. (2007) Covey, K. R., et al. 2007, AJ, 134, 2398
- Cruz et al. (2009) Cruz, K. L., Kirkpatrick, J. D., & Burgasser, A. J. 2009, AJ, 137, 3345
- Cushing et al. (2004) Cushing, M. C., Vacca, W. D., & Rayner, J. T. 2004, PASP, 116, 362
- Davenport et al. (2012) Davenport, J. R. A., Becker, A. C., Kowalski, A. F., Hawley, S. L., Schmidt, S. J., Hilton, E. J., Sesar, B., & Cutri, R. 2012, ApJ, 748, 58
- Dupuy et al. (2010) Dupuy, T. J., Liu, M. C., Bowler, B. P., Cushing, M. C., Helling, C., Witte, S., & Hauschildt, P. 2010, ApJ, 721, 1725
- Faherty et al. (2009) Faherty, J. K., Burgasser, A. J., Cruz, K. L., Shara, M. M., Walter, F. M., & Gelino, C. R. 2009, AJ, 137, 1
- Fleming et al. (2000) Fleming, T. A., Giampapa, M. S., & Schmitt, J. H. M. M. 2000, ApJ, 533, 372
- Fuhrmeister et al. (2008) Fuhrmeister, B., Liefke, C., Schmitt, J. H. M. M., & Reiners, A. 2008, A&A, 487, 293
- Fuhrmeister et al. (2010) Fuhrmeister, B., Schmitt, J. H. M. M., & Hauschildt, P. H. 2010, A&A, 511, A83+
- Hawley & Fisher (1992) Hawley, S. L., & Fisher, G. H. 1992, ApJS, 78, 565
- Hawley et al. (1996) Hawley, S. L., Gizis, J. E., & Reid, I. N. 1996, AJ, 112, 2799
- Hawley & Pettersen (1991) Hawley, S. L., & Pettersen, B. R. 1991, ApJ, 378, 725
- Hawley et al. (2003) Hawley, S. L., et al. 2003, ApJ, 597, 535
- Hilton (2011) Hilton, E. J. 2011, PhD thesis, University of Washington
- Kowalski et al. (2009) Kowalski, A. F., Hawley, S. L., Hilton, E. J., Becker, A. C., West, A. A., Bochanski, J. J., & Sesar, B. 2009, AJ, 138, 633
- Kowalski et al. (2010) Kowalski, A. F., Hawley, S. L., Holtzman, J. A., Wisniewski, J. P., & Hilton, E. J. 2010, ApJ, 714, L98
- Kowalski et al. (2013) Kowalski, A. F., Hawley, S. L., Wisniewski, J. P., Osten, R. A., Hilton, E. J., Holtzman, J. A., Schmidt, S. J., & Davenport, J. R. A. 2013, ApJS, 207, 15
- Kunkel (1970) Kunkel, W. E. 1970, ApJ, 161, 503
- Lacy et al. (1976) Lacy, C. H., Moffett, T. J., & Evans, D. S. 1976, ApJS, 30, 85
- Lépine & Scholz (2008) Lépine, S., & Scholz, R.-D. 2008, ApJ, 681, L33
- Liebert et al. (1999) Liebert, J., Kirkpatrick, J. D., Reid, I. N., & Fisher, M. D. 1999, ApJ, 519, 345
- Malo et al. (2013) Malo, L., Doyon, R., Lafrenière, D., Artigau, É., Gagné, J., Baron, F., & Riedel, A. 2013, ApJ, 762, 88
- Osten et al. (2005) Osten, R. A., Hawley, S. L., Allred, J. C., Johns-Krull, C. M., & Roark, C. 2005, ApJ, 621, 398
- Pier et al. (2003) Pier, J. R., Munn, J. A., Hindsley, R. B., Hennessy, G. S., Kent, S. M., Lupton, R. H., & Ivezić, Ž. 2003, AJ, 125, 1559
- Rayner et al. (2003) Rayner, J. T., Toomey, D. W., Onaka, P. M., Denault, A. J., Stahlberger, W. E., Vacca, W. D., Cushing, M. C., & Wang, S. 2003, PASP, 115, 362
- Reiners & Basri (2010) Reiners, A., & Basri, G. 2010, ApJ, 710, 924
- Rockenfeller et al. (2006) Rockenfeller, B., Bailer-Jones, C. A. L., Mundt, R., & Ibrahimov, M. A. 2006, MNRAS, 367, 407
- Schaefer (1990) Schaefer, B. E. 1990, ApJ, 353, L25
- Schmidt et al. (2013) Schmidt, S. J., Bochanski, J. J., West, A. A., Hawley, S. L., & Kielty, C. 2013, in prep.
- Schmidt et al. (2007) Schmidt, S. J., Cruz, K. L., Bongiorno, B. J., Liebert, J., & Reid, I. N. 2007, AJ, 133, 2258
- Shappee et al. (2013) Shappee, B. J., et al. 2013, ArXiv e-prints, 1310.2241
- Skrutskie et al. (2006) Skrutskie, M. F., et al. 2006, AJ, 131, 1163
- Stanek et al. (2013) Stanek, K. Z., et al. 2013, The Astronomer’s Telegram, 5276, 1
- Stetson (1992) Stetson, P. B. 1992, in Astronomical Society of the Pacific Conference Series, Vol. 25, Astronomical Data Analysis Software and Systems I, ed. D. M. Worrall, C. Biemesderfer, & J. Barnes, 297
- Tagliaferri et al. (1990) Tagliaferri, G., Giommi, P., & Doyle, J. G. 1990, A&A, 231, 131
- Vacca et al. (2003) Vacca, W. D., Cushing, M. C., & Rayner, J. T. 2003, PASP, 115, 389
- van Dokkum (2001) van Dokkum, P. G. 2001, PASP, 113, 1420
- Walkowicz et al. (2011) Walkowicz, L. M., et al. 2011, AJ, 141, 50
- West et al. (2008) West, A. A., Hawley, S. L., Bochanski, J. J., Covey, K. R., Reid, I. N., Dhital, S., Hilton, E. J., & Masuda, M. 2008, AJ, 135, 785
- West et al. (2004) West, A. A., et al. 2004, AJ, 128, 426
- West et al. (2011) —. 2011, AJ, 141, 97
- Wright et al. (2010) Wright, E. L., et al. 2010, AJ, 140, 1868
- York et al. (2000) York, D. G., et al. 2000, AJ, 120, 1579