A New Approach to Detailed Structural Decomposition:
Kicked-up
Disk Stars in Andromeda’s Halo?
Abstract
We characterize the bulge, disk, and halo subcomponents in the Andromeda galaxy (M31) over the radial range kpc. The cospatial nature of these subcomponents renders them difficult to disentangle using surface brightness (SB) information alone, especially interior to kpc. Our new decomposition technique combines information from the luminosity function (LF) of over million bright stars from the Panchromatic Hubble Andromeda Treasury (PHAT) survey, radial velocities of over red giant branch stars in the same magnitude range from the Spectroscopic and Photometric Landscape of Andromeda’s Stellar Halo (SPLASH) survey, and integrated -band SB profiles from various sources. We use an affine-invariant Markov chain Monte Carlo algorithm to fit an appropriate toy model to these three data sets. The bulge, disk, and halo SB profiles are modeled as a Sérsic, exponential, and cored power-law, respectively, and the LFs are modeled as broken power-laws. We find that the number of stars with a disk-like LF is larger than the number in the dynamically cold component, suggesting that some stars born in the disk have been dynamically heated to the point that they are kinematically indistinguishable from halo members. This is the first kinematical evidence for a “kicked-up disk” population in the stellar halo of M31. The fraction of kicked-up disk stars is consistent with that found in simulations. See Dorman et al. (2013) for more information.
1 Introduction
Structural decomposition of a spiral galaxy is typically done by fitting a sum of a model bulge, disk, and halo to the galaxy’s surface brightness (SB) profile. However, this method suffers from degeneracies in the best-fit profiles, particularly in the inner ( kpc) regions where the three components are cospatial. In this work, we introduce a new decomposition technique that uses resolved stellar population data as additional constraints in a SB decomposition of Andromeda, the nearest large spiral galaxy.
2 Simultaneous fit to three data sets
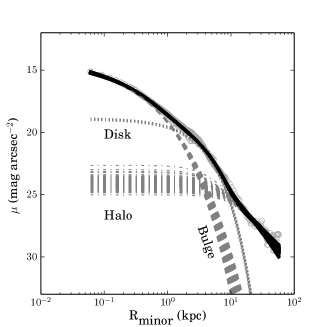
We fit a simple toy model simultaneously to three data sets. First, we use I-band surface brightness measurements in 637 fields between 0.4 and 225 kpc in projected galactocentric radius from Courteau et al. (2011); Gilbert et al. (2012). We model the SB map as the sum of a Sérsic bulge, exponential disk, and power-law halo, each with their own ellipticity parameters but the same major axis position angle.
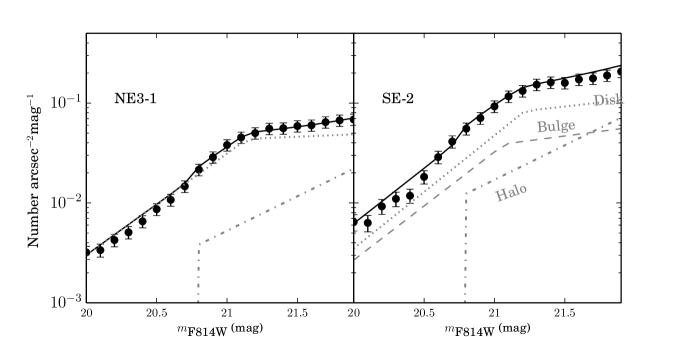
Second, we use the luminosity function (LF) from the Panchromatic Hubble Andromeda Treasury (PHAT; Dalcanton et al. (2012)) survey in each of 14 small spatial subregions in the inner 20 kpc of the galaxy. We only use the magnitude range surrounding the tip of the red giant branch (TRGB): , which is bright enough that it is essentially 100% complete throughout the survey area. We exclude from the LF stars in regions with . We model the LF as the sum of three individual LFs, one each for the bulge, disk, and halo. Each individual LF is parameterized as a broken power-law, so that the slope has the freedom to change at the TRGB associated with the population in a given component. The shapes of the model bulge and halo LFs are required to be constant (though their normalizations can change with position), but the shape parameters of the model disk LF are allowed to change with radius in the plane of the disk.
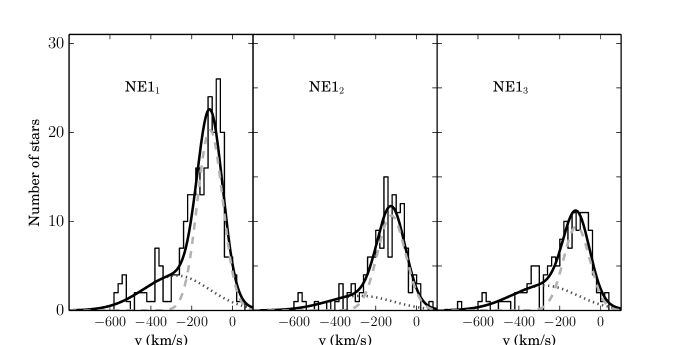
Finally, we fit our model to the fraction of stars kinematically associated with the disk (the “disk fraction”) in each subregion. Figure 1 illustrates the measurement of the disk fraction in 4 representative subregions. In each subregion, we use a Markov chain Monte Carlo (MCMC) algorithm to fit a sum of two Gaussian distributions, representing the dynamically cold disk (gray dashed curve) and warmer spheroid (dotted curve) to the line-of-sight velocity distribution of red giant branch stars from the Keck/DEIMOS SPLASH survey. The measured disk fraction in a subregion is given by the ratio of the area under the disk Gaussian to the area under the sum of the disk and spheroid Gaussians. See Dorman et al. (2012) for a more detailed description.
The model disk fraction in a given subregion is determined by the model SB decomposition in that subregion. However, while the disk fraction measurements constrain the fraction of stars sampled by the SPLASH survey that belong to the disk, the SB model predicts the fraction of integrated light contributed by the disk. To compare the two, we convert the SB model prediction to a disk fraction in units of SPLASH-sampled star counts using the empirical SPLASH selection function in each subregion and the model disk luminosity function.
We define a likelihood function — approximately the sum of the goodness-of-fit parameters between the model and data for the SB, LF, and disk fractions — and sample it using the MCMC sampler emcee (Foreman-Mackey et al. 2012) to measure the probability distributions of each of the 32 parameters in the toy model. We can extract the median value and uncertainty on each parameter as well as measure covariances between model parameters.
3 Kicked-up disk stars in the halo?
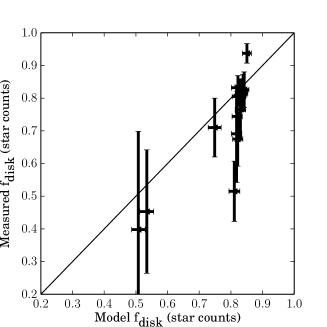
The fits to the SB, kinematics and luminosity functions in representative subregions are shown in Figures 2 and 3. The LF and SB are well fit, but the right-hand panel of Figure 2 shows that the kinematics are not. Here, the kinematically-derived cold fraction is plotted against the best-fit model disk fraction. The model systematically overpredicts the cold contribution by on average. The inability to simultaneously fit the three data sets is a sign of tension between the simple model and the data. The tension would be reduced if some fraction of the population with a disk-like LF (that is, stars that originated in the disk) had been dynamically heated (that is, had halo-like kinematics). In this scenario, the fraction of dynamically hot disk stars (the “kicked-up disk”) is consistent with that predicted by cosmological simulations (Purcell et al. 2010; Tissera et al. 2013).
Of course, our decomposition depends on our choice of model. For the sake of completeness we perform decompositions with modified SB models, including a broken exponential disk; two exponential disks; two Sérsic bulges; a single bulge with distinct inner and outer Sérsic indices; and a Sérsic halo. None can simultaneously fit all three data sets without invoking a kicked-up disk.
A more detailed discussion of this work can be found in Dorman et al. (2013).
Acknowledgments
The authors acknowledge NSF grants AST-0607852 and AST-1010039, NASA grant HST-GO-12055, and a NSF Graduate Research Fellowship.
References
- Courteau et al. (2011) Courteau, S., Widrow, L. M., McDonald, M., Guhathakurta, P., Gilbert, K. M., Zhu, Y., Beaton, R. L., & Majewski, S. R. 2011, ApJ, 739, 20. 1106.3564
- Dalcanton et al. (2012) Dalcanton, J. J., Williams, B. F., Lang, D., Lauer, T. R., Kalirai, J. S., Seth, A. C., Dolphin, A., Rosenfield, P., Weisz, D. R., Bell, E. F., Bianchi, L. C., Boyer, M. L., Caldwell, N., Dong, H., Dorman, C. E., Gilbert, K. M., Girardi, L., Gogarten, S. M., Gordon, K. D., Guhathakurta, P., Hodge, P. W., Holtzman, J. A., Johnson, L. C., Larsen, S. S., Lewis, A., Melbourne, J. L., Olsen, K. A. G., Rix, H.-W., Rosema, K., Saha, A., Sarajedini, A., Skillman, E. D., & Stanek, K. Z. 2012, ApJS, 200, 18
- Dorman et al. (2012) Dorman, C. E., Guhathakurta, P., Fardal, M. A., Lang, D., Geha, M. C., Howley, K. M., Kalirai, J. S., Bullock, J. S., Cuillandre, J.-C., Dalcanton, J. J., Gilbert, K. M., Seth, A. C., Tollerud, E. J., Williams, B. F., & Yniguez, B. 2012, ApJ, 752, 147. 1204.4455
- Dorman et al. (2013) Dorman, C. E., Widrow, L. M., Guhathakurta, P., Seth, A. C., Foreman-Mackey, D., Bell, E. F., Dalcanton, J. J., Gilbert, K. M., Skillman, E. D., & Williams, B. F. 2013, ApJ (in press)
- Foreman-Mackey et al. (2012) Foreman-Mackey, D., Hogg, D. W., Lang, D., & Goodman, J. 2012. 1292.3665
- Gilbert et al. (2012) Gilbert, K. M., Guhathakurta, P., Beaton, R. L., Bullock, J., Geha, M. C., Kalirai, J. S., Kirby, E. N., Majewski, S. R., Ostheimer, J. C., Patterson, R. J., Tollerud, E. J., Tanaka, M., & Chiba, M. 2012, ApJ, 760, 76. 1210.3362
- Purcell et al. (2010) Purcell, C. W., Bullock, J. S., & Kazantzidis, S. 2010, MNRAS, 404, 1711. 0910.5481
- Tissera et al. (2013) Tissera, P., Beers, T., Carollo, D., & Scannapieco, C. 2013, ArXiv e-prints. 1309.3609