Variability of the accretion disk of V926 Sco inferred from tomographic analysis.
Abstract
We present phase-resolved spectroscopic observations of the low-mass X-ray binary V926 Sco (4U 1735-44), covering the orbital period of 0.23d, obtained with the Walter Baade 6.5m Magellan Telescope at the Las Campanas Observatory in June 2010 and June 2011. We use H radial velocities to derive a systemic velocity of -1094km s-1. The FWHM of the lines observed in common with previous authors are significantly lower during our observations suggesting much reduced velocities in the system. The equivalent width of the Bowen fluorescence lines with respect to He II 4686 are factors of two or more lower during our observations in comparison to those previously reported for the system, suggesting reduced irradiation of the secondary. Doppler and modulation tomography of H and He II 4686 show assymmetric emission that can be attributed to a bulge in the accretion disk, as inferred from He II observations by previous authors. The X-ray fluxes from the source at times concurrent with the optical observations are significantly lower during our observations than during optical observations taken in 2003. We suggest that the system is in a lower accretion state compared to earlier observations; this explains both the lower velocities observed from the disk and the reduction of emission due to Bowen fluorescence detected from the secondary.
1 Introduction
V926 Sco (4U 1735-444) is a low mass X-ray binary (LMXB) that is persistent in X-rays. The shape of its X-ray color-color diagram caused Hasinger & van der Klis (1989) to classify it as an atoll source. The system has an orbital period of 4.65 hours, discovered through optical photometry (Corbet et al. 1986, Pederson et al. 1981), which showed a shallow sinusoidal variation in the light curve, interpreted as due to the varying aspect of the X-ray heated secondary object (e.g. van Paradijs et al. 1988). Although sinusoidal variation can also be produced by asymmetries in the disk, for example through the varying visibility of an irradiated inner disk bulge (Hellier & Mason 1989) or by superhumps (Haswell et al. 2001), the variation was attributed to the donor by Casares et al. (2006).
A periodic variation in the H line observed by Smale et al. (1984) was confirmed by Smale & Corbet (1991) and attributed to varying emission originating from a bulge or splash region at or near the point on the disk at which the gas stream impacts the outer rim. Augusteijn et al. (1998) found similar variation in He II 4686 and the blend of N III and C III emission lines (4634-4651) produced by Bowen fluorescence, and attributed both to a disk bulge.
Doppler tomography (Horne & Marsh 1986) was carried out on V926 Sco by Casares et al. (2006), using data taken in June 2003 with the FORS2 Spectrograph on the 8.2m Yepun Telescope at the Observatorio Monte Paranal. Tomography of He II 4686 showed an extended area of bright emission on one side of the disk, suggesting that the variation in this emission does arise from a bulge in the accretion disk, consistent with Smale & Corbet (1991). However, Casares et al. (2006) found that N III 4640 emission was coincident with the estimated velocity of the donor star, as opposed to a disk bulge. They attributed this to fluorescence of the donor, irradiated by UV photons from the hot inner disk, as originally suggested for Sco X-1, along with several other X-ray binaries, by McClintock, Canizares & Tartar (1975).

Our spectra cover nearly twice the bandwidth of Casares et al. (2006) including in particular the H line for which no previous tomographic study has been done and which is particularly useful for studying emission from the disk. In addition to Doppler tomography we also undertake modulation tomography (Steeghs et al. 2003) which allows us to take into consideration variations in the brightness of the components of the system which are harmonic with the orbital period. As Doppler tomography is limited by the assumption that the brightness of the components of a system do not vary, its combination with modulation tomography allows more accurate interpretation of the velocity maps of a system.
In section 2 we describe the optical observations obtained and used for this study. In section 3 we present our analysis of the spectral features. In section 4 we present Doppler and modulation tomography of the lines and end with a summary and conclusions in section 5.
2 Observations
Observations of V926 Sco were carried out on the nights of 2010 June 5,7 and 2011 June 22, 26, using the IMACS spectrograph on the Walter Baade 6.5 m Magellan telescope at the Las Campanas Observatory. A long-slit diffraction grating with 600 lines/mm at a tilt angle of was used, giving a wavelength range of approximately 4449-7581 (excluding small gaps due to CCD chip edges), with km s-1 (FWHM) resolution. A slit width of 0.9 arc seconds was used on 2011 June 22 and of 0.7 arc seconds on 2011 June 26 and 2010 June 5,7. 60 useful spectra were obtained, with exposures of 420-600 seconds, covering a total of approximately 1.5 orbital periods (Table 1). HeNeAr comparison lamp arcs were taken after approximately every three exposures. The images were corrected for bias and flat-fielded, then the spectra were extracted using IRAF optimal extraction for a weak spectrum, as described by Massey, Valdes, & Barnes (1992), to give the best possible signal to noise ratio. Anomalies due to cosmic rays and CCD errors were removed. The spectra were wavelength-calibrated using the time-nearest HeNeAr comparison arcs, with a separate second order polynomial fit of each of the four CCD chips across which the spectra were spread. In each case, the RMS scatter was . The flux standard Feige 110 was observed on the night of June 22, 2011. However, since none of our nights were photometric, we plot only relative intensities and give EWs in instrument counts.
| Phase | No. of | ||||||
|---|---|---|---|---|---|---|---|
| Date | UTC (start) | UTC (end) | MJD (start) | MJD (end) | coverage | spectra | Exposure(s) |
| 2010 June 5 | 00:39:20 | 04:18:51 | 55353.0273 | 55353.1798 | 0.22-1.01 | 15 | 420-600 |
| 2010 June 7 | 01:00:45 | 01:42:32 | 55355.0422 | 55355.0712 | 0.99-1.14 | 4 | 600 |
| 2011 June 22 | 05:54:58 | 09:02:57 | 55735.2465 | 55735.3770 | 0.76-0.44 | 15 | 600 |
| 2011 June 26 | 01:59:24 | 07:08:33 | 55739.0829 | 55739.2976 | 0.18-1.29 | 26 | 600 |
| Line | FWHM | EW | Centroid |
|---|---|---|---|
| (km s-1) | (Inst Cts) | () | |
| 06/05/2010 | |||
| Bowen blend | 95631 | 23.11.5 | 4641.1 |
| He II 4686 | 42020 | 23.52.0 | 4685.6 |
| H | — | — | 4860.9 |
| H | 41710 | 60.62.6 | 6561.2 |
| He I 6678 | — | — | 6678.0 |
| 06/07/2010 | |||
| Bowen blend | 71039 | 23.02.4 | 4640.1 |
| He II 4686 | 42523 | 41.34.3 | 4686.1 |
| H | — | — | 4860.9 |
| H | 41910 | 69.25.1 | 6562.3 |
| He I 6678 | — | — | 6678.0 |
| 06/22/2011 | |||
| Bowen blend | 77063 | 6.91.0 | 4641.9 |
| He II 4686 | 38025 | 11.51.4 | 4684.6 |
| H | 31365 | 4.21.6 | 4860.3 |
| H | 39410 | 37.31.8 | 6561.8 |
| He I 6678 | — | — | 6679.9 |
| 06/26/2011 | |||
| Bowen blend | 92833 | 11.31.0 | 4641.3 |
| He II 4686 | 38311 | 24.31.3 | 4684.7 |
| H | 28324 | 8.91.5 | 4859.8 |
| H | 3799 | 65.11.6 | 6561.3 |
| He I 6678 | 48328 | 10.71.2 | 6676.8 |
3 Spectral features and profiles
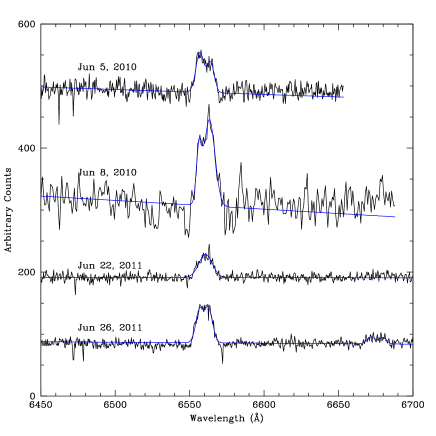
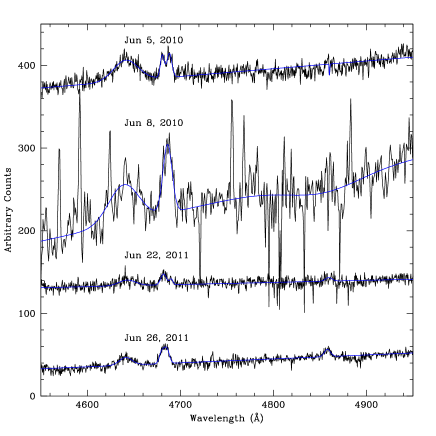
The spectra of V926 Sco averaged over the nights of June 5, 2010 and June 22 and June 26 2011 are presented in Fig. 1. Each contains relatively strong H emission in addition to weaker lines of H, He II 4686 & 5412, HeI 4922, and a blend of N III and C III emission lines (4641-4651) attributed to Bowen fluorescence, C IV 5807, and He I 6678. These emission features are consistent with those found by previous spectroscopic studies (Casares et al. 2006), Cowley et al. 2003, Augusteijn et al. 1998, Smale & Corbet 1991). Several absorption features attributed to interstellar and atmospheric absorption are also present.
Figs. 2 show the evolution of the main spectral features over the orbital period. We use the spectroscopic ephemeris of Casares et al. (2006) to determine orbital phases:
To(HJD) = 2452813.495(3) + 0.19383351(32)E
where To is defined as the compact object superior conjunction. H and He II 4686 display the classic double peak variation, with the peak shifting from red to blue over the orbital period as expected for emission from an accretion disk. The Bowen complex varies in strength over the orbit but does not show the double peak behavior. In order to determine the relative contribution of the spectral features, we fit the average nightly profiles with Gaussians. For the Bowen blend we used Gaussians representing the N III transitions (4634,4641,4642) and C III transitions (4647,4651,4652). For H, He II 4686, and He I 6678 we used two Gaussians each to represent the blue and red shifted emission from the disk. For all lines we used single Gaussians (for Bowen this was at 4641) to determine the instrumental EW. The fits are plotted in Fig. 3 and values for the fitted parameters are listed in Table 2. For the 2011 data, where we had full phase coverage, we also calculated equivalent widths as a function of orbital phase (Fig. 4). The equivalent widths increase between phases 0.5-0.8 consistent with emission from the disk bulge. The source appears to be reduced in intensity from 2010 to 2011, however since we do not have absolute fluxes we cannot determine this. We do find that the equivalent width of the Bowen complex is significantly reduced from 2010 to 2011. Since the 2010 phase coverage is poor, for the Bowen complex we construct tomograms only for the 2011 data. The reduction in flux observed for June 22, 2011 compared to June 26, 2011 is attributed to the larger slit size used due to poor seeing. The increase in slit size also reduced our spectral resolution; hence for our tomographic analysis of H and He II(4686) we use data from June 5, 2010 and June 26, 2011. The four spectra obtained on June 7, 2010 were used only to complete the radial velocity curve.
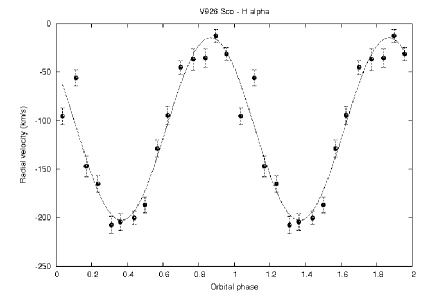
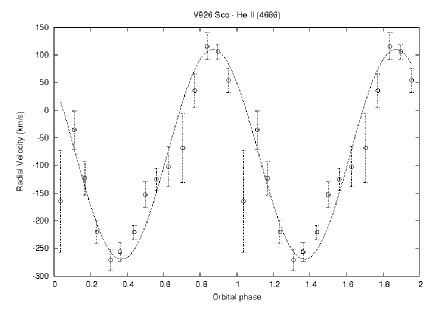
Figure 5 shows the radial velocities for H and He II(4686) obtained by cross-correlating all 60 individual spectra with Gaussians of FWHM as listed in Table 2. We used the spectrosopic ephemerides of Casares et al. (2006) as listed above. The curves are in antiphase with that expected from the secondary and consistent with emission from the disk. Our best-fit sine-wave to the H data give us a systemic velocity of -1094km s-1 with a semi-amplitude of 95km s-1. Our systemic velocity is consistent (within 2) with the value (1217km s-1) found by Casares et al. (2006) when using the wings of their HeII 4686 profile (which are expected to follow the motion of the compact star) and our errors are a factor of two smaller. Our HeII 4686 is weak compared to H but its radial velocity curve peaks at the same phase as H.
4 Tomography
Tomography is an imaging technique allowing two-dimensional velocity-space maps of a system to be reconstructed from spectra taken at multiple orbital phases. Spectra are assumed to be one-dimensional projections of the system in velocity space at a given phase. Under this assumption, if an accurate ephemeris is known an inversion technique can be used to produce possible fits to the data. In this case, a reduced test was used to modify an arbitrary starting image (e.g. a uniform or gaussian distribution) such that the predicted data from this image fit the real data. Due to the large number of possible fits for a given value of , the ‘Maximum Entropy Method’ (MEM) is employed to select the image which is most likely to be accurate; the image with the highest entropy is chosen at each iteration, on the assumption that a higher entropy corresponds to a smoother and therefore more physically realistic image of the system (Narayan & Nityananda 1986). For a complete description of imaging accretion disks using Doppler tomography, see Marsh & Horne (1988).
Modulation tomography produces additional velocity maps showing the magnitude of periodic, sinusoidal modulations in the brightness of the structural features of the system, in addition to the velocity maps of the time-averaged brightness seen in Doppler tomography. This allows variations in the brightness of a system to be taken into account when interpreting the time-averaged velocity maps. Although modulation tomography allows more accurate interpretation of velocity data than Doppler mapping alone, which assumes emission to be constant over the orbital period, data with a higher signal to noise ratio is required. For a more detailed description of modulation tomography of emission lines, see Steeghs (2003).


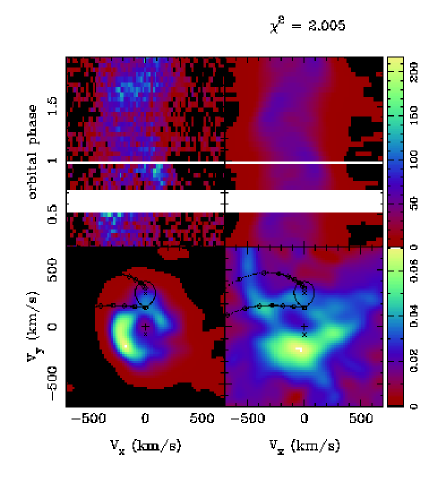

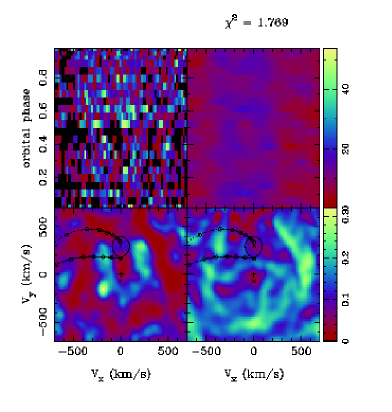
The modulation tomograms we produced are shown in Figs. 6a,b, and 7b. In each case, the figure is split into four panels. The upper two panels contain the trail of the original spectra around the chosen emission line on the left and the trail predicted from the final velocity map, for which is minimized, on the right. Lighter colors indicate higher intensities in each case. Each figure also contains two two-dimensional velocity maps. The lower left panel is the same as those produced by Doppler tomography, showing the brightness of the components of the system averaged over the orbital period. The lower right panel shows the amplitude of modulations in the brightness of the components of the system which are harmonic with the orbital period. In this case, bright areas indicate the regions with the greatest amplitude of modulation.
Each of the tomograms is overlaid with estimated values for the velocities of the neutron star, the donor’s Roche Lobe and the center of mass of the system. We used = 29883 km s-1 as determined by Casares et al. (2006). Since Casares et al. suggested a range (0.05-0.41) of mass ratios for V926 Sco we adopted their middle value of 0.23, giving a of 68 km s-1. We tried both our derived value of and the value used by Casares et al. (2006) () for the systemic velocity. Tests using a range of values near these velocities favored our derived value for the best fits. The Keplerian velocity of the disk along the accretion stream and the ballistic trajectory of the stream are also plotted, with circles along each line indicating steps of 0.1 Lagrangian radii from the compact object.
Because the time-averaged H and He II 4686 showed little change in FWHM and EW between June 5, 2010 and June 26, 2011, we were able to combine the data to improve our modulation tomograms. Doppler tomograms for both years are consistent with the modulation tomograms but show less detail, so we present only the modulation tomograms in this paper. Both lines show significant enhancement of emission in the lower left quadrant of the lower left panel (Figs. 6a,b); the corresponding modulation maps also show strong variation around these regions as would be expected of any non-symmetric feature in the system. The enhanced regions are superposed on crescent shaped emission with the H tomogram showing a second crescent in the upper right quadrant of the lower left panel.
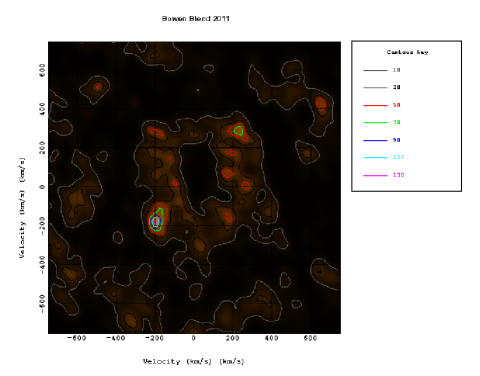
Since the EW of the Bowen complex changed by a factor of two from 2010 to 2011 we made separate tomograms for the two years. Because of the complexity and weakness of the Bowen blend, we first constructed Doppler tomograms. When the complex was stronger (2010) we had 0.9 phase coverage in only 12 bins, which led to poor maps and indeed showed only noise. In 2011, although the complex was weak, we had full phase coverage with over 20 phase bins (Fig. 7a), and found a hint of emission consistent with the disk bulge but no emission associated with the secondary as reported by Casares et al. (2006). A modulation tomogram of the 2011 data shows the same behavior as the Doppler map for 2011 (Fig. 7b); however, as the phased spectra in Fig. 2c demonstrate, there is no variation in amplitude within errors of measurement.
5 Discussion and Conclusions
Modulation tomography of the H and He II 4686 emission lines in the spectra of V926 Sco were found to support the suggestion of earlier authors (Casares et al. 2006; Augusteijn et al. 1998; Smale & Corbet 1991) that the accretion disk around the primary contains a large, extended bright region, attributed to a bulge in the disk.
Our observations show significant changes in the disk and secondary star emission from V926 Sco, both since the 2003 observations of Casares et al. (2006) and between 2010 and 2011 in our own observations. We find that the FWHM of the Bowen complex, He II 4686, and H are lower by a factor of about two compared to those reported by Casares et al. (2006). This suggests significantly lower velocities present in the system. While we only have EW in instrumental counts, we find that the EW of the Bowen complex is of the same order or considerably less than the EW of He II 4686, whereas Casares et al. found the EW of the Bowen complex to be twice that of He II in 2003.
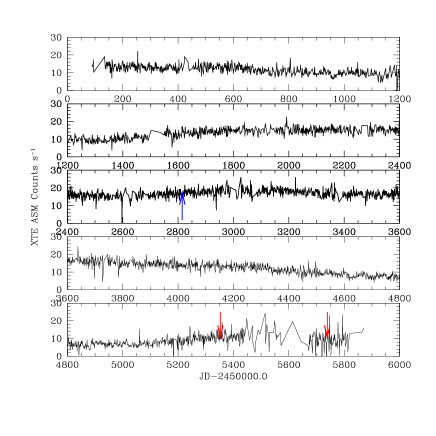
A significant reduction in X-ray emission is seen over the same period in the RXTE/ASM light curve of the system; the X-ray flux has decreased from an average of approximately 182 cts s-1 in 2003 to approximately 113 cts s-1 in 2010 and 83 cts s-1 in 2011 (see Fig. 8). In particular, since the 2010-2011 data were obtained during the last two years of the operation of RXTE, during which it is known that the ASM was running at a higher gain than that used for calibration, the real count rate is likely to be even lower. This indicates a reduction in the accretion rate of the system. Since Bowen fluorescence of the secondary is attributed to UV heating of the secondary surface by irradiation, the lower accretion rate is consistent with there being lower flux from the disk and compact object and hence less illumination to produce Bowen from the secondary.
In both H and He II 4686 we see crescent shaped emission as seen by Casares et al. (2006) from He II. This suggests the possibility of an eccentric disk, a phenomenon that occurs at mass ratios below (Haswell et al. 2001). Normally, the comparatively large mass of the compact object, together with conservation of angular momentum, leads to the formation of a circular accretion disk centered on the compact object. Below this mass ratio, however, the 3:1 resonance has been found to cause eccentric instability, leading to a non-axisymmetric, precessing disk (Haswell et al. 2001). In these cases, we would expect so called ‘superhumps’ to be observed in the light curve of the system (Calvelo et al. 2009; Zurita et al. 2002). While superhumps have not been detected in photometric studies of V926 Sco (e.g. Corbet et al. 1986; Pederson, van Paradijs, & Lewin 1981) an eccentric disk cannot be ruled out. Higher resolution observations at different epochs are required to either confirm or refute this possibility. The offset crescent shapes seen in the strong H tomogram may also suggest that angular momentum in the disk is being transported by density waves in the disk. This behavior has been seen in tomography of certain Cataclysmic Variables (Steeghs et al. 2003) and references therein). Steeghs et al. (2000) showed that two-armed trailing spirals in position coordinates map into two-armed crescent shapes in velocity coordinates.
References
Augusteijn, T., van der Hooft, F., de Jong, J.A., van Kerwijk, M.H., van Paradijs, J., 1998, A&A, 332, 561
Calvelo, D.E., Vrtilek, S.D., Steeghs, D., Torres, M.A.P., Neilsen, J., Filippenko, A.V., Gonzalez Hernandez, J.I., 2009, MNRAS, 399, 539
Casares, J., Cornelisse, R., Steeghs, D., Charles, P.A., Hynes, R.I., O’Brien, K., Strohmayar, T.E., 2006, MNRAS, 373, 1235
Corbet, R.H.D., Thorstensen, J.R., Charles, P.A., Menzies, J.W., Naylor, T., Smale, A.P., 1986, MNRAS, 222, 15
Cowley, A.P., Schmidtke, P.C., Hutchings, J.B., & Crampton, D. 2003, ApJ, 125, 2163
Hasinger, G., van der Klis, M., 1989, A&A, 225, 79
Haswell, C.A., King, A.R., Murray, J.R., Charles, P.A., 2001, MNRAS, 321, 475
Hellier, C., Mason, K.O., 1989, MNRAS, 239, 715
Horne, K., Marsh, T.R. 1986, MNRAS, 218, 716
Marsh, T.R., Horne, K., 1988, MNRAS 235, 269
Massey, P., Valdes, F., Barnes, J., 1992, ’A User’s Guide to Reducing Slit Spectra with IRAF’, (http://iraf.noao.edu/iraf/docs/)
McClintock, J.E., Canizares, C.R., Tarter, C.B., 1975, ApJ, 198, 641
Narayan, R., Nitayananda, R., 1986, ARA&A, 24, 127
van Paradijs, J., van der Klis, M., Pederson, H., 1988, A&A, 76, 185
Pederson, H., van Paradijs, J.,Lewin, W.H.G., 1981, Nature, 294, 725
Smale, A.P., & Corbet, R.H.D., 1991, ApJ, 383, 853
Smale, A.P., Charles, P.A., Tuohy, I.R., Thorstensen, J.R., 1984, MNRAS, 207, 29
Steeghs, D., 2003, MNRAS, 344, 448
Steeghs, D., Horne, K., Harlaftis, E. T., Stehle, R., 2000, NewAR, 44, 13
Zurita, C., Casares, J., Shahbaz, T., Wagner, R.M., Foltz, C.B., Rodrguez-Gil, P., Hynes, R.I., Charles, P.A., Ryan, E., Schwarz, G., Starrfield, S.G., 2002, MNRAS, 333, 791