Simulating galaxy evolution with a non-universal stellar initial mass function
Abstract
We consider that the stellar initial mass function (IMF) depends on physical properties of star-forming molecular clouds in galaxies and thereby investigate how such a non-universal IMF (NUIMF) influences galaxy evolution. We incorporate a NUIMF model into galaxy-scale chemodynamical simulations in order to investigate the differences in chemical and dynamical evolution of disk galaxies between the NUIMF and universal IMF (UIMF) models. In the adopted NUIMF model, the three slopes of the Kroupa IMF depend independently on densities and metallicities ([Fe/H]) of molecular gas clouds, and production rates of metals and dust from massive and AGB stars, formation efficiencies of molecular hydrogen (), and feedback effects of supernovae (SNe) can vary according to the time evolution of the three IMF slopes. The preliminary results of the simulations are as follows. Star formation rates (SFRs) in actively star-forming disk galaxies can be significantly lower in the NUIMF model than in the UIMF model, and the differences between the two models can be larger in galaxies with higher SFRs. Chemical enrichment can proceed faster in the NUIMF model and [Mg/Fe] for a given metallicity is higher in the NUIMF model. The evolution of fraction () and dust-to-gas ratio () is faster in the NUIMF model so that the final and can be higher in the NUIMF model. Formation of massive stellar clumps in gas-rich disks is more strongly suppressed owing to the stronger SN feedback effect in the NUIMF model. The radial density profiles of new stars within the central 1kpc are shallower in the NUIMF model.
keywords:
galaxies:ISM – galaxies:evolution – galaxies:formation – stars:formation1 Introduction
The stellar initial mass function (IMF) is a fundamentally important factor for galaxy formation and evolution, because it can control the number evolution of stars with different masses in galaxies and thus the long-term evolution of luminosities, chemical abundances, dynamical properties of galaxies (e.g., Larson 1998). Physical interpretation of observational data and theoretical predictions of galactic properties therefore depend strongly on what IMF is adopted. It is still controversial, however, whether the IMF is universal or different in galaxies with different physical properties (e.g., Bastian et al. 2010; Kroupa et al. 2012). It is also observationally unclear whether or how the IMF depends on local physical properties of star-forming giant molecular clouds in galaxies with different properties (e.g., masses and luminosities), though previous theoretical studies of star formation investigated possible dependences of the IMF slopes on cloud properties (e.g., Elmegreen 2004; Larson 2005).
A growing number of recent observational studies have found possible evidences for (i) a significant variation of the IMF in galaxies with different physical properties and different redshifts and (ii) correlations between the IMF slope and galactic properties (e.g., Hoversten & Glazebrook 2008; van Dokkum 2008; Meurer et al. 2009, M09; Treu et al. 2010; Gunawardhana et al. 2011, G11; Cappellari et al. 2012; Conroy & van Dokkum 2012; Ferreras et al. 2012; van Dokkum & Conroy 2012; Geha et al. 2013). These observational results have raised a number of questions on the IMF such as (i) how the IMF can be bottom-heavy in the formation of elliptical galaxies (e.g., van Dokkum & Conroy 2012), (ii) how the IMF slope depends on star formation rates and densities in galaxies (e.g., M09; G11), and (iii) whether or not galaxy formation models with a universal IMF (UIMF) can explain the observed Faber-Jackson and Tully-Fisher relation of galaxies (e.g., Dutton et al. 2011).
A number of previous theoretical studies adopted a non-standard IMF to explain some specific observational results on physical properties of galaxies (e.g., Elmegreen 2009 for a recent review). Their models with top-heavy IMFs tried to explain the observed colors of elliptical galaxies (e.g., Pipino & Matteuci 2004), the chemical abundances (e.g., [/Fe]) of giant elliptical galaxies (e.g., Nagashima et al. 2005), and the number counts of distant submillimeter galaxies (Baugh et al. 2005). These studies chose a fixed non-standard IMF either for the entire galaxy formation or only for starburst phases in an arbitrary manner in order to explain some specific observational results. These studies are therefore unable to discuss how the IMF should change in different galaxies and in different environments in order to explain different observational results in a self-consistent manner.
So far, only a few theoretical studies have investigated the time evolution of the IMF in galaxies with different physical properties based on hydrodynamical simulations of galaxy formation and evolution with a NUIMF model (e.g., Davé 2008; Narayana & Davé 2012; Bekki & Meurer 2013, BM13). These simulations, however, did not consider the possible physical effects of a NUIMF on galaxies thus were unable to discuss whether and how a NUIMF can influence the formation and evolution processes of galaxies in a self-consistent manner. Although the number of SNe, chemical yields, and dust yields are significantly different between different IMFs, previous numerical simulations of galaxy formation and evolution with a NUIMF model did not include the dependences of SN feedback effects, chemical evolution, and dust production processes on the IMF. Therefore, it is essential for theoretical studies to include self-consistently the IMF-dependent physical processes in order to discuss how galaxy evolution is influenced by a NUIMF.
Thus the two major purposes of this paper are as follows. One is to describe the details of our new chemodynamical simulations with a NUIMF model. The other is to show the preliminary results of the simulations on the major influences of the adopted NUIMF on SFRs, chemical and dynamical evolution, and dust and contents of disk galaxies. We implement the NUIMF model recently proposed by Marks et al. (2012, M12) in the present study. This is mainly because the NUIMF model by M12 was derived from comparison between observational data sets and theoretical modeling. M12 showed that (i) the stellar present-day mass function (PDMF) in the Galactic globular clusters (GCs) can be determined by residual-gas expulsion at the epoch of GC formation, (ii) the gas expulsion process depends on the high-mass IMF () of forming GCs, and (iii) the observed PDMF depending on GC properties (half-mass radius, mass density, and metallicity) can be reproduced by their NUIMF model that depends on density and metallicity of forming GCs. Although the adopted NUIMF model has some physical basis (as above), we briefly discuss advantages and disadvantages of the present chemodynamical simulations with the NUIMF model by M12 later in this paper.
| Physical properties | Parameter values |
| Total Mass 111, where , , and are the total masses of dark matter halo, disk, and bulge in a galaxy, respectively. | |
| DM structure 222 The NFW profile with a virial radius () and a parameter is adopted for the structure of dark matter halo. | kpc, |
| Disk mass | |
| Disk scale length | kpc |
| Gas fraction in a disk | |
| Bulge mass | |
| Bulge size | kpc |
| Galaxy interaction | No |
| Initial central metallicity | |
| Initial metallicity gradient | dex kpc-1 |
| Chemical yield | T95 for SN, VG97 for AGB |
| Dust yield | B13 |
| Dust formation model 333 and are the dust accretion and destruction timescales, respectively. | Gyr, Gyr |
| Initial dust/metal ratio | 0.4 |
| formation 444The same model as B13, where formation processes depend on local gas density, (dust-to-gas ratio), and interstellar radiation field (ISRF). | Dependent on and ISRF (B13) |
| Feedback 555 is the binary fraction of stars that can finally explode as SNe Ia. The fiducial model without SN feedback effects is also investigated for comparison. No AGN feedback effects are included in the present study. | SNIa () and SNII |
| SF 666 is the threshold gas density for star formation and interstellar radiation field (ISRF) is included in the estimation of mass fraction in this model. | -dependent, ISRF, cm-3 |
| IMF 777The time-varying Kroupa IMF is referred to as ‘NUIMF’. This standard model with the fixed Kroupa IMF model (‘UIMF’) is also investigated for comparison. | Time-varying Kroupa IMF |
| Particle number | |
| Softening length | kpc, pc |
| Mass resolution for stars |
The plan of this paper is as follows: In the next section, we describe the methods and techniques of our new chemodynamical simulations with a NUIMF model. In §3, we clearly demonstrate the predictive power of the new simulations of IMF evolution and its influences on galaxy formation and evolution. In §4, we present the numerical results on the time evolution of physical properties of isolated and interacting disk galaxies, such as star formation rates (SFRs), dust-to-gas ratios (), molecular fraction (), chemical abundances, and dynamical properties. We discuss the important implications of the present results in terms of (i) possible evidence of top-heavy IMFs and (ii) bulge formation in §5. We summarize our conclusions in §6.
The present study focuses exclusively on the influences of the NUIMF on the evolution of disk galaxies. Unlike previous theoretical studies on neutral and molecular hydrogen and chemical abundances of forming galaxies based on a CDM cosmology (e.g., Fu et al. 2010, Lagos et al. 2011; Duffy et al. 2012; Dave et al. 2013), the present simulations do not start from initial conditions of galaxies formation. Therefore, the present study does not allow us to discuss physical properties of all components (gas, metals, old and young stars) in a fully self-consistently manner. However, the results of the present simulations can help us to better understand the possible influences of the NUIMF on galaxy evolution. Our future simulations of galaxy formation with the NUIMF will address key issues of galaxy formation discussed in the above previous theoretical studies.
2 The model
2.1 Overview
We perform numerical simulations of actively star-forming disk galaxies by using our original chemodynamical code (Bekki 2013, B13) which incorporated formation and evolution of and accretion and destruction of dust in a self-consistent manner. In the present study, we newly incorporate a NUIMF into the chemodynamical simulations so that we can discuss both (i) the time evolution of the IMF and (ii) its influences on the evolution of chemical and dynamical properties and dust and contents in galaxies. Since the details of the chemodynamical code is given in B13, we just briefly describe the code and focus on how we implement a NUIMF in galaxy-scale chemodynamical simulations in the present study.
The three IMF slopes of the Kroupa IMF for each star-forming gas cloud in a galaxy are assumed to depend on physical properties of the clouds and be therefore time-varying in the present study. We estimate the IMF slopes for each cloud at each time step in a chemodynamical simulation by examining the cloud properties. The chemical yields and dust production from SNe and AGB stars strongly depend on the IMF slopes and need to be self-consistently changed according to the slopes. We therefore include the IMF-dependent chemical and dust yields in the present chemodynamical evolution. Also SN feedback effects, formation on dust grains, and dust accretion and destruction, all of which can depend on the IMF slopes, are self-consistently included in the simulations according to the changes of the IMF slopes.
| Model name 888 For each model (e.g. M1), galaxy evolution with the UIMF or the NUIMF is investigated. Also, for each model, galaxy evolution with the NUIMF and with/without SN feedback effects (‘SN’ or ‘NSN’, respectively) is investigated. | () | [Fe/H]0 | 999The mass-ratio of two interacting galaxies is represented by . If tidal interaction with a companion galaxy is not included, is shown. | Comments | ||||
| M1 | 10.0 | 15.2 | 0.15 | 0.09 | 0.34 | 0.0 | isolated MW, gas-poor, standard | |
| M2 | 10.0 | 15.2 | 0.15 | 0.27 | 0.17 | 0.0 | ||
| M3 | 10.0 | 15.2 | 0.15 | 0.55 | 0.0 | gas-rich | ||
| M4 | 10.0 | 15.2 | 0.15 | 0.09 | 0.34 | 1.0 | tidal interaction | |
| M5 | 12.0 | 15.2 | 0.0 | 0.55 | 0.0 | gas-rich LMC | ||
| M6 | 16.0 | 15.2 | 0.0 | 0.55 | 0.0 | gas-rich dwarf | ||
| M7 | 10.0 | 15.2 | 0.0 | 0.09 | 0.34 | 0.0 | bulgeless | |
| M8 | 10.0 | 15.2 | 1.0 | 0.09 | 0.34 | 0.0 | big bulge | |
| M9 | 10.0 | 30.4 | 0.30 | 0.55 | 0.0 | gas-rich, low-mass disk | ||
| M10 | 10.0 | 75.9 | 0.76 | 0.55 | 0.0 | early MW disk | ||
| M11 | 10.0 | 15.2 | 0.15 | 0.09 | 0.34 | 0.0 | LSB, kpc | |
| M12 | 12.0 | 15.2 | 0.0 | 0.27 | 0.0 | less gas-rich LMC | ||
| M13 | 16.0 | 15.2 | 0.0 | 0.27 | 0.0 | less gas-rich Dwarf | ||
| M14 | 10.0 | 15.2 | 0.15 | 0.09 | 0.34 | 3.0 | high-mass companion | |
| M15 | 10.0 | 15.2 | 0.15 | 0.09 | 0.34 | 0.3 | low-mass companion |
2.2 Isolated spiral galaxy
A spiral galaxy is composed of dark matter halo, stellar disk, stellar bulge, and gaseous disk. Gaseous halos that were included in our previous works (e.g., Bekki 2009) are not included in the present paper, because we do not discuss ram pressure stripping of halo gas within clusters and groups of galaxies. The total masses of dark matter halo, stellar disk, gas disk, and bulge are denoted as , , , and , respectively. The total disk mass (gas + stars) and gas mass fraction are denoted as and , respectively, for convenience. The mass ratio of the dark matter halo to the disk in a disk galaxy is a free parameter () and the density distribution of the halo is represented by the NFW profile (Navarro et al. 1996). The -parameter and the virial radius () are chosen appropriately for a given dark halo mass () by using the relation predicted by recent cosmological simulations (Neto et al. 2007).
The bulge of a spiral has a size of and a scale-length of and is represented by the Hernquist density profile. The bulge is assumed to have isotropic velocity dispersion and the radial velocity dispersion is given according to the Jeans equation for a spherical system. The bulge-mass fraction () is a free parameter. We mainly investigate “Milky Way” models (referred to as “MW” from now on) in which and (i.e., ), where , is the size of the stellar disk. We describe the results of the models with (‘bulgeless’), 0.167 (MW bulge), and 1 (‘big bulge’) in the present study.
The radial () and vertical () density profiles of the stellar disk are assumed to be proportional to with scale length and to with scale length , respectively. The gas disk with a size of has the same radial and vertical scale lengths as the stellar one yet has a larger size than the stellar one (). In the present model for the MW, the exponential disk has kpc and kpc. The adopted kpc is consistent with the recent observational result by Kalberla & Kerp (2009) which shows that the gas disk of the MW is well described by an exponential disk up to 35 kpc (See Fig. 5 in their paper). In addition to the rotational velocity caused by the gravitational field of disk, bulge, and dark halo components, the initial radial and azimuthal velocity dispersions are assigned to the disc component according to the epicyclic theory with Toomre’s parameter = 1.5. Both gas and stellar disks in a disk galaxy have throughout the disk so that the disk can be stabilized against axisymmetric gravitational instability. However, the adopted value of is not enough to stabilize the disk against global bar instability in the central regions, in particular, for disk galaxies with small bulges. Therefore, the present models with small bulges can show stellar bars in their central regions. The vertical velocity dispersion at a given radius is set to be 0.5 times as large as the radial velocity dispersion at that point, as is consistent with the observed trend of the Milky Way.
We allocate metallicity to each disk and bulge star according to its initial position: at = , where () is the projected distance (in units of kpc) from the center of the disk, the metallicity of the star is given as:
| (1) |
We adopt the observed value of (e.g., Andrievsky et al. 2004) for all models, and the central metallicity is chosen according to the adopted and . For the MW model, , which gives a reasonable value of [Fe/H]=0 at the solar radius ( kpc). The initial central metallicity (or [Fe/H]0) is chosen according to (i) the mass metallicity relation of and (ii) the standard prediction from one-zone chemical evolution models on the relation between the gas mass fraction () and the metallicity of a galaxy (i.e., ). The initial [/Fe] ratios are set to be the same as the solar values (e.g., [Mg/Fe]=0) across the stellar and gas disks of a galaxy. Initial temperature of gas is set to be K for all models.
We mainly investigate the MW models in which , , kpc, = 6.6 , = 17.5 kpc, , kpc, and different (=0.09, 0.27, and 0.55). The MW model with and without tidal interaction is referred to as ‘the fiducial model’ and the basic parameters are shown in Table 1. We also investigate how the present results depend on model parameters such as and , and presence or absence of tidal interaction. The model and 0.55 are referred to as ‘gas-poor’ and ‘gas-rich’ models, respectively. The model with , , and (i.e., no bulge) is referred to as the LMC (Large Magellanic Cloud) model (M5). The low-mass model with , , and is referred to as the dwarf model (M6). We adopt rather high baryonic fractions for low-mass disks (the same as those in the MW models), mainly because we try to understand more clearly how the initial total mass can influence IMF evolution by comparing between the dwarf, LMC, and MW models with the same initial conditions (other than total masses).
The total numbers of particles used for dark matter, stellar disk, gas disk, and bulge in an isolated disk are 700000, 200000, 100000, and 33400, respectively (i.e., is used in total). The softening length of dark matter halo () for each model is chosen so that can be the same as the mean particle separation at the half-mass radius of the halo. This method is applied for determining softening length for stellar particles () in the initial disk of each model. The softening length is assumed to be the same between old stellar, gaseous, and new stellar particles in the present study. The gravitational softening length for dark () and baryonic components () are 2.1 kpc and 200 pc, respectively, for the MW model. These values are different in models with different sizes and masses.
2.3 Tidal interaction
As shown in BM13, the high-mass end of the IMF can become top-heavy during galaxy interaction and merging. We accordingly investigate how galaxy evolution during galaxy interaction between two spiral galaxies can be influenced by the NUIMF. One of the two galaxies (‘primary galaxy’) is represented by the spiral galaxy model described above whereas the interacting companion galaxy is represented by a point-mass particle. The mass-ratio of the companion to the primary is a free parameter represented by and we investigate the models with , 1, and 3. The orbits of interacting galaxies are assumed to be ‘prograde interaction’ in which the spin axis of the primary is parallel to the orbital spin axis. The initial distance of the two galaxies, the pericenter distance, and the orbital eccentricity are set to be , , and 1.0 (i.e., parabolic), respectively. A more dramatic change in the time evolution of gas density and star formation can occur in the adopted prograde interaction than in other orbital configurations (e.g., retrograde interaction). Accordingly, the influences of the NUIMF on interacting galaxies can be more clearly seen in the present study (i.e., only the models in which the IMF influences are pronounced are shown). Thus, it should be stressed that the influences of the NUIMF on interacting galaxies are not always seen in the tidal models.
2.4 Star formation and SN feedback effects
Since SF can proceed in molecular clouds, we adopt the following ‘-dependent’ SF recipe (B13) using molecular gas fraction () defined for each gas particle in the present study. A gas particle can be converted into a new star if (i) the local dynamical time scale is shorter than the sound crossing time scale (mimicking the Jeans instability) , (ii) the local velocity field is identified as being consistent with gravitationally collapsing (i.e., div v), and (iii) the local density exceeds a threshold density for star formation (). We mainly investigate the models with cm-3 in the present study.
A gas particle can be regarded as a ‘SF candidate’ gas particle if the above three SF conditions (i)-(iii) are satisfied. It could be possible to convert some fraction () of a SF candidate gas particle into a new star at each time step until the mass of the gas particle becomes very small. However, this SF conversion method can increase dramatically the total number of stellar particles, which becomes numerically very costly. We therefore adopt the following SF conversion method. A SF candidate -th gas particle is regarded as having a SF probability ();
| (2) |
where corresponds to a star formation efficiency (SFE) in molecular cores and is set to be 1, is the time step width for the gas particle, is the gas density of the particle, and is the power-law slope of the Kennicutt-Schmidt law (SFR; Kennicutt 1998). A reasonable value of is adopted in the present study.
At each time step random numbers (; ) are generated and compared with . If , then the gas particle can be converted into a new stellar one. In this SF recipe, a gas particle with a higher gas density and thus a shorter SF timescale () can be more rapidly converted into a new star owing to the larger . Equally, a gas particle with a higher can be more rapidly converted into a new star. We thus consider that the present SF model is a good approximation for star formation in molecular gas of disk galaxies.
Each SN is assumed to eject the feedback energy () of erg and 90% and 10% of are used for the increase of thermal energy (‘thermal feedback’) and random motion (‘kinematic feedback’), respectively. The thermal energy is used for the ‘adiabatic expansion phase’, where each SN can remain adiabatic for a timescale of . We adopt yr, which is reasonable for a single SN explosion. This can be different for multiple SN explosions in a small local region owing to complicated interaction between gaseous ejecta from different SNe. However, we show the results of the models with yr in the present study. The energy-ratio of thermal to kinematic feedback is consistent with previous numerical simulations by Thornton et al. (1998) who investigated the energy conversion processes of SNe in detail. The way to distribute of SNe among neighbor gas particles is the same as described in Bekki et al. (2012). The radiative cooling processes are properly included by using the cooling curve by Rosen & Bregman (1995) for K and the MAPPING III code for K (Sutherland & Dopita 1993).
2.5 Chemical evolution
Chemical enrichment through star formation and metal ejection from SNIa, II, and AGB stars is considered to proceed locally and inhomogeneously. SNe and AGB stars are the production sites of dust, and some metals ejected from these stars can be also accreted onto dust grains in the ISM of galaxies. We investigate the time evolution of the 11 chemical elements of H, He, C, N, O, Fe, Mg, Ca, Si, S, and Ba in order to predict both chemical abundances and dust properties in the present study. The mean metallicity for each th stellar particle is represented by . The total mass of each th () chemical component ejected from each th stellar particles at time is given as
| (3) |
where is the mass of the th stellar particle, is the mass of each th chemical component ejected from stars per unit mass at time , and represents the time when the th stellar particle is born from a gas particle. This includes both the metals recycled and those newly synthesized, and both metals can be calculated for each stellar particle based on the adopted yield tables (described below) and the metal abundances of the particle. is given equally to neighbor SPH gas particles (with the total number of ) located around the th stellar particle. Therefore, the mass increase of each th chemical component for th gas particle at time () is given as
| (4) |
where is the total number of neighbor stellar particles whose metals can be incorporated into the th gas particle.
We consider the time delay between the epoch of star formation and those of supernova explosions and commencement of AGB phases (i.e., non-instantaneous recycling of chemical elements). Therefore, the mass of each th chemical component ejected from each th stellar particle is strongly time-dependent. We also adopt the ‘prompt SN Ia’ model in which the delay time distribution of SNe Ia is consistent with recent observational results by extensive SN Ia surveys (see B13 for the detail of the prompt SN Ia model). The chemical yields adopted in the present study are the same as those used in Bekki & Tsujimoto (2012) except those from AGB stars. We adopt the nucleosynthesis yields of SNe II and Ia from Tsujimoto et al. (1995; T95) and AGB stars from van den Hoek & Groenewegen (1997; VG97) in order to estimate in the present study. We mainly investigate [Mg/Fe][Fe/H] relation of the simulated galaxies, mainly because this relation can represent [/Fe][Fe/H] relations.
2.6 Dust model
2.6.1 Yield
The present dust model is essentially the same as that adopted in the previous multi-zone model by Dwek (1998, D98), which reproduced reasonably well the observed chemical and dust properties of the Galaxy in a self-consistent manner. The dust model consists of the following four components: (i) production in stellar winds of SNe Ia and SNe II and AGB stars, (ii) accretion of metals of ISM on dust grains, (iii) destruction of dust by energetic SN explosions, and (iv) PAH formation. The present model is somewhat idealized in that it does not include coagulation of small dust grains and time evolution of dust sizes.
The total mass of th component (=C, O, Mg, Si, S, Ca, and Fe) of dust from th type of stars ( = I, II, and AGB for SNe Ia, SNe II, and AGB stars, respectively) is described as follows;
| (5) |
where is the condensation efficiency (i.e., the mass fraction of metals that are locked up in dust grains) for each th chemical component from th stellar type, is the function that determines the total mass of metals that can be used for dust formation, and is the mass of th component ejected from th stellar type. The total mass of stellar ejecta is estimated by using stellar yield tables by T95 and VG97. We adopt the exactly same and as those used in B13.
2.6.2 Accretion
Dust grains can grow by accretion of metals of ISM onto preexisting cores and this accretion process is included in previous models (D98). Following D98, we consider that the key parameter in dust accretion is the dust accretion timescale (). In the present study, this parameter can vary between different gas particles and is thus represented by for th gas particle. The mass of th component (=C, O, Mg, Si, S, Ca, and Fe) of dust for th gas particle at time () can increase owing to dust accretion processes. The mass increase is described as
| (6) |
where is the individual time step width for the th gas particle and is the fraction of the th chemical element that is locked up in the dust. Owing to this dust growth, the mass of th chemical component that is not locked up in the dust () can decrease, which is simply given as
| (7) |
As is clear in these equations, the total mass of th component in th gas particle () is . For all models, is set to be 0.25 Gyr in the present study.
2.6.3 Destruction
Dust grains can be destroyed though supernova blast waves in the ISM of galaxies (e.g., McKee 1989) and the destruction process is parameterized by the destruction time scale () in previous one-zone models (e.g., Lisenfeld & Ferrara 1998; Hirashita 1999). Following the previous models, the decrease of the mass of th component of dust for th gas particle at time due to dust destruction process is as follows
| (8) |
where is the dust destruction timescale for th particle. The dust destroyed by supernova explosions can be returned back to the ISM, and therefore the mass of th chemical component that is not locked up in the dust increases as follows:
| (9) |
Thus the equation for the time evolution of th component of metals for th gas particle are given as
| (10) |
Likewise, the equation for dust evolution is given as
| (11) |
Dust is locked up in stars as metals are done so, when gas particles are converted into new stars. This means that star formation process itself has an effect of destroying dust in the present study. As shown in B13, models with can explain the dust-to-gas ratio () in luminous disk galaxies. Therefore is set to be 0.5 Gyr in the present study.
2.7 formation and dissociation
The model for formation and dissociation in the present study is exactly the same as those used in B13: formation on dust grains and dissociation by FUV radiation are both self-consistently included in chemodynamical simulations. The temperature (), hydrogen density (), dust-to-gas ratio () of a gas particle and the strength of the FUV radiation field () around the gas particle are calculated at each time step so that the fraction of molecular hydrogen () for the gas particle can be derived based on the formation/destruction equilibrium conditions. Thus the fraction for -th gas particle () is given as;
| (12) |
where means a function for determination, and the detail of the derivation process of are given in B13. Thus each gas particle has , metallicity ([Fe/H]), and gas density, all of which are used for estimating the IMF slopes for the particle (when it is converted into a new star).
2.8 The varying Kroupa IMF model
We adopt the NUIMF model proposed by M12 in which (i) the basic multi-power-law form is the same as the Kroupa IMF (Kroupa 2000) and (ii) the IMF slopes (, i=1, 2, 3) depend on the densities and metallicities of gas clouds from which new stars form. Although we choose the M12 IMF to discuss how galaxy evolution is influenced by the NUIMF in the present study, this choice would not be regarded as the most reasonable and realistic. Recently Narayanan & Davé (2012) adopted a NUIMF model in which the characteristic mass of stars is proportional to , where SFR is the star formation rate of a local region in a galaxy. Their IMF model is therefore significantly different from the M12’s IMF in the sense that the IMF slope does not change in their model (see their Fig.2). We do not discuss which of the two IMFs is better and realistic in terms of reproducing the observed properties of galaxies in the present study.
The Kroupa IMF has the following form (M12);
| (13) |
where is the number of stars forming in the mass interval [, ], (1, 2, 3) is the power-law slope of the IMF, is a normalization constant, and is a constant that should be chosen for a given set of to warrant continuity at the edges of the power-law segments. For the canonical IMF, , , and are 1.3, 2.3, and 2.3, respectively, for , , and , where is the stellar upper-mass limit and set to be in the present study.
The low-mass end of the Kroupa IMF for each -th new stellar particle () depends solely on [Fe/H] as follows
| (14) |
where [Fe/H]i is the iron abundance of the particle. The value of for -th new stellar particle () is also determined solely by [Fe/H];
| (15) |
The high-mass end of the Kroupa IMF for each -th new stellar particle () is described as follows;
| (16) |
where is the density of a rather high-density gaseous core where star formation can occur. This equation holds for , where , and for (M12). We slightly modify the M12’s IMF model such that the threshold in M12 is not introduced in the present study. This is mainly because the -dependence at is not so clear (not so flat as M12 showed) owing to a small number of data points.
We can directly estimate and by using [Fe/H] and the above equations (14) and (15). We estimate from local gas density and of Jeans-unstable gas particles in equation (16). This is because the present simulation can not resolve the rather high-density cores of star-forming or cluster-forming molecular gas clouds. The local value of at each Jeans-unstable gas is estimated by multiplying the mean density of a cloud, (), by a constant :
| (17) |
The derivation process of is as follows. The Jeans-unstable gas is assumed to be star-forming giant molecular clouds and thus have the following size-mass scaling relation derived from the observed mass-density relation by Larson (1981):
| (18) |
Since the equation (16) is based largely on the observed properties of the Galactic GC and nearby star clusters, a reasonable can be the typical density ratio of GCs to GC-host GMCs. We here consider that (i) should correspond to a typical mean mass density for GCs, (ii) typical GC mass () and size () are and 3pc, respectively (Binney & Tremaine 2007), (iii) original GCs just after their formation from GMCs should be times more massive than the present ones (e.g., Decressin et al. 2010; Marks & Kroupa 2010; Bekki 2011), and (iv) a star formation efficiency of GC-host GMCs is . For and pc in the typical GC-host GMC, a reasonable () is estimated to be in BM13.
In the present paper, we adopt rather than the above in BM13. We need to adopt different from the one adopted in BM13, firstly because BM13 did not include formation model at all (thus less accurately estimate ), and secondly because the predicted slope for the high-mass end of the IMF in the MW model could not be so consistent with the observed one of the Galaxy () for . We run a number of models with different and confirm that if we adopt , then not only the mean of the present MW model with but also the fraction in the gas disk can be consistent with the observed ones of the MW. We therefore adopt for all models in the present study. We discuss these points later in 3.1 by using the results of the models with different .
In the present study, is assumed to take the same value for different galaxies and different environments. This assumption appears to be oversimplified, given that previous theoretical studies showed the dependences of physical properties of atomic and molecular clouds on metallicity, far-ultraviolet radiation field, and the ionization rate in the Galaxy (e.g., Wolfire et al, 2003; Krumholz et al. 2009). In this situation, the best thing that the present study can do is to clearly show how the present results could possibly depend on . This point is briefly discussed later in §3.1. Our future more sophisticated simulations will need to include the dependences of central densities of gas clouds on time-dependent local ionization rates that are not explicitly included in the present simulations.
Almost all models in the present study do not show large (; very steep IMF) that is needed to explain the observed FUV flux ratios of low surface brightness galaxies (LSBs) in M09. This is mainly because star formation can occur only in higher density gaseous regions where can be smaller in the present models. Although the original IMF model by M12 is theoretically derived from observations on physical properties of GCs and star clusters, we assume that the IMF model applies for all new stars in each bin (i.e., not just for star clusters).
2.9 Main points of analysis
We mainly focus on detailed comparison between models with the UIMF and the NUIMF in order to understand how star formation histories (SFHs) and chemical and dynamical evolution of galaxies can be influenced by a time-varying IMF. Table 2 summarizes parameter values for the 15 representative models with different model parameters (e.g., , , and ) for which the simulation results are described in detail. The MW models with different (M1, M2, and M3), with the UIMF/NUIMF, and with/without SN feedback effects (‘SN’ and ‘NSN’, respectively) are the most extensively investigated so that the physical roles of the NUIMF in galaxy evolution can be clearly elucidated.
The tidal interaction models (M4, M14, and M15) are investigated so that we can better understand how the adopted NUIMF influences galaxy evolution during strong starbursts triggered by tidal interaction. In order to understand how the IMF roles in galaxy evolution depend on initial galaxy masses, we investigate the LMC models with (M5 and M12) and the dwarf models with (M6 and M13). We also try to find possibly different roles of the NUIMF in disk galaxies with different bulge masses and mean surface mass densities (M7, M8, M9, M10, and M11). In the following, in a simulation represents the time that has elapsed since the simulation started.

3 The predictive power of simulations
Since there are no previous simulations which investigated both the IMF evolution and its influences on galaxy evolution in a self-consistent manner, we consider that it is important for this paper to describe what IMF properties the new chemodynamical simulations can predict for different galaxies. Thus we briefly describe the time evolution of the IMF slopes, the 2D distributions of the slopes within galaxies, and the physical connection between top-heavy IMFs and galaxy interaction and merging before we discuss the differences in galaxy evolution between the UIMF and NUIMF models in §4.
3.1 IMF evolution
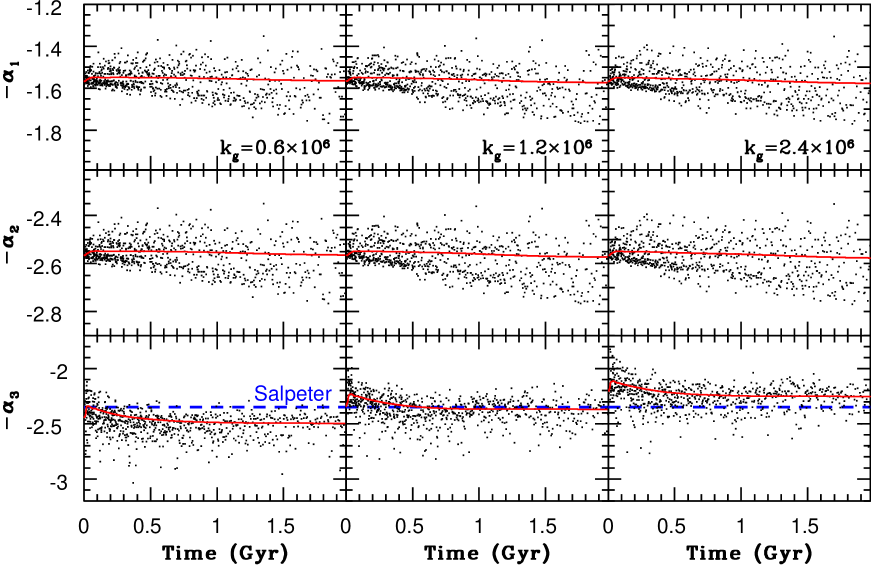
Fig. 1 shows (i) the formation time and the IMF slopes for each new star and (ii) the time evolution of the mean IMF slopes in the fiducial model with (M1 with the NUIMF model and SN feedback effects). Different new stars form in gas clouds with different gas densities and [Fe/H] so that the stars can have different IMF slopes. As a result of this, the IMF slopes show some dispersion for a given time. The IMF slope (), which is determined solely by [Fe/H], ranges from 1.3 (2.3) to 1.8 (2.8) for the last 2 Gyr disk galaxy evolution, and there is no remarkable evolution of owing to a small degree of chemical enrichment in this gas-poor disk. The high-mass end of the IMF () does not change during the isolated disk evolution, though the dispersion is larger than and (). The mean can stay around , which is similar to the canonical IMF. The derived no/little evolution of the IMF slopes in the isolated gas-poor disk model means that the present simulations enable us to investigate how external perturbation (e.g., galaxy interaction/merging) and high gas fraction can influence the IMF evolution (as discussed later).
Fig. 1 also shows the time evolution of the three IMF slopes in the models with different . Owing to the adopted dependence of on gas density, the time evolution of depends more strongly on in comparison with and and thus can be used to determine which is reasonable and realistic in the present study in which is fixed in all models. Clearly, the model with is better at reproducing the Salpeter slope observed in the solar neighborhood than the other two models. Furthermore, the evolution of is stable during Gyr evolution of the disk. These results confirm that the present NUIMF model with can be used in investigating chemical and dynamical influences of the NUIMF on galaxies.
3.2 2D distributions of the IMF slopes
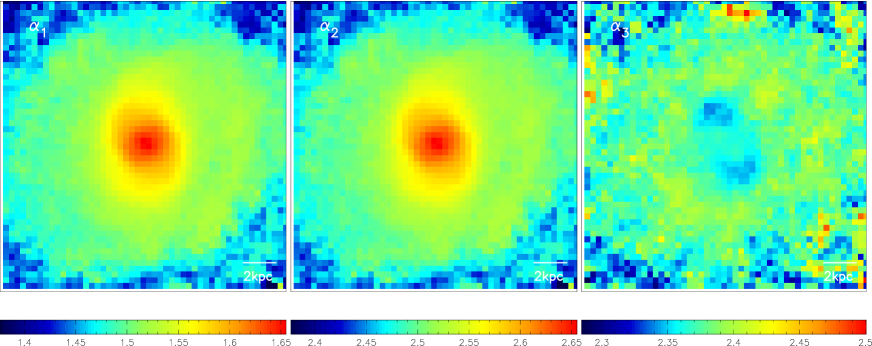
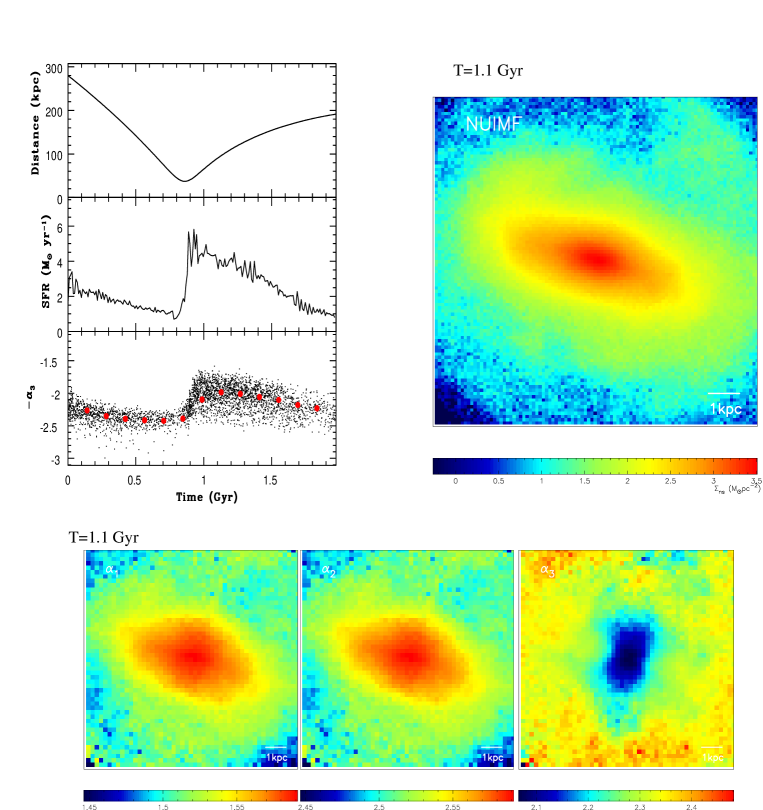
Fig. 2 shows the 2D distributions of the IMF slopes projected on the - plane after 2 Gyr evolution of the disk in the fiducial model. The star-forming regions of the disk galaxy is divided into cells and the mean IMF slopes for each cell are estimated from new stars within each cell in this figure. The and distributions clearly show radial gradients in the sense that the inner regions have steeper IMFs. This is simply a reflection of the initial negative metallicity gradient of the disk, because the radial metallicity gradient does not evolve so much in this model. The distribution, on the other hand, does not show a clear radial gradient, which reflects the fact that depends both on local densities and [Fe/H]. The high-mass end of the IMF is only slightly shallower (i.e., slightly more top-heavy) in the central barred region, which is due largely to the higher gas density of in the barred region. An intriguing feature in the distribution is a slightly shallower IMF slope in both edges of the barred region. Although the origin of this feature could be related to the formation of high-density regions in the edges of stellar bars, it is beyond the scope of this paper. We need to investigate this feature in a large number of simulated barred galaxies in our future studies in order to understand the origin of this clearly.
3.3 Different IMFs in different galaxies
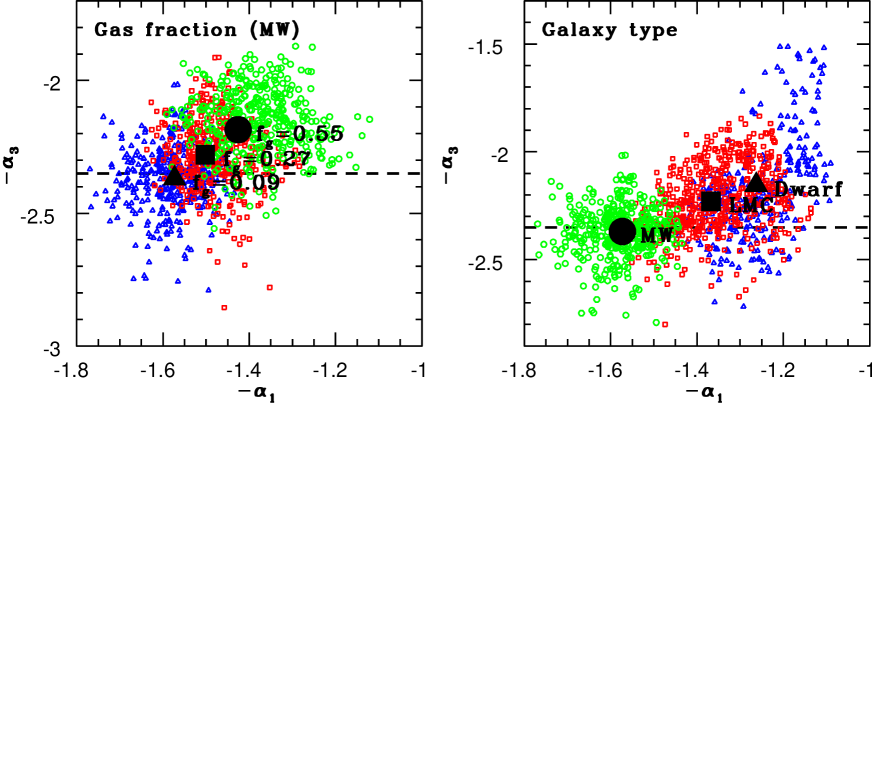
Fig. 3 shows the locations of individual star-forming regions on the plane for the MW models with different and for the models with different galaxy types (i.e., dwarf, LMC, and MW). In this figure, it is the decreasing [Fe/H] that moves points to the right in the -axis (see equation (14)). On the other hand, it is the gas density that moves points to the top in the -axis (equation (16); depends rather weakly on [Fe/H]). Since in the present study, the distributions of star-forming regions on the plane are essentially similar to those on the plane.
Clearly, more gas-rich MW models show smaller owing to the lower initial [Fe/H], as expected from the adopted NUIMF model. More strongly self-gravitating gas disks can cause the formation of clouds with higher densities so that can become smaller (i.e., more top-heavy) in more gas-rich MW models. This result implies that the high-mass end of the IMF can be more top-heavy in the high redshift universe where disk galaxies are likely to be more gas-rich. The gas-rich LMC and dwarf models can show smaller owing to the formation of high-density gas clouds, and these low-mass galaxies can also show smaller . These results imply that (i) low-mass disk galaxies can have top-heavy IMFs for the entire stellar mass ranges and thus (ii) the top-heavy IMFs could dramatically influence the early evolution of these galaxies. We will discuss more extensively how the IMF slopes depend on physical properties of galaxies in our forthcoming papers.
3.4 IMFs in interacting galaxies with starbursts
Although BM13 demonstrated, for the first time, that the high-mass end of the IMF can become top-heavy in starbursts triggered by galaxy interaction and merging, their simulations are not so fully self-consistent in the sense that (i) evolution is not included and (ii) IMF-dependent physical effects (e.g., SN feedback) are not properly implemented. The present model, which is an improved version of the model by BM13, enables us to discuss better whether the IMF can become top-heavy during starbursts in interacting and merging galaxies. Fig. 4 is a collection of plots on the evolution of the SFR and the IMF slope driven by galaxy interaction and the 2D distributions of new stars and the three IMF slopes for the tidal interaction model M4. Clearly, the high-mass end of the IMF can become more top-heavy during the strong starburst triggered by tidal interaction (i.e., after the pericenter passage). Because of rapid gas consumption by star formation during tidal interaction, the formation of high-density gas clouds can be suppressed after tidal interaction so that gradually becomes larger (i.e., less top-heavy). These are therefore consistent with our early results in BM13.
Fig. 4 also shows strong radial gradients of the three IMF slopes in the central 5.3 kpc at Gyr in the tidal interaction model. The IMF slopes and show strong negative gradients, which means that the IMF is more bottom-heavy in the central few kpc. The IMF slope , on the other hand, shows a positive radial gradient in the sense that the IMF is more top-heavy in the inner region. The strong radial gradient of combined with the weaker gradient in the isolated MW model (M1) means that galaxy interaction can steepen the IMF gradient. Furthermore, the central region with more top-heavy IMF in forms a bar-like structure with the major axis not aligned with the major axis of the bar shown in the 2D surface density map of new stars ().
This reflects the fact that a secondary bar can form from gas (transferred into the central region via gaseous dissipation) within the original bar (i.e., a ‘nested’ bar formation or ‘bar within bar’) and the new stars with ages typically younger than 100 Myr in the secondary bar, which are the youngest population of the interacting galaxy, have more top-heavy IMF. This misalignment between the major axis of the IMF distribution and that of the stellar bar is an unexpected result in the present study and thus worth a further investigation. We will discuss this misalignment more extensively in our future papers by using more models of galaxy interaction.
3.5 IMF self-regulation mechanism
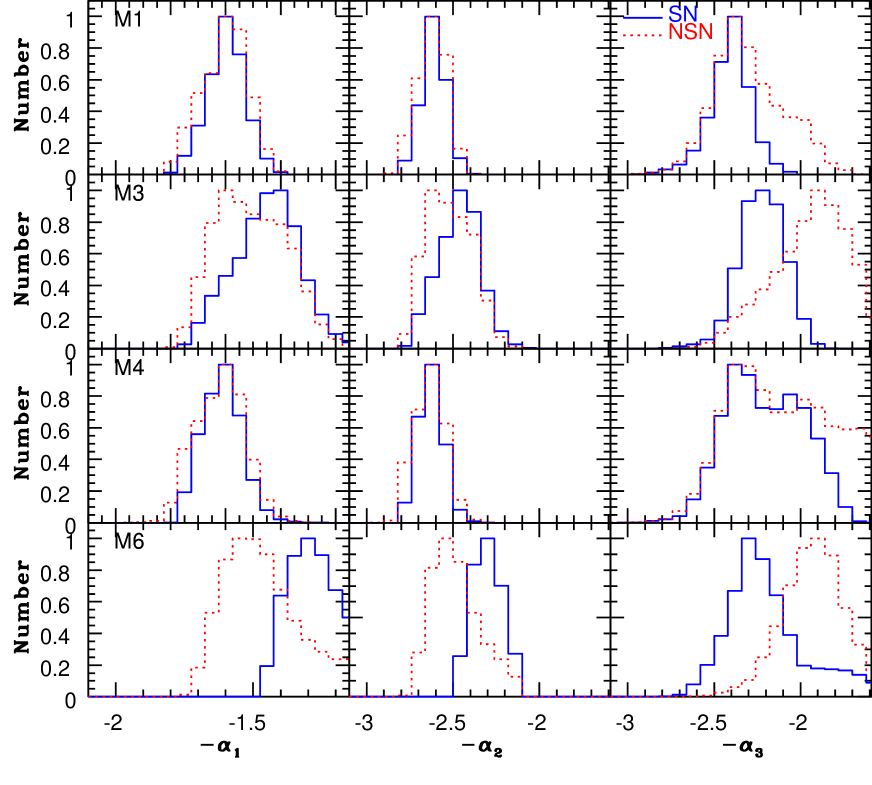
SNIa and SNII feedback effects are demonstrated to prevent the high-mass end of the IMF to become too top-heavy () in BM13. By using the present new model, we can confirm or rule out such a suppression effect of SNe. Fig. 5 shows the histograms of the four IMF slopes for the three MW models, M1 (fiducial), M2 (gas-rich) , M4 (tidal interaction), and M6 (low-mass dwarf) with SN feedback effects (referred to as ‘SN’ for convenience) or without (‘NSN’). Although the differences in the and histograms between the SN and NSN cases are not so remarkable in the gas-poor model M1 (isolated) and M4 (interaction), the histograms are clearly different between the two. For two MW models, a larger number of new stars can have top-heavy IMFs with in the NSN case. This more top-heavy IMFs for NSN can be more clearly seen in the gas-rich MW model M3: the location of the peaks in the distribution is significantly different between the model M3 with SN and NSN.
These results therefore confirm that SN feedback effects can prevent the high-mass end of the IMF to become too top heavy, because they can suppress the formation of high-density regions in galaxies. Here it should be noted that the suppression of the formation of high-density gas regions by SN feedback effects have been already pointed by a number of recent works (e.g., Bournaud et al. 2010; Shetty & Ostriker 2912, Hopkins et al. 2012; Lagos et al. 2012). It is worth mentioning that (and ) is systematically flatter in the gas-rich MW model M3 with SN in comparison with M3 with NSN. This is mainly because chemical enrichment, which can steepen the low-mass end of the IMF, is more strongly suppressed in the model with SN. This result implies that SN feedback effects can prevent the low-mass end of the IMF to become too bottom-heavy in star-forming galaxies with SN. These IMF self-regulation mechanisms found for the three MW models above can be seen also in the low-mass dwarf model (M6).
It should be noted here that SN feedback effects can be stronger during starbursts in the NUIMF model than in the UIMF one, because a larger number of SNe can be produced owing to the more top-heavy IMF in the NUIMF model. Therefore, SN feedback effects in the NUIMF model can more strongly suppress the formation of rather high-density gas clouds from which new stars with very top-heavy IMFs can be formed. Thus, a variable IMF can ‘self-regulate’ its evolution in the sense that SN feedback effects that are controlled by the IMF can prevent the IMF to become too top-heavy. This self-regulation mechanism should be very important in the chemical and dynamical evolution of starburst galaxies, where both chemical yield from massive stars and SN and the strength of SN feedback effects strongly depend on the IMF slopes.
4 Results
4.1 SFH
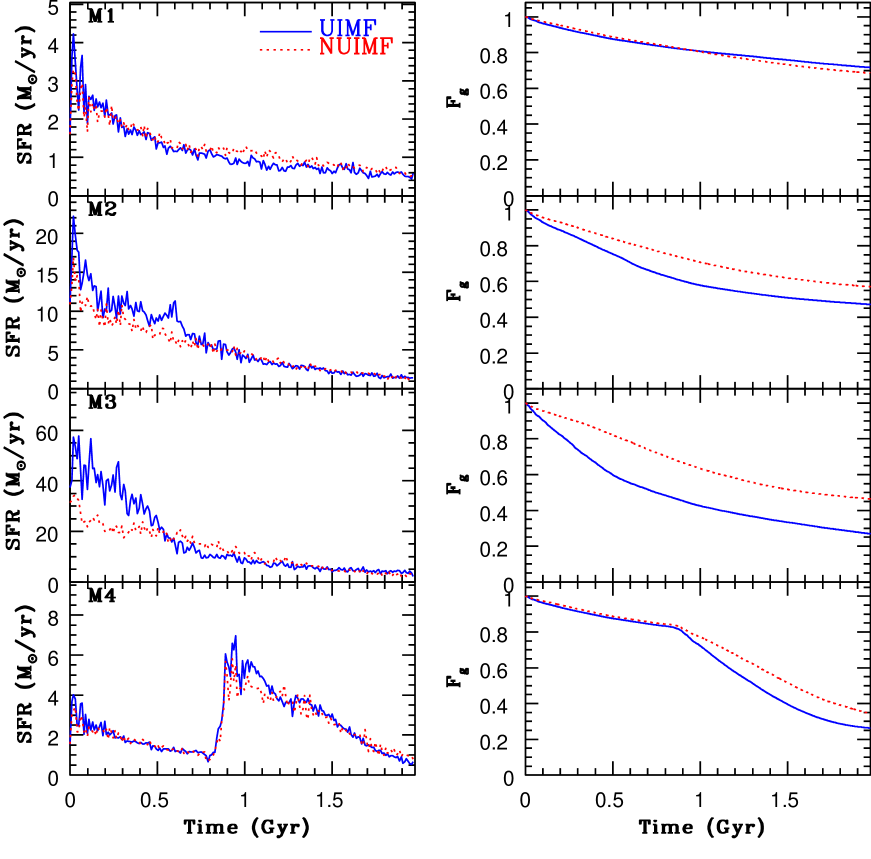
The left panel Fig. 6 shows the differences in the time evolution of SFRs between the four MW models (M1 - M4) with the UIMF and the NUIMF. Although there are no significant differences in the SFR evolution between the gas-poor MW model M1 with the UIMF and the NUIMF, the SFRs of the two gas-rich models (M2 with and M3 with ) at the early disk evolution phases ( Gyr) can be systematically higher for the UIMF. This is mainly because the IMF becomes more top-heavy in the early actively star-forming phases (‘starbursts’) so that SN feedback effects can more strongly suppress efficient star formation in the gas-rich models. Such stronger suppression of star formation for the NUIMF can be marginally seen in the starburst phase ( Gyr) of the gas-poor tidal interaction model M4.
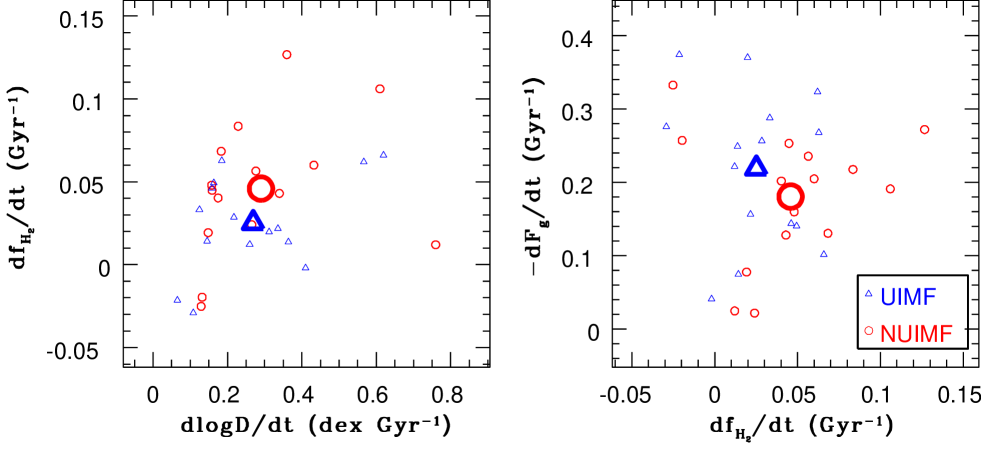
The right panel of Fig. 6 shows the time evolution of the normalized gas mass () for each of the four models. As a result of suppressed star formation, gas consumption in galactic disks can be significantly slowed down for the NUIMF. This can be quantified by using the following normalized quantity:
| (19) |
where is the total gas mass at each time step and . This normalized gas consumption rate () can be lower (i.e., gas being more slowly consumed by star formation) in the gas-rich disks with the NUIMF. For example, the mean () is 0.37 for the UIMF and 0.27 for the NUIMF in the model M3. This smaller can be clearly seen in the tidal interaction model with a secondary starburst (M4). These slowed down gas consumption is one of key effects of the NUIMF on galaxy evolution in the present study.
Fig. 7 shows the locations of star-forming regions in the four models (M1M4) on the plane, where is defined as follows:
| (20) |
Therefore, this figure describes the differences between the SFRs for the UIMF () and for the NUIMF () as a function of at all time steps in the four models. Although there is no clear trend in the relation for yr-1, is more likely to be larger for higher for yr-1 (i.e., star formation is more strongly suppressed in more actively star-forming regions for the NUIMF). This implies that previous simulations with the UIMF might have overestimated SFRs of actively star-forming galaxies (if the IMF is non-universal).
4.2 and
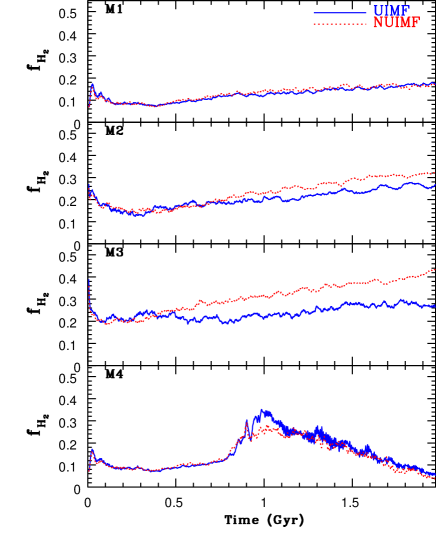
Figs. 8 and 9 show the time evolution of the mean and in the four MW models for the UIMF and the NUIMF. The fraction depends strongly on local properties of ISM (e.g., density and radiation field) that change more rapidly with time whereas is an integrated property. Therefore, the time evolution of in Fig. 9 appears to be smoother (i.e., much less violent change with time) than that of in Fig. 8. Owing to the initial high gas densities and high [Fe/H] in the central regions of gas disks, the mean can be higher in the very early phase of disk evolution ( Gyr). These high-density gaseous regions can be rapidly consumed by star formation so that can become smaller and start steady evolution ( Gyr). Chemical enrichment due to star formation can increase the chemical and dust abundances of the gas disks, and consequently, formation on dust grains can become more efficient. As a result of this, can slowly increase in the isolated MW models (M1-3). For the tidal interaction model (M4), can increase significantly during strong interaction owing to the formation of shocked high-density gaseous regions (along tidal arms). After rapid gas consumption during tidal interaction, can slowly decrease.
The evolution of depends on the evolution of dust content thus on whether the UIMF or the NUIMF is adopted. Although the differences in the evolution between the gas-poor model M1 with the UIMF and the NUIMF are not significant, can evolve more rapidly for the NUIMF in the gas-rich models M2 and M3. The final can therefore become higher for the NUIMF in the two models. The reason for these differences is that a larger amount of dust can be produced for the NUIMF owing to the more top-heavy IMF in these models with more active star formation: the larger amount of dust is responsible for more efficient formation. Although the overall evolution is not so different between the UIMF and the NUIMF, is appreciably higher in the UIMF model during the strong starburst phase ( Gyr). Weaker SN feedback effects in the UIMF model are responsible for the higher .
The differences in evolution between the UIMF and the NUIMF are more remarkable in the model with higher . Owing to the larger number of SNe and high-mass AGB stars formed for the NUIMF, a larger amount of dust can be produced and mixed with ISM in gas-rich galaxies for the NUIMF. Consequently, evolution can proceed more rapidly in the gas-rich models (M2 and M3) for the NUIMF. The final in these models with the NUIMF are dex higher than those in the models with the UIMF. Thus Figs. 8 and 9 clearly demonstrates that and can more rapidly increase in gas-rich, actively star-forming disk galaxies for the models with the NUIMF.
4.3 Chemical properties
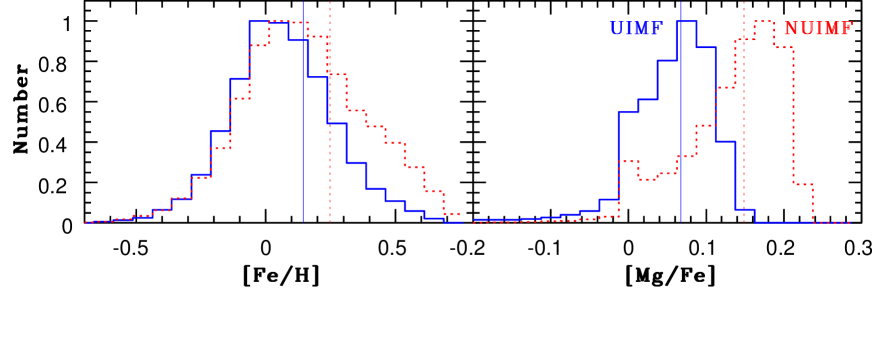
The influences of the NUIMF in chemical evolution can be more clearly seen in gas-rich, actively star-forming disk galaxies in the present study. Fig. 10 shows the final [Fe/H] and [Mg/Fe] distributions of new stars in the gas-rich model M3 for the UIMF and the NUIMF. Although the [Fe/H] distributions are not so dramatically different, both the mean [Mg/Fe] and the shape of the [Mg/Fe] distributions are clearly different between the two. The model with the NUIMF shows systematically higher [Mg/Fe] (by 0.08 dex) than the model with the UIMF, mainly because a larger number of SN II, which are the major contributers to the enrichment process of -elements in chemical evolution, can be produced in the model with the NUIMF owing to the more top-heavy IMF in the actively star-forming regions (more precisely, the number ratio of SN II to SN Ia is higher for the model with the NUIMF).
It should be stressed that the derived higher [Fe/H] and [Mg/Fe] are not due to slightly more efficient star formation at Gyr in the NUIMF. The gas-phase oxygen abundance () is already higher in the NUIMF () than in the UIMF (9.00) at Gyr when star formation rate is significantly higher in the UIMF. Furthermore, the dust-to-gas-ratio () is for the NUIMF and for the UIMF at Gyr, which means that the dust abundance in ISM can increase faster in the NUIMF even for the early evolution phase of the disk. This confirms that larger chemical yields due to the more top-heavy IMF in the NUIMF is responsible for the larger chemical abundances. These results in M3 can be seen in both isolated and tidal interaction models (See Appendix A for the tidal interaction model).
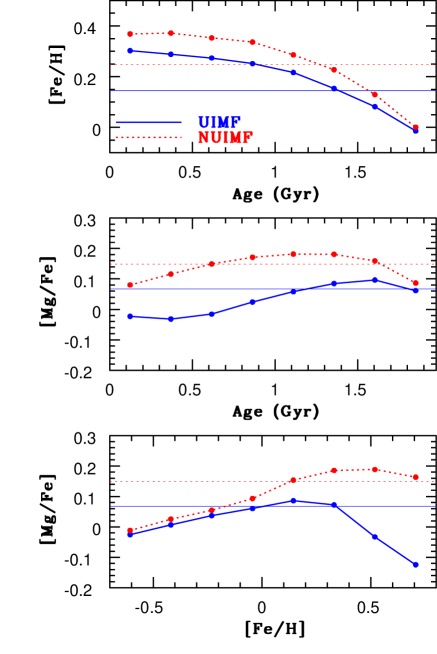
Fig. 11 shows that both [Fe/H] and [Mg/Fe] of new stars are higher for a given age in the gas-rich model M3 with the NUIMF owing to the more top-heavy IMF during active star formation. It should be noted that [Mg/Fe] can slowly decline and thus be kept high () even Gyr after the initial active star formation phase in the model with the NUIMF. This reflects the fact that chemical enrichment by SN Ia can only slowly decrease [Mg/Fe] in the model with the NUIMF. The [Mg/Fe]-[Fe/H] relations are also clearly different between the models with the UIMF and the NUIMF in the sense that [Mg/Fe] for high [Fe/H] () is remarkably higher in the model with the NUIMF. This clear difference in the [Mg/Fe]-[Fe/H] relation can be seen in most models in the present study.
As shown in Fig. 7, star formation can be more strongly suppressed in the model M3 with the NUIMF in the early evolution phase of the disk ( Gyr). Nevertheless, the chemical enrichment can proceed more efficiently for this model, as shown in Figs. 10 and 11. These results imply that although the NUIMF has both positive and negative feedback effects on chemical enrichment histories of galaxies, the positive effect (i.e., a larger amount of metals produced) is stronger than the negative one (i.e., a smaller number of stars formed). This has some important implications on galaxy formation, which are discussed later in this paper.
The above influences of the adopted NUIMF in chemical evolution of gas-rich galaxies can be seen even in gas-poor () galaxies, if they experience starbursts triggered by galaxy interaction. Fig. 12 shows that (i) the mean [Fe/H] and [Mg/Fe] of new stars are higher in the interaction model M4 with the NUIMF and (ii) double peaks can be seen in the [Mg/Fe] distribution only for the model with the NUIMF. The peak around [Mg/Fe] in the model with the NUIMF is due to the secondary starburst triggered by tidal interaction. Fig. 13 shows that young stellar populations with ages less than 1 Gyr have higher [Fe/H] and [Mg/Fe] in the model with the NUIMF in comparison with the model with the UIMF, as shown for the gas-rich M3 model. A clear difference in the [Mg/Fe]-[Fe/H] relation for metal-rich populations with [Fe/H] between the UIMF and the NUIMF can be seen in this tidal interaction model.
Radial gradients of [Fe/H] and [Mg/Fe] are significantly different between the starburst model M4 with the UIMF and the NUIMF. For example, the [Fe/H] gradients () are dex kpc-1 and dex kpc-1 for the UIMF and for the NUIMF, respectively, which means that the model with the NUIMF shows a steeper negative [Fe/H] gradient. The [Mg/Fe] gradients () in the central 12 kpc of stellar disk are dex kpc-1 and dex kpc-1 for the UIMF and for the NUIMF, respectively. These steeper negative gradients for the NUIMF are found in other models. For example, () is (, i.e., almost no gradient) dex kpc-1 for the UIMF and () dex kpc-1 for the NUIMF in the gas-rich MW model M3.
These results suggest that the NUIMF can play a role in the evolution of radial metallicity gradients of disk galaxies. However, the derived difference in radial [Fe/H] gradients between the UIMF and the NUIMF is not so large ( dex kpc-1) so that we can not determine which IMF is more consistent with the observed radial [Fe/H] gradients of galaxies (e.g., Cheng et al. 2012 for the MW). The derived and dex kpc-1 are both consistent with the observed value ranging from to for different (vertical distance) for the MW (e.g., Cheng et al. 2012), though the observed value is estimated for stars with different ages.
As shown in Figs. 11, new stars with high [Fe/H] () are more likely to have higher [Mg/Fe]. These new stars, which are formed with more top-heavy IMFs during starbursts with efficient chemical enrichment, have larger and owing to their high [Fe/H]. These result mean that new stars with higher [Mg/Fe] formed in starbursts in gas-rich galaxies are more likely to have bottom-heavy IMFs for lower stellar masses (). Furthermore, new stars with higher [Fe/H] can have more bottom-heavy IMFs for (). These results are consistent with previous and recent observations (e.g., Cenarro et al. 2003; Conroy & van Dokkum 2012), though the present study did not specifically investigate the formation of early-type galaxies.
4.4 Dynamical properties
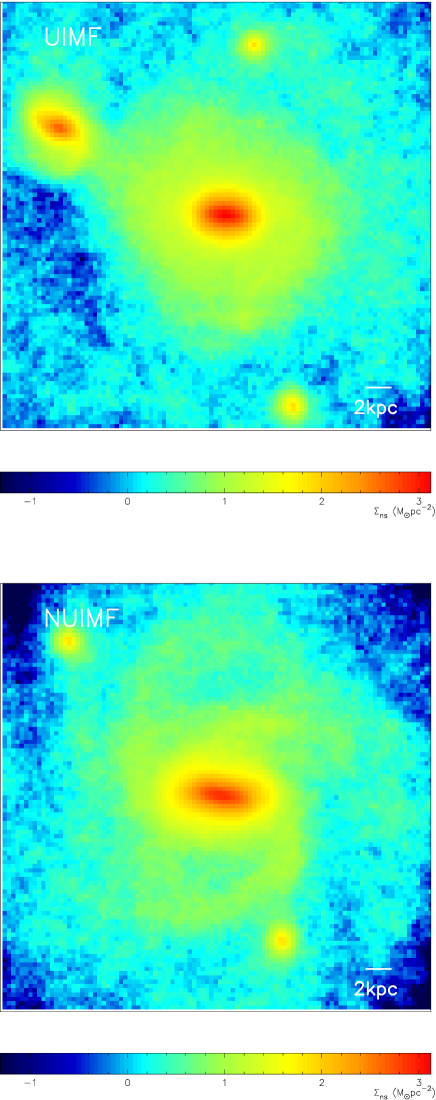
In the preceding subsections, SN explosions, the number of which depends on the IMF, are demonstrated to be a key physical process that can cause possible differences in SFHs and chemical evolution of galaxies between models with the UIMF and the NUIMF. It is possible that dynamical evolution of galaxies, which can be significantly influenced by SN feedback effects, can be different between models with the UIMF and the NUIMF owing to the different numbers of SNIa and SNII between the two IMFs. Fig. 12 shows that the distributions of new stars projected onto the - plane appears to be different in the following three points between the gas-rich model M3 with the UIMF and the NUIMF. First, more massive stellar clumps with higher mass densities can be formed during the disk evolution in the model with the UIMF. Second, spiral-arm-like structures can be more clearly seen in the model with the NUIMF. Third, the stellar bar within the central 2 kpc appears to be longer and thinner in the model with the NUIMF.
Massive gaseous clumps can quickly form from local gravitational instability of gas disks in the gas-rich models of the present study. They can finally become compact and bound stellar clumps owing to efficient star formation within gas clouds. These clumps can suppress the formation of non-axisymmetric structure such as spiral arms and bars in gas-rich disks and more massive clumps can have the stronger suppression effects (e.g., Shlosman & Noguchi 1993). SN feedback effects during star formation of the clumps can expel the gas in the clumps so that it can prevent the clumps from becoming too compact and strongly self-gravitating. The high-density gas clumps in the model with the NUIMF can have more top-heavy IMFs, and accordingly the SN feedback effects can more strongly suppress the formation of compact stellar clumps. As a result of this, less massive clumps can form and therefore less strongly influence the formation of spiral arms and bars in the model with the NUIMF.
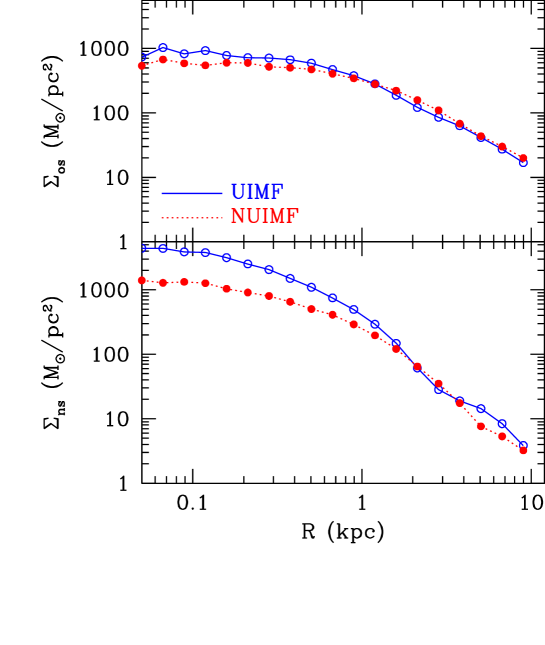
More massive stellar clumps can more rapidly sink into the central regions of stellar disks through dynamical friction against the disk field stars so that they can increase the total masses of galactic bulges and stellar nuclei (e.g., Noguchi 1999; Bekki 2010). The more effective mass-transfer to the inner regions of disks galaxies through clump evolution can therefore change significantly the inner structure of the disks. Fig. 13 shows that the projected mass densities of new stars () can be systematically higher for the central 1 kpc in the gas-rich model M3 with the UIMF. This is mainly because more massive clumps can be transferred to the inner region owing to more efficient dynamical friction in the model with the UIMF. Interestingly, the projected mass density of old stars () in the model with the UIMF is slightly higher, which reflects the fact that the massive clumps transferred to the central region contain old stars at the formation of the clumps.
Previous simulations showed that massive stellar clumps developed in gas-rich disks can dynamically heat up the stellar disks and can cause the formation of thick stellar disks (e.g., Noguchi 1999). The vertical velocity dispersion () for old stars with kpc (i.e., including stars in the thick disk) in the model M3 is 49.7 km s-1 for the UIMF and 43.1 km s-1 for the NUIMF. The larger for the UIMF is due to the more effective scattering of old stars by massive stellar clumps in the model with the UIMF. This difference can be found in other models: for example, is 23.0 km s-1 for the UIMF and 19.4 km s-1 for the NUIMF in the gas-rich LMC model (M5). These results imply that a NUIMF can possibly influence the time evolution of kinematical properties of gas-rich disk galaxies.
| Galaxy properties | Physical effects of the NUIMF 101010This is based on the comparison between the models with the UIMF and the NUIMF. For example, ‘higher ’ means that is higher in the NUIMF model than in the UIMF one. | Implications |
|---|---|---|
| Star formation | Less enhanced SF in starburst phases of galaxies | Slower evolution of gas content |
| Molecular hydrogen | More rapid evolution of , larger final | Larger in disks with higher mass densities |
| Dust | More rapid evolution of , higher final | Higher in disks with higher mass densities |
| Chemical abundances | Higher [Mg/Fe], steeper metallicity gradients | Higher [Mg/Fe] in poststarburst populations of E+As |
| Dynamical properties | Stronger suppression of clump formation | Prevention of bulge growth via clump merging |
4.5 Parameter dependences
The fundamental influences of the adopted NUIMF on galaxy evolution are briefly summarized as follows: (i) suppressing SFRs, (ii) accelerating and evolution, (iii) increasing [Fe/H] and [Mg/Fe] more rapidly, and (iv) preventing the formation of massive stellar clumps. These four influences can be furthermore closely related to the evolution of the distribution of SF regions, age-metallicity relations, radial density profiles, and stellar kinematics in disk galaxies. This galaxy evolution influenced by the NUIMF is clearly shown for all models and briefly summarized with some implications of the results in Table 3. The differences in the evolution rates of physical properties between the simulated galaxies with the UIMF and the NUIMF are briefly discussed in Appendix A.
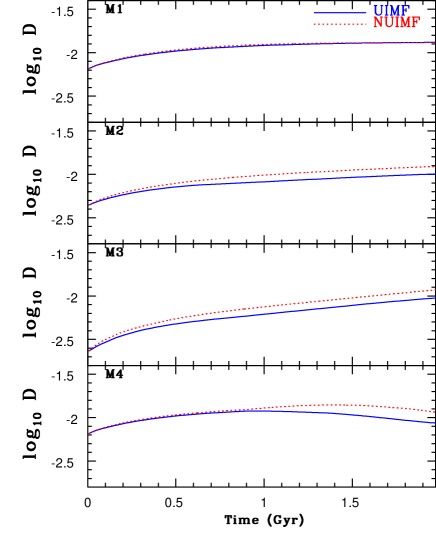
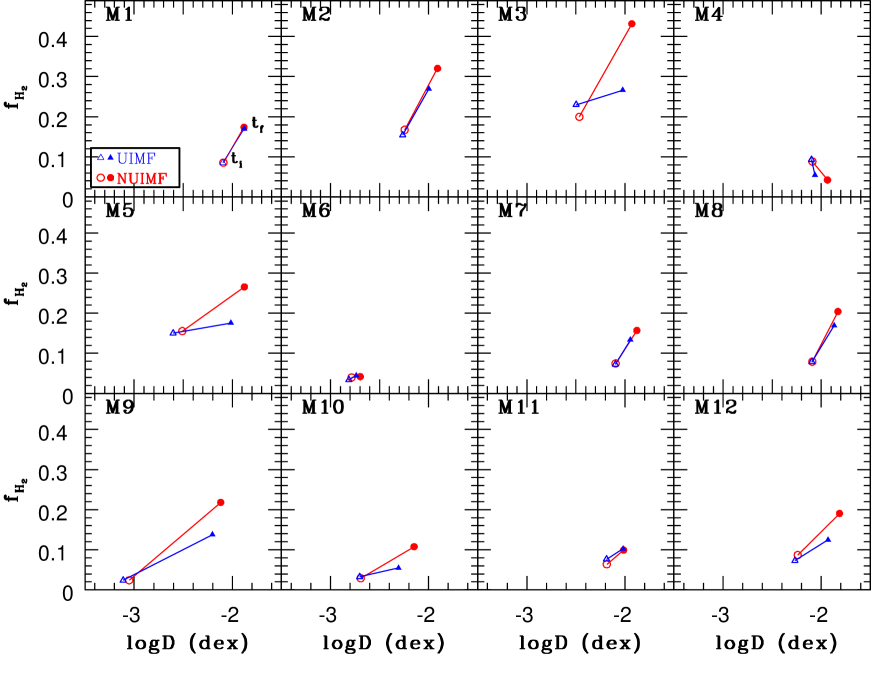
The differences in the evolution of and between galaxies with the UIMF and the NUIMF are shown in Fig. 14 for each of selected key 12 models. In this Fig. 14, and at two time steps ( and ) are connected to show more clearly their evolution. Since rapidly changes in the early evolution phases of disks, Gyr is chosen (when can start evolving steadily). represents the final time step in each model. As shown in preceding sections, some interesting results are found by comparing the MW models (M1-M4) with the UIMF and the NUIMF, and it is confirmed that such results can be clearly seen in other models (M6M15) with the UIMF and the NUIMF. Therefore, we briefly describe only significant results that are worth mentioning for these models below. For the better construction of this paper, figures on the results of some of these models (M6M15) are shown in the Appendix A.
4.5.1 Low-mass disks
The influences of the adopted NUIMF on galaxy evolution in the low-mass disk models (LMC and dwarf models, M5, M6, M12, and M13) are essentially the same as those found for the MW models (M1-M3). However, chemical evolution of gas-rich disks appear to be more different between the low-mass disk models with the UIMF and the NUIMF. For example, the location of the peak in the [Fe/H] distribution for the gas-rich LMC model M5 can be clearly different between the UIMF and the NUIMF whereas the [Fe/H] peak location for the gas-rich MW model M3 is not so clear (See Appendix A). In these low-mass disk models, clump formation can be severely suppressed by SN feedback effect both for the UIMF and the NUIMF so that dynamical evolution is not so remarkably different between the models with the UIMF and the NUIMF.
4.5.2 Bulgeless and big bulge
An intriguing result for the bulgeless model M7 () is that the high-mass end of the IMF () becomes more top-heavy after the formation of a stellar bar through bar instability in the stellar disk. This is because a larger amount of gas can be transferred to the central region of the disk through dynamical influences of the bar on the gas disk so that high-density gaseous regions can be formed in the central region. This result implies that barred galaxies can have more top-heavy IMFs, in particular, in their central regions. Such significant IMF evolution can not be seen in the big bulge model M8, where the massive bulge can stabilize the stellar disk.
4.5.3 Higher
Models with (M9) and 136.8 (M10) correspond to the earlier phase of the MW formation when the disk is still growing by gas accretion and thus have a lower total mass (i.e., larger mass fraction of dark halo). Significant differences in chemical evolution for Gyr between the MW models with the UIMF and the NUIMF are found for M1M3. In order to confirm whether this is true for the long-term evolution ( Gyr) of the MW models, we investigate the early MW models M9 and M10 with the UIMF and the NUIMF for Gyr. It is clear that (i) [Fe/H] and [Mg/Fe] distributions in the model M9 with the UIMF and the NUIMF are significantly different between the UIMF and the NUIMF and (ii) [Mg/Fe] differences between the two IMFs are more significant for higher [Fe/H] (See Appendix A). These differences between the two IMFs are found in M10 (and other models) too, which means a NUIMF can be imprinted on the metallicity distribution functions of galaxies. The larger value of (=0.09) for the binary fraction of stars that can become SNe Ia is adopted in the present study so that the very metal-rich stars after long-term chemical enrichment can have lower [Mg/Fe] ().
4.5.4 LSB
A significant difference between the standard MW model M3 and the LSB model M11 is that is systematically larger (i.e., steeper IMF) in the LSB model. The mean is 2.44, which is 0.07 larger than that for the standard MW model. Furthermore, some minor fraction of new stars in the LSB model show (but less than 3.2), which is not seen in other models. This result implies that (i) the IMF in LSB disk galaxies can be bottom-heavy and thus (ii) their chemical evolution can more slowly proceed owing to the less amount of metals produced in massive stars. The final and are lower in the LSB model in comparison with other MW models with higher mass densities. Given that the IMF is more bottom-heavy in the LSB model, this result means that and are likely to be higher in disk galaxies with higher mass-densities.
4.5.5 Interacting galaxies
A larger amount of gas can be transferred to the central regions of interacting galaxies to form high-density gas clouds for the tidal interaction models with larger . Therefore, during starbursts triggered by tidal interaction is smaller (i.e., more top-heavy) in M14 with than in M1 with and M15 with . There is a positive correlation between SFRs and during starburst in these interaction models with starbursts (i.e., more top-heavy in stronger starbursts).

5 Discussion
5.1 Accelerated or deaccelerated galaxy evolution by the NUIMF ?
As summarized in Table 3, the present study has shown, for the first time, that the time evolution of galaxy properties can be accelerated or deaccelerated by the NUIMF. Star formation in actively star-forming galaxies can be suppressed by a larger number of SN explosions caused by a more top-heavy IMF in denser gas clouds for the NUIMF. The gas consumption in these star-forming galaxies can be therefore slowed down for the NUIMF. However, a larger amount of dust and metals can be produced by the more top-heavy IMF so that chemical evolution can more rapidly proceed: the larger chemical yields can have stronger influences on galactic chemical evolution than the lower SFR for the NUIMF. Furthermore, dust production by SNe and AGB stars can become slightly more efficient for the more top-heavy IMF. As a result of this, the formation efficiency of can increase for the NUIMF.
These positive and negative feedback effects of the NUIMF have not been included in previous simulations of galaxy formation. Therefore, the formation processes of galaxies could be significantly changed in numerical simulations of galaxy formation based on a CDM cosmology, if the feedback effects of the NUIMF are properly included in the simulations. A possible significant effect of the NUIMF on galaxy formation is that final metallicities of galaxies formed with strong starbursts can be systematically higher in galaxy formation models with the NUIMF than in those with the UIMF (owing to the more top-heavy IMFs in starburst phases). We plan to investigate whether and how the NUIMF can possibly influence galaxy formation in detail by using more sophisticated simulations with realistic initial conditions of galaxy formation based on a CDM cosmology.
5.2 Consistency with observations
The present simulations do not start from initial conditions of galaxy formation so that we can not discuss whether the observed properties of galaxies (e.g., color-magnitude relation etc) can be reproduced by models with the NUIMF in a self-consistent manner. For example, in order to discuss the color-magnitude (or mass-metallicity) relation of galaxies, we need to know initial age and metallicity distributions of old stars, which are parameters in the present study. The consistency between the observed properties depending on ages and metallicities of stars and the simulated ones will need to be done by our future simulations of galaxy formation that can predict physical properties of stars with different ages and metallicities. However, we can discuss whether the abundance of gas and dust in simulated disk galaxies can be consistent with the observed ones or not, because their evolution does not depend so strongly on the adopted assumptions of initial ages and metallicities of old stars.
Fig. 15 shows that the simulated correlation between total gas mass () and dust mass () is roughly consistent with the observed one by Corbelli et al. (2012). However, the simulated relation is slightly steeper than the observed one and it appears to deviate significantly from the observed one for lower (). It should be noted here that observations do not have data points for (i.e., the observational line in Fig. 15 is just an extension of the derived for galaxies with higher in Corbelli et al. (2012). This apparent deviation can be seen in our previous models with the UIMF (Bekki 2013), which means that this is not caused by for the NUIMF. If the observed relation () is confirmed for , then it would possibly mean that the present dust model rather than the IMF model would need to be improved for better consistency with observations. These results imply that the NUIMF does not have a serious problem (e.g., over-production of dust) in reproducing the observed gas and dust properties in galaxies.
5.3 Search for chemical signatures of top-heavy IMFs in poststarburst galaxies
BM13 have demonstrated that the high-mass end of the IMF () can become more top-heavy in interacting and merging galaxies with strong starbursts owing to the formation of high-density gas clouds. The present study, which incorporates a NUIMF model in galaxy-scale chemodynamical simulations more self-consistently, has confirmed the result by BM13. These simulation results are consistent with recent observational results which have shown more top-heavy IMFs in galaxies with clear signs of past tidal interaction (e.g., Habergham et al. 2010). Other theoretical studies already suggested a necessity of top-heavy IMFs in explaining a number of observational properties of galaxies (e.g., Elmegreen 2009 for a review). Although many observational studies tried to determine whether the IMF is top-heavy or not in nearby starburst galaxies, they have not made a robust conclusion on the possible top-heavy IMF. For example, it has been controversial even for the nearby starburst galaxy, M82, whether observed physical properties of M82 are consistent with top-heavy IMFs (e.g., Rieke et al. 1980; Smith & Gallagher 2001) or with canonical ones (e.g., Devereux 1989; Satyapal 1997).
The present study has shown that [Mg/Fe] distributions and [Mg/Fe]-[Fe/H] relations of new stars can be significantly different between starburst disk galaxies with the UIMF and the NUIMF: [Mg/Fe] is significantly higher in the models with the NUIMF, in particular, for the metal-rich stars. In the present models with the NUIMF, the central starburst components can have more top-heavy IMFs and thus have higher [Mg/Fe] (). On the other hand, [Mg/Fe] can be at most in the models with the UIMF. The mean values of [Mg/Fe] in starburst galaxies can not become so high (), firstly because the IMF can not become too top-heavy owing to the IMF self-regulation mechanism, and secondly because the prompt SN Ia can more rapidly lower [Mg/Fe] in the present models. These results imply that a way to find possible evidence of the top-heavy IMF in starbursts is to investigate [Mg/Fe] in the central metal-rich poststarburst components in the ‘E+A’ (or ‘K+A’) galaxies. If [Mg/Fe] is as high as 0.2 in the central region of E+As, then such a moderately high [Mg/Fe] is more consistently explained by starbursts with top-heavy IMFs.
A growing number of recent spectroscopic observations of E+As have investigated spatial distributions of poststarburst components in E+As. (e.g., Pracy et al. 2005, 2012, 2013; Yagi et al. 2006; Goto et al. 2008; Swinbank et al. 2012). Some of these have revealed the strong radial gradients of Balmer absorption lines in E+As and demonstrated that the observed gradients are consistent with the predicted radial gradient from previous simulations of E+A formation (e.g., Bekki et al. 2001; 2005). They have therefore suggested that at least some E+As were formed as a result of major galaxy merging with strong central starbursts. Given that these spectroscopic observations can investigate the radial gradients of [Mg/Fe] in E+As, they will be able to confirm or rule out the present of poststarburst populations with moderately high [Mg/Fe] () in the central regions of E+As. As shown in BM13 and the present study, the IMF can be more top-heavy in the inner region than in the outer ones for starburst galaxies. This implies that [Mg/Fe] should be higher in the inner regions of E+As, which should be equally possible for future spectroscopic observations to detect.
5.4 Bulge formation influenced by a NUIMF
The present study has clearly shown that dynamical evolution of gas-rich disk galaxies through the formation of massive gaseous and stellar clumps can be influenced by a NUIMF. This is mainly because more effective SN feedback effects for a NUIMF can suppress more severely the formation of high-density clumps that can be transferred to the central regions of disk galaxies through dynamical friction. This result has the following implications on the formation of galactic bulges, given that many previous theoretical and observational studies investigated the formation of galactic bulges through merging of massive clumps in the central regions of galaxies (e.g., Noguchi 1999; Elmegreen et al. 2008, 2009; Inoue & Saitoh 2012). First, previous simulations using a SN feedback model with a fixed canonical IMF can significantly overestimate the total masses of the simulated bulges formed as a result of clump merging, because they can underestimate the suppression of clump formation by SN feedback effects.
Second, such previous simulations underestimate the mean [Fe/H] and [Mg/Fe] in the metallicity distribution functions of the simulated bulges. This might be true for galaxy bulges formed from major merging in previous simulations with a fixed canonical IMF. Third, disk thickening by scattering of field stars by infalling clumps can be overestimated in previous simulations with a fixed canonical IMF. These strongly suggest that the formation of galactic bulge by clump merging need to be reinvestigated by numerical simulations with a NUIMF, if the IMF is really non-universal. Bulge formation through clump merging/accretion is one of key issues in secular evolution of disk galaxies. The present study suggests that a NUIMF can play a role in other aspects of secular evolution of disk galaxies (e.g., radial migration and formation and disappearance of spiral arms).
5.5 Advantages and disadvantages of the NUIMF model
The NUIMF model adopted in BM13 and the present study can naturally explain and the correlation between SFR densities and the IMF slope () observed by M09 and G11 (BM13). It also enables us to predict the IMF variation in different galaxies and its influences on galaxy evolution in a self-consistent manner. Furthermore it can predict how the IMF slopes depend on chemical abundances of galaxies such as [Mg/Fe]. One of key predictions from the present chemodynamical simulations is that (and ) can be larger (i.e., more bottom-heavy) for metal-rich stars with higher [Mg/Fe]. Although this prediction can be closely related to recent observational results on the correlation of the IMF slope with [Mg/Fe] in elliptical galaxies (e.g., Conroy & van Dokkum 2012), the possible dependences of the low-mass end of the IMF on [Mg/Fe] will be more extensively discussed in the context of elliptical galaxy formation in our future papers.
However, it has the following three possible disadvantages in explaining the observed possible IMF variation in galaxies. First, the present chemodynamical simulations can not show star-forming regions with , which is observationally suggested for galaxies with low surface mass densities in M09 (see Fig. 10 in M09). This is mainly because star formation can not occur where mean densities of ISM are low (thus can possibly become large) in the present SF model with a threshold gas density for star formation.
Second, the present models suggest that low-mass dwarf galaxies can have more top-heavy IMFs owing to their lower [Fe/H], which appears to be inconsistent with recent chemical evolution models for dwarfs in the Local Group (e.g., Tsujimoto 2011) which can explain the observed abundance patterns for a canonical IMF with a truncated upper-mass limit (i.e., less top-heavy). Third, physical origins for the dependences of the three IMF slopes on [Fe/H] and properties are not so clearly understood, though the adopted NUIMF model (M12) is constructed by using observational data sets that can give constraints on the IMF dependences.
These three possible disadvantages of the NUIMF adopted in the present study suggest that our future chemodynamical models need to (i) adopt more sophisticated SF recipes to explain the IMF slopes for star-forming regions in LSBs and (ii) discuss whether or not dwarf galaxy formation with the NUIMF can really explain the observed abundance patterns of dwarfs (it could be possible that the observations can be explained even by the NUIMF). Also it is our future study to understand whether and why the three IMF slopes (rather than the characteristic mass of an IMF with a fixed slope) can change according to physical properties of star-forming clouds.
6 Conclusions
We have investigated self-consistently (i) the time evolution
of the three IMF slopes (, , and )
of the Kroupa IMF and (ii) the influences of the IMF evolution
on galaxy evolution using our new chemodynamical simulations
with a universal Kroupa IMF (UIMF)
and a non-universal Kroupa IMF(NUIMF). We have adopted the NUIMF model
by M12 and thereby investigated the differences in galaxy evolution
between the UIMF and the NUIMF. The principle results are as follows:
(1) The time evolution of SFRs in galaxies can be significantly different
between the present chemodynamical models
of disk galaxies with the UIMF and the NUIMF. For example, SFRs in gas-rich
disks () can be lower in the models with the NUIMF than in
those with the UIMF and the differences (SFR) are roughly proportional
to SFRs. In the models with the NUIMF, the high-mass end of the IMF
can become more top-heavy (i.e., becomes smaller) owing to
the development of high-density molecular gas clouds so that
SN feedback effects can be stronger.
As a result of this, SFRs can be more severely suppressed by
SN feedback effects in the models with the NUIMF.
(2) Chemical evolution in actively star-forming
disk galaxies proceeds more rapidly in the models with the NUIMF than in
those with
the UIMF one, mainly because a larger amount of metals and dust can be produced
in the models with the NUIMF.
As a results of this, the final [Fe/H] and [Mg/Fe]
can be by dex higher in the models with the NUIMF, and
[Mg/Fe] for a given metallicity can be also higher in the models with the NUIMF.
Radial metallicity gradients of [Fe/H] and [Mg/Fe] are steeper in
the models with NUIMF.
Also metallicity distribution functions (MDFs),
age-metallicity relations (AMRs),
and [Mg/Fe]-[Fe/H] relations are different between the models
with the UIMF and the NUIMF.
New stars formed during active star formation with significant chemical
enrichment can have higher [Mg/Fe] and steeper and ,
which means that stars with higher [Mg/Fe] can have bottom-heavy IMFs.
(3) The time evolution of can be slightly different between
the models with the UIMF and the NUIMF in that in gas-rich disks
() can be higher in the models with the NUIMF. This is mainly
because dust production, which is a key factor for formation
in the present simulations, is more efficient in the models with the NUIMF.
The evolution of is more rapid in the models with the NUIMF so that
the final in star-forming disks
can be appreciably higher in the NUIMF model.
Thus, although
and can be slightly higher in the gas-rich models with the NUIMF,
SFR can be lower in the models owing to the stronger SN feedback effects.
(4) Formation of massive stellar clumps in gas-rich
disks () can be more severely
suppressed by SN feedback effects in the models with the
NUIMF model, because a larger number
of SN Ia and II can be produced in the models. As a result of this,
massive stellar clumps can less strongly influence the dynamical evolution of
disks. The vertical velocity dispersions of old stellar disks can be
(by a factor of %) lower
in the models with the NUIMF owing to weaker dynamical heating of the disks by massive
stellar clumps. The total masses of new stars in the central 1 kpc of disks
can be larger in the models with the NUIMF.
(5) The projected radial density profiles of new stars in the central
1 kpc of gas-rich () disk galaxies can be shallower
in the models with the NUIMF. This is mainly because inward transfer of gas
through (i) infall of massive clumps due to dynamical friction and
(ii) dynamical action of stellar bars and spirals is more severely
suppressed by SN feedback effects in the models with the NUIMF. Given that
previous bulge formation models through infall of massive stellar clumps
assumed a standard UIMF, the present results imply that the previous
models might have overestimated the bulge growth through infall of massive
stellar clumps.
(6) The high-mass end of the IMF () can become smaller (i.e., more
top-heavy) in actively star-forming gas-rich () disk galaxies
and interacting galaxies in the models with the NUIMF.
However, the IMF can not become
too top-heavy (), because SN feedback effects become
more efficient during the top-IMF phase so that the formation of
very high-density molecular clouds, for which can be rather small,
can be more severely suppressed.
This IMF self-regulation mechanism (or ‘IMF feedback’)
is very important for the evolution of starburst galaxies
and might make the IMFs of galaxies less variable.
(7) The present study predicts that IMF slopes can be different
between galaxies with different physical properties
(e.g., gas mass fractions and total masses) and between different
local star-forming regions in a same galaxy.
For example, barred disk galaxies are more likely to have more top-heavy
IMFs in the central bar regions in comparison with non-barred ones.
Also, interacting disk galaxies are likely to have more top-heavy IMFs
in their central regions in comparison with isolated disk galaxies.
We will discuss the IMF dependences on galaxy properties
more extensively in our future papers.
We have mainly discussed the possible influences of a NUIMF on the evolution of SFRs, structural and kinematical properties, chemical abundances, , and in star-forming disk galaxies with or without galaxy interaction. However, we have not clearly demonstrated that only the NUIMF model can explain some of the observed properties of galaxies. In our forthcoming papers, we plan to demonstrate which physical properties of galaxies can be better reproduced by the NUIMF than by the UIMF.
7 Acknowledgment
I (Kenji Bekki; KB) am grateful to the referee for constructive and useful comments that improved this paper. Numerical simulations reported here were carried out on the three GPU clusters, Pleiades, Fornax,and gSTAR kindly made available by International Centre for radio astronomy research (ICRAR) at The University of Western Australia, iVEC, and the Center for Astrophysics and Supercomputing in the Swinburne University, respectively. This research was supported by resources awarded under the Astronomy Australia Ltd’s ASTAC scheme on Swinburne with support from the Australian government. gSTAR is funded by Swinburne and the Australian Government’s Education Investment Fund. KB acknowledges the financial support of the Australian Research Council throughout the course of this work.
References
- (1) Andrievsky, S. M., Luck, R. E., Martin, P., Lépine, J. R. D., 2004, A&A, 413, 159
- (2) Bastian, N., Covey, K. R., Meyer, M. R., 2010, ARA&A, 48, 339
- (3) Baugh, C. M., et al., 2005, MNRAS, 356, 1191
- (4) Bekki, K., 2009, MNRAS, 399, 2221
- (5) Bekki, K., 2010, MNRAS, 401, 2753
- (6) Bekki, K., 2012, MNRAS, 412, 2241
- (7) Bekki, K., 2013, MNRAS, 432, 2298 (B13)
- (8) Bekki, K., Shioya, Y., Couch, W. J., 2001, ApJL, 547, 17
- (9) Bekki, K., Couch, W. J., Shioya, Y., Vazdekis, A., 2005, MNRAS, 359, 949
- (10) Bekki, K., Tsujimoto, T., 2012, ApJ, 761, 180
- (11) Bekki, K., Shigeyama, T., Tsujimoto, T., 2013, MNRAS, 428, L31
- (12) Bekki, K., Meurer, G. R., 2013, ApJL, 765, 22 (BM13)
- (13) Binney, J. & Tremaine, S. 2007, Galactic Dynamics, 2nd ed., ed. J. P. Ostriker & D. Spergel (Princeton, NJ: Princeton Univ. Press) 124
- (14) Bournaud, F., Elmegreen, B. G., Teyssier, R., Block, D. L., Puerari, I., 2010, MNRAS, 409, 1088
- (15) Cappellari, M. et al. 2012, Nature, 484, 485
- (16) Cenarro, A. J., Gorgas, J., Vazdekis, A., Cardiel, N., & Peletier, R. F. 2003, MNRAS, 339, L12
- (17) Cheng, J. Y., et al. 2012, ApJ, 752, 51
- (18) Conroy, C., van Dokkum, P. G., 2012, ApJ, 760, 71
- (19) Corbelli, E., 2012, A&A, 542, 32
- (20) Davé, R. 2008, MNRAS, 385, 147
- (21) Davé, R., Katz, N., Oppenheimer, B. D., Kollmeier, J. A., Weinberg, D. H., 2013, preprint (axXiv1302.3631)
- (22) Decressin, T., Baumgardt, H., Charbonnel, C., & Kroupa, P. 2010, A&, 516, 73
- (23) Devereux, N. A., 1989, 346, 126
- (24) Duffy, A. R., Kay, S. T., Battye, R. A., Booth, C. M., Dalla Vecchia, C., Schaye, J., 2012, MNRAS, 420, 2799
- (25) Dutton, A. A., et al., 2011, MNRAS¡ 417, 1621
- (26) Dwek, E., 1998, ApJ, 501, 643 (D98)
- (27) Elmegreen, B. G., 2004, MNRAS, 354, 367
- (28) Elmegreen, B. G. 2009, in The Evolving ISM in the Milky Way and Nearby Galaxies, Edited by K. Sheth, A. Noriega-Crespo, J. Ingalls, and R. Paladini.
- (29) Elmegreen, B. G., Bournaud, F., Elmegreen, D. M., 2008, ApJ, 688, 67
- (30) Elmegreen, B. G., Elmegreen, D. M., Fernandez, M. X., Lemonias, J. J., 2009, ApJ, 692, 12
- (31) Ferreras, I., La Barbera, F., de la Rosa, I. G., Vazdekis, A., de Carvalho, R. R., Falcón-Barroso, J., & Ricciardelli, E. 2012, MNRAS in press
- (32) Fu, J., Guo, Q., Kauffmann, G., Krumholz, M. R., 2010, MNRAS, 409, 515
- (33) Geha, M., et al., 2013, ApJ, 771, 29
- (34) Goto, T., Yagi, M., Yamauchi, C., 2008, MNRAS, 391, 700
- (35) Gunawardhana, M. L. P., et al. 2011, MNRAS, 415, 1647 (G11)
- (36) Habergham, S. M., Anderson, J. P., James, P. A., 2010, ApJ, 717, 342
- (37) Hirashita, H., 1999, ApJ, 522, 220
- (38) Hopkins, P. F.; Keres, D., Murray, N., Quataert, E., Hernquist, L., 2012, MNRAS, 427, 968
- (39) Hoversten, E. A., & Glazebrook, K. 2008, ApJ, 675, 163
- (40) Inoue, S., Saitoh, T. R., 2012, MNRAS, 422, 1902
- (41) Lagos, C. P., Lacey, C. G., Baugh, C. M., 2012, in prepring (arXiv1210.4974)
- (42) Kalberla, P. M. W., Kerp, J., 2009, ARA&A, 47, 27
- (43) Kennicutt, R. C., Jr., 1998, ApJ, 498, 541
- (44) Kroupa, P., Weidner, C., Pflamm-Altenburg, J., Thies, I., Dabringhausen, J., Marks, M., & Maschberger, T. 2011, preprint (arXiv1112.3340).
- (45) Kroupa, P., 2001, MNRAS, 322, 231
- (46) Krumholz, M. R., McKee, Ch. F., Tumlinson, J., 2009, ApJ, 699, 850
- (47) Larson, R. B., 1981, MNRAS, 194, 809
- (48) Larson, R. B., 1998, MNRAS, 301, 569
- (49) Larson, R. B., 2005, MNRAS, 359, 211
- (50) Lisenfeld, U., Ferrara, A., 1998, ApJ, 498, 145
- (51) Marks, M., & Kroupa, P. 2010, MNRAS, 406, 2010
- (52) Marks, M., Kroupa, P., Dabringhausen, J., & Pawlowski, M. S. 2012, MNRAS, 422, 2246 (M12)
- (53) Mckee, C. F., 1989, in IAU Symp. 135, Interstellar Dust, Edited by Louis J. Allamandola and A. G. G. M. Tielens, p431
- (54) Meurer, G. R., et al. 2009, ApJ, 695, 765 (M09)
- (55) Nagashima, M., Lacey, C. G., Okamoto, T., Baugh, C. M., Frenk, C. S., & Cole, S. 2005, MNRAS, 363, L31
- (56) Narayanan, D., & Davé, R. 2012, MNRAS, 3601, 3615
- (57) Navarro, J. F., Frenk, C. S., & White, S. D. M. 1996, ApJ, 462, 563 (NFW)
- (58) Neto A. F. et al., 2007, MNRAS, 381, 1450
- (59) Noguchi, M., 1999, ApJ, 514, 77
- (60) Pipino, A., & Matteucci, F. 2004, MNRAS, 347, 968
- (61) Pracy, M. B., Couch, W. J., Blake, C., Bekki, K., Harrison, C., Colless, M., Kuntschner, H., de Propris, R., 2005, MNRAS, 359, 1421
- (62) Pracy, M. B., Owers, M. S., Couch, W. J., Kuntschner, H., Bekki, K., Briggs, F., Lah, P., Zwaan, M., 2012, MNRAS, 420, 2232
- (63) Pracy, M. B., Croom, S., Sadler, E., Couch, W. J., Kuntschner, H., Bekki, K, Owers, M. S., Zwaan, M., Turner, J., Bergmann, M., 2013, MNRAS in press (arXiv1305.3669)
- (64) Rieke, G. H., Lebofsky, M. J., Thompson, R. I., Low, F. J., Tokunaga, A. T., 1980, ApJ, 238, 24
- (65) Rosen, A., Bregman, J. N., 1995, ApJ, 440, 634
- (66) Shlosman, Isaac; Noguchi, M., 1993, ApJ, 414, 474
- (67) Smith, L. J., Gallagher, J. S., 2001, MNRAS, 326, 1027
- (68) Satyapal, S., Watson, D. M., Pipher, J. L., Forrest, W. J., Greenhouse, M. A., Smith, H. A., Fischer, J., Woodward, C. E., 1997, ApJ, 483, 148
- (69) Shetty, R., Ostriker, E. C., 2012, ApJ, 754, 720
- (70) Sutherland, R. S., Dopita, M. A., 1993, ApJS, 88, 253
- (71) Swinbank, A. M., Balogh, M. L., Bower, R. G., Zabludoff, A. I., Lucey, J. R., McGee, S. L., Miller, C. J., Nichol, R. C., 2012, MNRAS, 2012, 420, 672
- (72) Thornton, K., Gaudlitz, M., Janka, H.-Th., Steinmetz, M., 1998, ApJ, 500, 95
- (73) Treu, T., Auger, M. W., Koopmans, L. V. E., Gavazzi, R., Marshall, P. J., & Bolton, A. S. 2010, ApJ, 709, 1195
- (74) Tsujimoto, T., 2011, ApJ, 736, 113
- (75) Tsujimoto, T., Nomoto, K., Yoshii, Y., Hashimoto, M., Yanagida, S., Thielemann, F.-K., 1995, MNRAS, 277, 945 (T95)
- (76) van den Hoek, L. B.; Groenewegen, M. A. T., 1997, A&AS, 123, 305 (VG97)
- (77) van Dokkum, P. G. 2008, ApJ, 674, 29
- (78) van Dokkum, P. G., & Conroy, C. 2012 ApJ, 760, 70
- (79) Wolfire, M. G., McKee, C. F., Hollenbach, D., Tielens, A. G. G. M., 2003, ApJ, 587, 278
- (80) Yagi, M., Goto, T., Hattori, T., 2006, ApJ, 642, 152
Appendix A Some results of selected models and evolution rates of all models
In this Appendix A, we describe some interesting results of selected models and discuss the ‘evolution rate’ of , , and gas contents in the models with the UIMF and NUIMF.
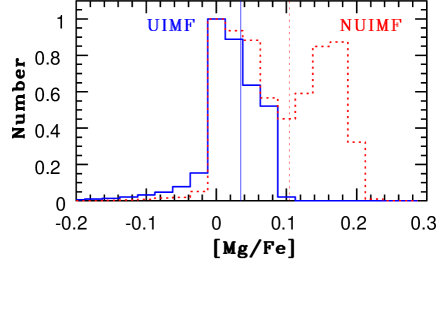
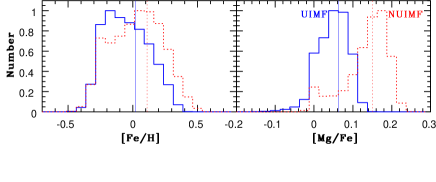
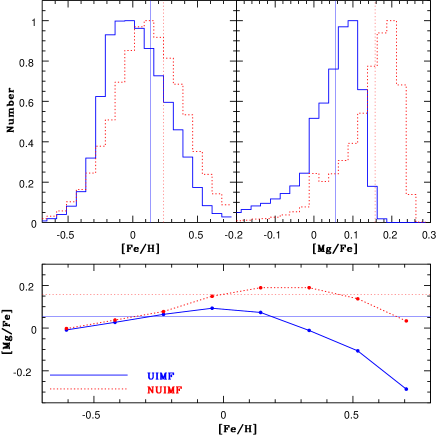
| Physical quantity | UIMF | NUIMF |
|---|---|---|
| (dex Gyr-1) | ||
| (Gyr-1) | ||
| (Gyr-1) | ||
| (dex Gyr-1) |
A.1 M4
The influences of the adopted NUIMF in chemical evolution of gas-rich galaxies derived in the gas-rich MW models (M2 and M3) can be seen even in gas-poor () galaxies, if they experience starbursts triggered by galaxy interaction. Fig. A1 shows that double peaks can be seen in the [Mg/Fe] distribution only for the model with the NUIMF. The peak around [Mg/Fe] in the model with the NUIMF is due to the secondary starburst triggered by tidal interaction.
A.2 M5
The influences of the NUIMF on the final [Fe/H] and [Mg/Fe] distributions derived in the MW models can be clearly seen in the low-mass disk models. Fig. A2 clearly shows that the mean [Fe/H] and [Mg/Fe] can be higher in the gas-rich LMC model (M5). These higher [Fe/H] and [Mg/Fe] for the NUIMF can be seen in other low-mass disk models of the present study.
A.3 M10
It is confirmed that the influences of the NUIMF of the final [Fe/H] and [Mg/Fe] distributions and age-metallicity relations does not depend on the baryonic mass fractions of galaxies. For example, Fig. A3 for the MW model with a smaller baryonic fraction (M10) shows that (i) the final [Fe/H] and [Mg/Fe] are higher for the NUIMF and (ii) [Mg/Fe] for a given [Fe/H] is higher for [Fe/H]. These results imply that the NUIMF is important for the very early chemical evolution of galactic disks.
A.4 Evolution rate
In Fig. A4, the evolution rate of a physical quantity (e.g., and ) is defined as follows:
| (21) |
where and are time at the initial and final time step used for the estimation of a simulation, respectively. The mean evolution rate for each physical quantity is estimated by making an average for 15 models and the value is listed both for the UIMF and the NUIMF in Table A1. This table clearly shows how the evolution of , , and can be different between the UIMF and the NUIMF.
For and , the evolution rates do not depend so strongly on (e.g., whether it is 1 Gyr or 2Gyr). Therefore, Gyr and Gyr are chosen for and . Owing to more violent changes of in the early evolution phases of gas disks, Gyr rather than Gyr can better estimate the evolution rate for . Therefore, Gyr and Gyr are chosen for in most models. For the dwarf model (M6) with the UIMF and the NUIMF, Gyr and Gyr, because the evolution rate of can be better estimated for such and owing to an intriguing behavior (more violent changes with time) in the later evolution of . The joint evolution of , , and in dwarf galaxies need to be more extensively investigated in a separate paper.