DUST PROPERTIES OF LOCAL DUST-OBSCURED GALAXIES WITH THE SUBMILLIMETER ARRAY
Abstract
We report Submillimeter Array (SMA) observations of the 880 m dust continuum emission for four dust-obscured galaxies (DOGs) in the local universe. Two DOGs are clearly detected with (880 m) mJy and , but the other two are not detected with 3 upper limits of (880 m) mJy. Including an additional two local DOGs with submillimeter data from the literature, we determine the dust masses and temperatures for six local DOGs. The infrared luminosities and dust masses for these DOGs are in the range and , respectively. The dust temperatures derived from a two-component modified blackbody function are K and K for the cold and warm dust components, respectively. Comparison of local DOGs with other infrared luminous galaxies with submillimeter detections shows that the dust temperatures and masses do not differ significantly among these objects. Thus, as argued previously, local DOGs are not a distinctive population among dusty galaxies, but simply represent the high-end tail of the dust obscuration distribution.
Subject headings:
galaxies: active – galaxies: evolution – galaxies: formation – galaxies: starburst – infrared: galaxies – submillimeter: galaxies1. INTRODUCTION
Recent studies suggest that the cosmic star formation density peaks around , and then decreases by an order of magnitude towards (e.g., Magnelli et al. 2013; Behroozi et al. 2013). Interestingly, over the last 11 billion years, this cosmic star formation density is dominated by infrared luminous galaxies rather than ultraviolet (UV) luminous galaxies (Takeuchi et al., 2005; Reddy et al., 2008, 2012; Bouwens et al., 2010; Heinis et al., 2013; Burgarella et al., 2013). Therefore, studying high- dusty galaxies is critical for understanding the change in the star formation activity of galaxies with cosmic time (Elbaz et al., 2011; Lutz et al., 2011; Oliver et al., 2012).
Among many methods for identifying high- dusty galaxies, a simple optical/mid-infrared color criterion with () (mag in Vega, or (24 m)/()) is very efficient in selecting star-forming galaxies with large dust obscuration: dust-obscured galaxies (DOGs, Dey et al. 2008; Fiore et al. 2008; Penner et al. 2012; Hwang et al. 2012).
These DOGs seem responsible for 10–30% of the total star formation rate density of the universe at (Calanog et al., 2013). These objects are divided into two groups depending on the shape of their spectral energy distributions (SEDs) at rest-frame near- and mid-infrared wavelengths: “bump” and “power-law” DOGs (Dey et al., 2008). The SEDs of bump DOGs show a rest-frame 1.6 m stellar bump, resulting from the minimum opacity of the H- ion in the atmospheres of cool stars (John, 1988). In contrast, the power-law DOGs have a rising continuum with weak polycyclic aromatic hydrocarbon (PAH) emission, probably resulting from the hot dust component heated by active galactic nucleus (AGN) (Houck et al., 2005; Desai et al., 2009).
Numerical simulations suggest that the DOGs are a diverse population ranging from intense gas-rich galaxy mergers to secularly evolving star-forming disk galaxies (Narayanan et al., 2010). However, because of their extreme distances, it is difficult to fully understand the nature of these extremely dusty galaxies.
To study the physical properties of DOGs in detail (e.g., morphology, SED, dust mass and temperature), we focus on the rare local analogs of DOGs discovered recently (Hwang & Geller 2013, hereafter HG13). Thanks to their proximity and the wealth of multiwavelength data, the local DOGs are a useful testbed for studying what makes a DOG a DOG and for improving the understanding of the nature of their high- siblings.
Using the Wide-field Infrared Survey Explorer (WISE; Wright et al. 2010) and Galaxy Evolution Explorer (GALEX; Martin et al. 2005) data, we identified 47 DOGs at with large flux density ratios between mid-infrared (WISE 12 m) and near-UV (GALEX 0.22 m) bands111We first used AKARI 9 m and GALEX NUV data, roughly equivalent to the -band (0.65 m) and Spitzer 24 m data originally used for selecting DOGs (Dey et al., 2008). We then used WISE 12 m data instead of AKARI 9 m to increase the sample size (see HG13 for details). [i.e., (12 m)/(0.22 m)] in the Sloan Digital Sky Survey (SDSS, York et al. 2000) data release 7 (DR7, Abazajian et al. 2009). The observational data for local and high- DOGs suggest a common underlying physical origin of the two populations; both seem to represent the high-end tail of the dust obscuration distribution resulting from various physical mechanisms rather than a unique phase of galaxy evolution (HG13).
| IDaafootnotemark: | SDSS ObjID (DR9) | R.A.2000 | Decl.2000 | z | UT Date | Other Name | ||
|---|---|---|---|---|---|---|---|---|
| (mJy) | (mJy) | |||||||
| LDOG-07 | 1237674462024106294 | 09:04:01.02 | 01:27:29.12 | 0.0534 | 2013 Feb 12 | 12.5 | 1.4 | |
| LDOG-26 | 1237667209992732748 | 12:21:34.35 | 28:49:00.12 | 0.0613 | 2013 Feb 12 | 10.2 | 2.0 | |
| LDOG-39 | 1237648705135051235 | 15:26:37.67 | 00:35:33.50 | 0.0507 | 2013 Apr 1 | 4.8 | … | CGCG 021-096 |
| LODG-41 | 1237662663216070833 | 15:51:53.04 | 27:14:33.65 | 0.0589 | 2013 Apr 1 | 8.9 | … | |
| LDOG-08 | 1237674460413690092 | 09:07:46.91 | 00:34:30.55 | 0.0534 | … | … | … | |
| LDOG-35 | 1237665430243704865 | 14:07:00.39 | 28:27:14.67 | 0.0770 | … | … | … | MRK 668 |
The current multiwavelength data for local DOGs mostly cover only m from the Infrared Astronomical Satellite (IRAS; Neugebauer et al. 1984); there are only five DOGs with AKARI 140 m data (Murakami et al., 2007). There are no useful data on the ‘Rayleigh-Jeans’ side of the infrared SED peak; these data are essential for deriving dust temperatures and dust masses for these galaxies (Hwang et al., 2010; Dale et al., 2012; Symeonidis et al., 2013). Quantifying the dust properties is important because the combination of dust and stellar properties gives better constraints on the nature of these heavily obscured galaxies. We can also directly compare these quantities with model predictions (Narayanan et al., 2010). The comparison of these local DOGs with other dusty galaxies can establish a possible evolutionary link among them.
We thus conducted Submillimeter Array (SMA; Ho et al. 2004) observations of the 880 m continuum emission for four bright local DOGs to derive the physical parameters of their dust content. We report the results from this pilot survey. Section 2 describes the sample and the details of the SMA observations and data reduction. We derive the physical parameters of the dust content in local DOGs, and compare them with other submillimeter detected, infrared luminous galaxies in Section 3. We discuss and summarize the results in Section 4. Throughout, we adopt flat CDM cosmological parameters: km s-1 Mpc-1, and .
2. DATA
2.1. Sample
HG13 identified 47 local DOGs with (12 m) 20 mJy at in the SDSS DR7. These DOGs have extreme flux density ratios between mid-infrared and UV bands with (12 m)/(0.22 m) . The infrared luminosities of the DOGs are in the range with a median of (). These infrared luminosities are based on an SED fit to the photometric data at 6 m m with the SED templates and fitting routine of Mullaney et al. (2011), DECOMPIR222http://sites.google.com/site/decompir. From these SED fits, we computed the expected 880 m flux densities for the 47 DOGs, and selected the four DOGs with the largest, predicted flux densities at 880 m for SMA observation (see the target list in Table 1).
2.2. Observations and Data Reduction
Four local DOGs were observed in the compact configuration (8–70 m baselines) of the 8–element Submillimeter Array (SMA; Ho et al. 2004) interferometer at Mauna Kea, Hawaii in early 2013 (see Table 1 for an observing journal). The SMA dual-sideband receivers were tuned to a local oscillator (LO) frequency of 342 GHz (877 m), and the correlator was configured to process GHz (intermediate frequency) IF bands per sideband centered 4–8 GHz from the LO, divided into 48 spectral “chunks” that each contained 64 individual 1.6875 MHz channels. In each track, observations of two target DOGs were interleaved with nearby quasars on a 15 minute cycle. Additional observations of 3C 84, 3C 279, Uranus, and Titan were made for calibration purposes when the science targets were at low elevations. Observing conditions were good, with precipitable water vapor levels at 1.5–2.0 mm and stable phase behavior.
The raw visibilities were reduced with the MIR software package. The bandpass response was calibrated with observations of 3C 84 and 3C 279, and the antenna-based complex gains were determined by frequent observations of a nearby quasar: 0854+201 for LDOG-07, J1310+323 for LDOG-26, J1635+381 for LDOG-39, and L1549+026 for LDOG-41. The absolute amplitude scale was set based on observations of Uranus and Titan, and should have a systematic uncertainty of 10% or less. After calibration, the individual spectral channels for each sideband and IF band were combined into a composite wideband continuum visibility set. Those data were then Fourier inverted assuming natural weighting, deconvolved with the CLEAN algorithm, and then restored with a synthesized beam (with a FWHM of roughly ). The imaging and deconvolution procedures were conducted with the MIRIAD software package.
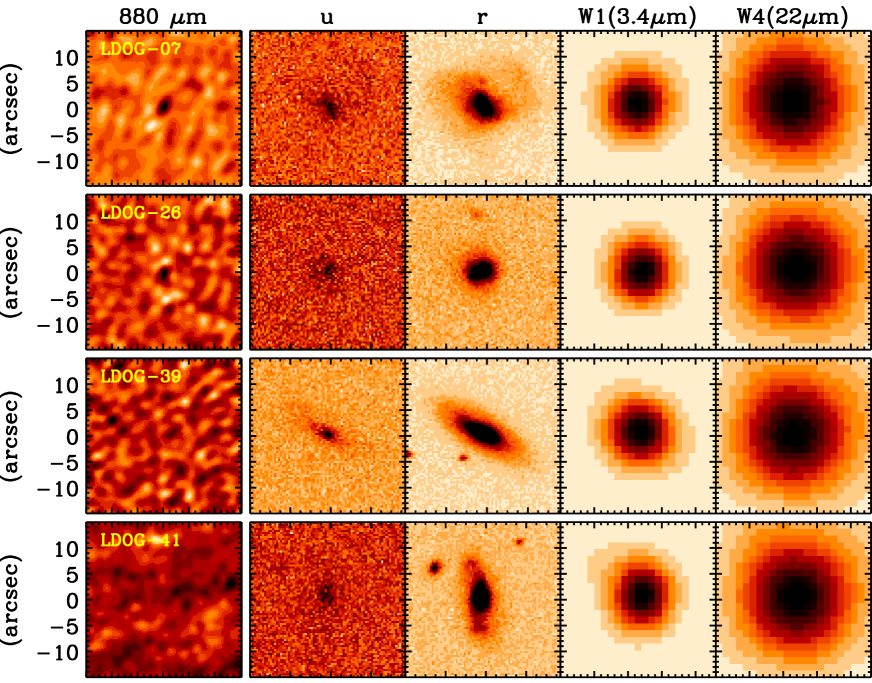
We show the resulting 880 m continuum aperture synthesis images for the four local DOG targets in Figure 1; we also show SDSS and WISE 3.4/22 m cutout images. None of the DOGs are resolved in the 880 m synthesis images. The SMA synthesis maps for two DOGs in the top panels (LDOG07 and LDOG25) show clear detections with (880 m) mJy and . However, the other two DOGs in the bottom panels (LDOG39 and LDOG41) are not visible in the synthesis maps. They are are not detected with 3 upper limits of (880 m) mJy. We list the four target DOGs in Table 1 with the SMA observation log and the measured 880 m flux densities.
3. RESULTS
3.1. Determination of Physical Parameters of Dust Content in Local DOGs
We first compute the infrared luminosities of the DOGs using the SED templates and fitting routine of Mullaney et al. (2011). This routine decomposes the observed SED of a galaxy into two components (i.e., a host-galaxy and an AGN). Therefore, we can also measure the contribution of (buried) AGN to the total infrared luminosity of a galaxy. This method is the same as in HG13, but we have additional submillimeter data to constrain the fit.
The SED fit with the Mullaney et al. (2011) routine does not provide the dust temperatures and masses for the galaxies. We thus fit the observational data again using a modified blackbody function with two (warm and cold) dust components (Dunne & Eales, 2001; Vlahakis et al., 2005; Willmer et al., 2009):
| (1) |
where and are the relative contributions of warm and cold dust components, and are dust temperatures, (,) is the Planck function, and is the dust emissivity index. We examined two values of (i.e., 1.5 and 2.0), and found that generally provides better fits. Therefore, we use for the fit, consistent with Vlahakis et al. (2005) and Willmer et al. (2009).
We then compute the dust mass from the observed flux density (Hildebrand, 1983), defined by
| (2) | |||||

where is the dust mass opacity coefficient, is the luminosity distance, and is the observed flux density333Note that if we use derived from equation (1) instead of the observed flux density, equation (2) can be simply expressed as / . with . We adopt cm2 g-1 at 850 m from Draine (2003). We use at 850 m rather than at 880 m to be consistent with the comparison sample of galaxies (see Section 3.2.1). Note that the value is usually very uncertain; it can change by a factor of 2 (e.g., cm2 g-1 in James et al. 2002). Therefore, the resulting dust mass can also change depending on the value adopted. For , we use the flux densities expected from the modified blackbody fit at 850(1+) m.
We use the photometric data at m m for both SED fits. We also compile the far-infrared/submillimeter data in the literature, and include them for the fit (e.g., Herschel 100–500 m data for LDOG07 from the H-ATLAS program; Rigby et al. 2011; Pilbratt et al. 2010).
| ID | LIR | ||||
|---|---|---|---|---|---|
| (L⊙) | (K) | (K) | (M⊙) | ||
| LDOG-07 | 4.39 0.02 | 62.9 1.4 | 26.6 0.1 | 24.53 0.38 | 287 |
| LDOG-26 | 2.50 0.05 | 59.2 2.0 | 26.0 1.1 | 13.49 2.46 | 89 |
| LDOG-39 | 2.14 | 124.4 25.3 | 33.6 | 1.91 | 2592 |
| LDOG-41 | 2.67 | 82.1 22.3 | 30.9 | 7.34 | 1590 |
| LDOG-08 | 1.19 0.01 | 60.7 1.3 | 25.2 0.3 | 7.85 0.26 | 197 |
| LDOG-35 | 4.90 0.23 | 83.4 36.6 | 23.3 5.9 | 21.4114.72 | 660 |
Figure 2 shows the photometric data for the DOGs along with the best-fit SEDs for infrared luminosities (left panels) and for dust temperatures and masses (right panels). The SEDs for two DOGs in the middle panels (e–h) are not well constrained because the SMA flux densities are upper limits, not used for the SED fit. We thus flag the derived quantities for these DOGs with lower and upper limits depending on parameters in the following Figures and Tables.
Table 2 lists the infrared luminosities, dust temperatures of the warm and cold components, total dust masses, and dust mass ratios between warm and cold components of the four DOGs. We compute the uncertainty in each parameter by randomly selecting flux densities at each band within the associated error distribution (assumed to be Gaussian) and then refitting.
We compiled the far-infrared/submillimeter data in the literature, and found two more DOGs with existing submillimeter data. LDOG08 in Figure 2(i–j) has Herschel 100500 m data from the H-ATLAS program (Rigby et al., 2011), and LDOG35 in Figure 2(k–l) has SCUBA 850 m data from Antón et al. (2004). We show these two DOGs in Figure 2 and Table 2, and include in our analysis.
3.2. Comparison of Dust Content between Local DOGs and Infrared Luminous Galaxies with Submillimeter Detection
To see whether the local DOGs with submillimeter detection are a population distinct from other submillimeter detected, infrared luminous galaxies, we compare the dust parameters between the two populations. Because of the small number of local DOGs with submillimeter data and because of the inhomogenous selection criteria for submillimeter detected, infrared luminous galaxies (see next Section), we simply examine their relative distribution in several parameter spaces.
3.2.1 Local Infrared Luminous Galaxies with Submillimeter Detection
Among many studies based on submillimeter observations of local galaxies (e.g., Willmer et al. 2009; Clements et al. 2010; Dale et al. 2012), we select a comparison sample including only the galaxies with infrared luminosities similar to the local DOGs (i.e., ) and with submillimeter data at m.
We first use the galaxies in the SCUBA local universe galaxy survey (SLUGS; Dunne et al. 2000; Dunne & Eales 2001). Among 104 galaxies with SCUBA 850 m data in the survey, we select 63 galaxies at with available mid- and far-infrared data. The lower redshift limit removes very nearby, extended galaxies that could be resolved in the mid-infrared. For 48 out of 63 galaxies, we use WISE, IRAS, and AKARI data at 3.4–160 m from the SDSS galaxy catalog with multiwavelength data compiled in HG13. For the remaining 15 galaxies, we adopt the mid- and far-infrared data from the Great Observatories All-sky LIRG Survey (GOALS; Armus et al. 2009); Spitzer and IRAS data at 3.6–160 m in U et al. (2012). There could be some potential DOG candidates in this GOALS sample, not covered in HG13 (i.e., SDSS). We do identify eight potential DOG candidates with in the GOALS sample, and do not include them in the comparison sample444 Note that the GALEX 0.22 m and Spitzer 8 m data are exactly equivalent to the -band (0.65 m) and Spitzer 24 m data originally used for selecting DOGs (Dey et al., 2008).. We do not include them in the DOG sample either, because the selection criteria (e.g., observed bands, mid-infrared flux density limits) are not exactly the same as HG13.
We also use the luminous infrared galaxies with SMA 880 m data in Wilson et al. (2008). Among 15 galaxies in the paper, we include seven systems that do not overlap with the SLUGS sample and that do not have two distinct interacting galaxies. Their mid- and far-infrared flux densities are again adopted from HG13 (six galaxies) and GOALS (one galaxy).
In summary, there are 62 galaxies with submillimeter, mid- and far-infrared data at for comparison with the local DOGs. We apply the same SED fitting routines of Section 3.1 to these galaxies to derive physical parameters including infrared luminosity, dust mass and temperature.
Using this sample, we first confirm that our measurements agree well with previous measurements: the dust masses in Dunne et al. (2000), Dunne & Eales (2001) and Willmer et al. (2009), and the dust temperatures in Willmer et al. (2009). Moreover, we note that there are recent sophisticated models that provide several dust parameters simultaneously from the SED fit (e.g., Draine & Li 2007; da Cunha et al. 2008; see also Walcher et al. 2011 for a review). Because of the small number of bands in the far-infrared/submillimeter regimes for the DOGs, we restrict our analysis to simple models (e.g., two-component modified blackbody function) rather than sophisticated ones that require many observational data points. Our simple approach works well. For example, the dust masses derived in this study for the galaxies in Willmer et al. (2009) show excellent agreement with those based on the Draine & Li (2007) models.
We apply the same fitting routine both to local DOGs and to other infrared luminous galaxies with submillimeter detections. Thus, the comparison between the two suffers no bias resulting from different SED fitting methods.
3.2.2 Comparisons of Dust Temperature and Mass
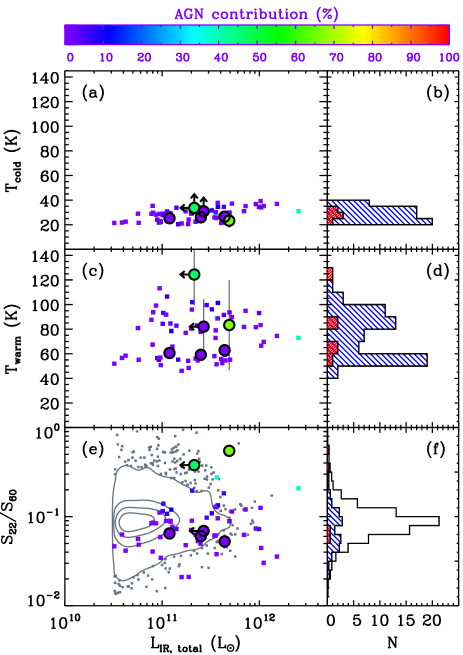
Figure 3 displays several parameters related to the dust temperature as a function of total infrared luminosity. The top panels show the temperature of the cold dust component. The cold dust temperature is in a very narrow range both for DOGs (circles) and for other infrared luminous galaxies (squares). Remarkably, does not change much with infrared luminosity.
The temperature of the warm dust component, , in the middle panel also does not depend on infrared luminosity, consistent with previous studies (Dunne & Eales, 2001). However, it shows a large dispersion from 45 K to 125 K. The dust temperatures of all the DOGs except the one with K are well mixed with those of other infrared luminous galaxies with similar infrared luminosities.
To examine the behavior of the warm dust component in galaxies, we plot the observed flux density ratio, (22 m)/(60 m), in the bottom panel. For comparison, we also plot the contours and gray dots indicating the distribution of IRAS 60 m detected SDSS galaxies at regardless of submillimeter detection. The panel shows that the four DOGs with small AGN contribution (purple circles) are indistinguishable from other infrared luminous galaxies (squares). Two DOGs and two infrared luminous galaxies with a large AGN contribution (green and cyan symbols) have larger flux density ratios than other galaxies, consistent with expectation (de Grijp et al., 1985; Veilleux et al., 2009; Lee et al., 2012).
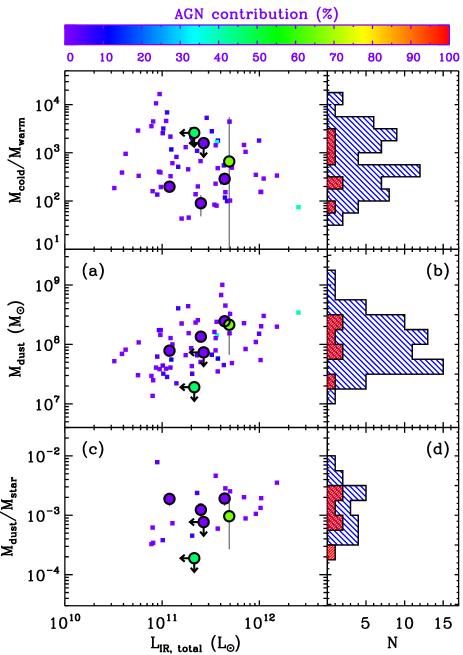
In Figure 4, we plot several parameters related to the dust mass as a function of infrared luminosity. The top panels show the dust mass ratios between the cold and warm components. Again the DOGs do not differ from other infrared luminous galaxies. We run a Kolmogorov-Smirnov (K-S) test to determine whether the DOGs (circles) and other infrared luminous galaxies (squares) are drawn from the same distribution. The K-S test cannot reject the hypothesis that the ratio distributions of the two samples are extracted from the same parent population. If we run the K-S test for the galaxies in the same infrared luminosity range (i.e., ), the conclusion does not change.
The middle panels show the total dust mass, . The dust mass roughly correlates with infrared luminosity, consistent with previous studies (Dunne & Eales, 2001; Magdis et al., 2012). The Spearman correlation coefficient is 0.51 and the probability of obtaining the correlation by chance is 0.01%, confirming the correlation between the two. The dust masses of the DOGs are indistinguishable from other infrared luminous galaxies. The K-S test also confirms this impression.
The bottom panels display the ratios between dust masses () and stellar masses (). We use the stellar mass estimates in the MPA/JHU DR7 value-added galaxy catalog555http://www.mpa-garching.mpg.de/SDSS/DR7/Data/stellarmass.html. These estimates are based on the fit to SDSS five-band photometry with the Bruzual & Charlot (2003) models (see also Kauffmann et al. 2003). We convert the stellar masses in the catalog that are based on the Kroupa initial mass function (IMF; Kroupa 2001) to those with a Salpeter IMF (Salpeter, 1955) by dividing them by 0.7 (Elbaz et al., 2007). The stellar masses in this catalog are not available for all the galaxies in this study. If we use the stellar masses derived from WISE 3.4 m luminosities to increase the sample size (Hwang et al., 2012), the conclusions do not change.
The ratios, /, for the majority of the galaxy samples are between 10-4 and 10-2, consistent with previous results for star-forming galaxies in the local universe (Santini et al., 2010; Dunne et al., 2011; Skibba et al., 2011). The ratios for the DOGs except the AGN-dominated outlier again do not differ from other infrared luminous galaxies.
4. DISCUSSION AND SUMMARY
We conducted SMA observations of four local analogs of DOGs to measure the physical parameters of their dust content. Two DOGs are clearly detected at 880 m with (880 m) mJy and ; the other two are not detected with 3 upper limits of (880 m) mJy. In addition to these four DOGs, we compiled submillimeter data for additional two DOGs from the literature. Thus, we determine the dust temperatures and masses for a total of six local DOGs. The comparison of these DOGs with other infrared luminous galaxies with submillimeter detection indicates no significant difference in dust parameters between the two populations.
Previous studies suggest that there are two types of DOGs for both local and high- DOGs: star formation (SF)- and AGN-dominated ones in their near- and mid-infrared SEDs (Dey et al. 2008; HG13). The reason for the extreme flux density ratios between mid-infrared and UV bands in SF-dominated DOGs mainly results from abnormal faintness in the UV rather than extreme brightness in the mid-infrared (Penner et al. 2012; HG13). This conclusion also applies to AGN-dominated DOGs, but the large mid-infrared fluxes from the AGN dust also contribute to the extreme flux density ratios.
For the six local DOGs, the dust masses and temperatures are similar to those of other submillimeter detected, infrared luminous galaxies with similar infrared luminosities. Thus, the DOGs are not a distinctive population among dusty galaxies. In other words, the main reason they are selected as DOGs is not an extremely large dust content, but simply results from a large dust obscuration along the light of sight. This conclusion explains the significant fraction of local DOGs with highly inclined disks (see Figure 6 in HG13; see also Kartaltepe et al. 2012 for disk-dominated, high- DOGs). Merging processes also change the dust geometry to favor large dust obscuration (Penner et al., 2012).
The DOGs with large AGN contribution clearly contain a hot dust component with K (see middle panels in Figure 3). Although the galaxies with a large AGN contribution tend to be selected as DOGs because of their large mid-infrared fluxes (see bottom left panel in Figure 9 of HG13), not all infrared luminous galaxies with large AGN contribution are selected as DOGs.
One interesting feature of the AGN-dominated DOGs is that their cold temperatures are similar to those of SF-dominated DOGs and other infrared luminous galaxies (see top panels in Figure 3). This result is consistent with recent conclusions that the effect of AGN on star-forming galaxies does not appear on the ‘Rayleigh-Jeans’ side of the infrared SED peak (i.e., cold components), but only appears on the ‘Wien’ side (i.e., warm components) (Hatziminaoglou et al., 2010; Kirkpatrick et al., 2012).
There are several studies on the dust temperatures and masses for high- DOGs (Bussmann et al., 2009; Melbourne et al., 2012; Sajina et al., 2012; Wu et al., 2012). Because of the different SED fitting methods and because of the small number of far-infrared/submillimeter data for high- DOGs, a direct comparison of dust parameters between local and high- DOGs is not very meaningful. Moreover, the infrared luminosity range for high- DOGs does not overlap with local DOGs.
A rough comparison of the dust temperatures based on currently available data (see Figure 13 in HG13) suggests that the dust temperatures for the majority of high- DOGs are similar to or lower than for local DOGs even though the infrared luminosities of high- DOGs are much higher than for local DOGs. There are also some hot DOGs at high redshift with dust temperatures much higher than for local DOGs (Wu et al., 2012). Far-infrared and submillimeter data for a larger number of DOGs in both low and high redshifts with similar infrared luminosities will be useful for a thorough comparison between the two populations.
This study clearly shows the importance of submillimeter data in understanding the dust content of local DOGs. We plan to extend this study to a larger sample of local DOGs with the Caltech Submillimeter Observatory (G.-H. Lee et al., in preparation).
Facility: SMA
References
- Abazajian et al. (2009) Abazajian, K. N., Adelman-McCarthy, J. K., Agüeros, M. A., et al. 2009, ApJS, 182, 543
- Antón et al. (2004) Antón, S., Browne, I. W. A., Marchã, M. J. M., Bondi, M., & Polatidis, A. 2004, MNRAS, 352, 673
- Armus et al. (2009) Armus, L., Mazzarella, J. M., Evans, A. S., et al. 2009, PASP, 121, 559
- Behroozi et al. (2013) Behroozi, P. S., Wechsler, R. H., & Conroy, C. 2013, ApJ, 770, 57
- Bouwens et al. (2010) Bouwens, R. J., Illingworth, G. D., Oesch, P. A., et al. 2010, ApJ, 709, L133
- Bruzual & Charlot (2003) Bruzual, G., & Charlot, S. 2003, MNRAS, 344, 1000
- Burgarella et al. (2013) Burgarella, D., Buat, V., Gruppioni, C., et al. 2013, A&A, 554, A70
- Bussmann et al. (2009) Bussmann, R. S., Dey, A., Borys, C., et al. 2009, ApJ, 705, 184
- Calanog et al. (2013) Calanog, J. A., Wardlow, J., Fu, H., et al. 2013, ApJ, in press (arXiv:1304.4593)
- Clements et al. (2010) Clements, D. L., Dunne, L., & Eales, S. 2010, MNRAS, 403, 274
- da Cunha et al. (2008) da Cunha, E., Charlot, S., & Elbaz, D. 2008, MNRAS, 388, 1595
- Dale et al. (2012) Dale, D. A., Aniano, G., Engelbracht, C. W., et al. 2012, ApJ, 745, 95
- de Grijp et al. (1985) de Grijp, M. H. K., Miley, G. K., Lub, J., & de Jong, T. 1985, Nature, 314, 240
- Desai et al. (2009) Desai, V., Soifer, B. T., Dey, A., et al. 2009, ApJ, 700, 1190
- Dey et al. (2008) Dey, A., Soifer, B. T., Desai, V., et al. 2008, ApJ, 677, 943
- Draine (2003) Draine, B. T. 2003, ARA&A, 41, 241
- Draine & Li (2007) Draine, B. T., & Li, A. 2007, ApJ, 657, 810
- Dunne et al. (2000) Dunne, L., Eales, S., Edmunds, M., et al. 2000, MNRAS, 315, 115
- Dunne & Eales (2001) Dunne, L., & Eales, S. A. 2001, MNRAS, 327, 697
- Dunne et al. (2011) Dunne, L., Gomez, H. L., da Cunha, E., et al. 2011, MNRAS, 417, 1510
- Elbaz et al. (2007) Elbaz, D., Daddi, E., Le Borgne, D., et al. 2007, A&A, 468, 33
- Elbaz et al. (2011) Elbaz, D., Dickinson, M., Hwang, H. S., et al. 2011, A&A, 533, 119
- Fiore et al. (2008) Fiore, F., Grazian, A., Santini, P., et al. 2008, ApJ, 672, 94
- Hatziminaoglou et al. (2010) Hatziminaoglou, E., Omont, A., Stevens, J. A., et al. 2010, A&A, 518, L33
- Heinis et al. (2013) Heinis, S., Buat, V., Béthermin, M., et al. 2013, MNRAS, 429, 1113
- Hildebrand (1983) Hildebrand, R. H. 1983, QJRAS, 24, 267
- Ho et al. (2004) Ho, P. T. P., Moran, J. M., & Lo, K. Y. 2004, ApJ, 616, L1
- Houck et al. (2005) Houck, J. R., Soifer, B. T., Weedman, D., et al. 2005, ApJ, 622, L105
- Hwang & Geller (2013) Hwang, H. S., & Geller, M. J. 2013, ApJ, 769, 116
- Hwang et al. (2012) Hwang, H. S., Geller, M. J., Kurtz, M. J., Dell’Antonio, I. P., & Fabricant, D. G. 2012, ApJ, 758, 25
- Hwang et al. (2010) Hwang, H. S., Elbaz, D., Magdis, G., et al. 2010, MNRAS, 409, 75
- James et al. (2002) James, A., Dunne, L., Eales, S., & Edmunds, M. G. 2002, MNRAS, 335, 753
- John (1988) John, T. L. 1988, A&A, 193, 189
- Kartaltepe et al. (2012) Kartaltepe, J. S., Dickinson, M., Alexander, D. M., et al. 2012, ApJ, 757, 23
- Kauffmann et al. (2003) Kauffmann, G., Heckman, T. M., White, S. D. M., et al. 2003, MNRAS, 341, 33
- Kirkpatrick et al. (2012) Kirkpatrick, A., Pope, A., Alexander, D. M., et al. 2012, ApJ, 759, 139
- Kroupa (2001) Kroupa, P. 2001, MNRAS, 322, 231
- Lee et al. (2012) Lee, J. C., Hwang, H. S., Lee, M. G., Kim, M., & Lee, J. H. 2012, ApJ, 756, 95
- Lutz et al. (2011) Lutz, D., Poglitsch, A., Altieri, B., et al. 2011, A&A, 532, A90
- Magdis et al. (2012) Magdis, G. E., Daddi, E., Béthermin, M., et al. 2012, ApJ, 760, 6
- Magnelli et al. (2013) Magnelli, B., Popesso, P., Berta, S., et al. 2013, A&A, 553, A132
- Martin et al. (2005) Martin, D. C., Fanson, J., Schiminovich, D., et al. 2005, ApJ, 619, L1
- Melbourne et al. (2012) Melbourne, J., Soifer, B. T., Desai, V., et al. 2012, AJ, 143, 125
- Mullaney et al. (2011) Mullaney, J. R., Alexander, D. M., Goulding, A. D., & Hickox, R. C. 2011, MNRAS, 414, 1082
- Murakami et al. (2007) Murakami, H., Baba, H., Barthel, P., et al. 2007, PASJ, 59, 369
- Narayanan et al. (2010) Narayanan, D., Dey, A., Hayward, C. C., et al. 2010, MNRAS, 407, 1701
- Neugebauer et al. (1984) Neugebauer, G., Habing, H. J., van Duinen, R., et al. 1984, ApJ, 278, L1
- Oliver et al. (2012) Oliver, S. J., Bock, J., Altieri, B., et al. 2012, MNRAS, 424, 1614
- Penner et al. (2012) Penner, K., Dickinson, M., Pope, A., et al. 2012, ApJ, 759, 28
- Pilbratt et al. (2010) Pilbratt, G. L., Riedinger, J. R., Passvogel, T., et al. 2010, A&A, 518, L1
- Reddy et al. (2012) Reddy, N., Dickinson, M., Elbaz, D., et al. 2012, ApJ, 744, 154
- Reddy et al. (2008) Reddy, N. A., Steidel, C. C., Pettini, M., et al. 2008, ApJS, 175, 48
- Rigby et al. (2011) Rigby, E. E., Maddox, S. J., Dunne, L., et al. 2011, MNRAS, 415, 2336
- Sajina et al. (2012) Sajina, A., Yan, L., Fadda, D., Dasyra, K., & Huynh, M. 2012, ApJ, 757, 13
- Salpeter (1955) Salpeter, E. E. 1955, ApJ, 121, 161
- Santini et al. (2010) Santini, P., Maiolino, R., Magnelli, B., et al. 2010, A&A, 518, L154
- Skibba et al. (2011) Skibba, R. A., Engelbracht, C. W., Dale, D., et al. 2011, ApJ, 738, 89
- Symeonidis et al. (2013) Symeonidis, M., Vaccari, M., Berta, S., et al. 2013, MNRAS, 431, 2317
- Takeuchi et al. (2005) Takeuchi, T. T., Buat, V., & Burgarella, D. 2005, A&A, 440, L17
- U et al. (2012) U, V., Sanders, D. B., Mazzarella, J. M., et al. 2012, ApJS, 203, 9
- Veilleux et al. (2009) Veilleux, S., Rupke, D. S. N., Kim, D., et al. 2009, ApJS, 182, 628
- Vlahakis et al. (2005) Vlahakis, C., Dunne, L., & Eales, S. 2005, MNRAS, 364, 1253
- Walcher et al. (2011) Walcher, J., Groves, B., Budavári, T., & Dale, D. 2011, Ap&SS, 331, 1
- Willmer et al. (2009) Willmer, C. N. A., Rieke, G. H., Le Floc’h, E., et al. 2009, AJ, 138, 146
- Wilson et al. (2008) Wilson, C. D., Petitpas, G. R., Iono, D., et al. 2008, ApJS, 178, 189
- Wright et al. (2010) Wright, E. L., Eisenhardt, P. R. M., Mainzer, A. K., et al. 2010, AJ, 140, 1868
- Wu et al. (2012) Wu, J., Tsai, C.-W., Sayers, J., et al. 2012, ApJ, 756, 96
- York et al. (2000) York, D. G., Adelman, J., Anderson, Jr., J. E., et al. 2000, AJ, 120, 1579