Full Field Supercritical Angle Fluorescence Microscopy for live cell imaging
Abstract
We introduce a full field fluorescence imaging technique with axial confinement of about 100 nm at the sample/substrate interface. Contrary to standard surface imaging techniques, this confinement is obtained through emission filtering. This technique is based on supercritical emission selectivity. It can be implemented on any epifluorescence microscope with a commercial high numerical aperture objective and offers a real time surface imaging capability. This technique is of particular interest for live cell membrane and adhesion studies. Using HEK cells, we show that one can observe simultaneously the surface and in-depth cell phenomena.
1 Centre d’Imageries Plasmoniques Appliquées, Institut Langevin, ESPCI ParisTech, CNRS UMR 7587, 10 rue Vauquelin, 75 231 Paris Cedex 05,
France.
2 Institut des Sciences Moléculaires d’Orsay and Centre de photonique Biomédicale (CLUPS), CNRS Univ. Paris-Sud 11, F91405
Orsay cedex (France).
∗Corresponding author: emmanuel.fort@espci.fr
170.2520, 260.6970, 220.0220, 240.0240.
Numerous cell mechanisms, like membrane trafficking and adhesion processes, are located in direct vicinity of the membrane [1]. The understanding of such processes is of crucial importance in many biomedical issues. Because of the minute concentrations of biomolecules involved, fluorescence microscopy is the widely favoured technique to investigate such systems. However, the diffraction limited axial sectioning is not sufficient to observe membrane processes separately from the inner cell activity.
In this context, Total Internal Reflection Fluorescence (TIRF) configuration has emerged as a powerful surface imaging technique [10]. Axial sectioning is obtained by illuminating above the critical angle. It produces an evanescent field which excites only fluorophores in the direct vicinity of the interface. Excitation confinement enables one to observe minute concentrations of fluorophores at the interface while reducing the background noise from the inner part of the cell. The development of high numerical aperture immersion oil objective lenses has popularized this technique in a through-the-objective configuration. The sensitivity of this technique is mainly limited by the intrinsic light scattering into the cells which eventually results in a loss of excitation light confinement [3].
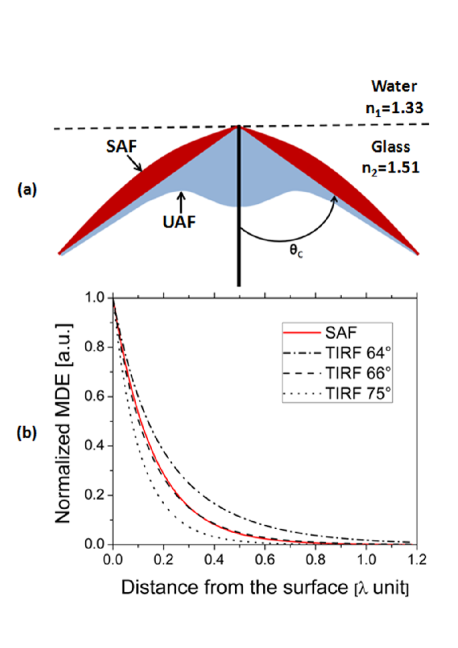
An alternative approach has been proposed to obtain axial sectioning [4]. It takes advantage of the fluorophore/interface distance dependent emission. When a fluorophore in medium 1 (refractive index ) is placed in the direct vicinity of the interface with a medium 2 (refractive index ), part of the fluorescence is emitted above the critical angle . This supercritical fluorescence is also called ”forbidden light” since Snell-Descartes refraction law does not allow such an emission [4]. Supercritical Angle Fluorescence (SAF) originates from the fact that evanescent components of the emission dipole can become propagative in medium 2. Thus, SAF contribution decreases sharply with the fluorophore/interface distance , contrary to the Undercritical Angle Fluorescence (UAF) components that remain constant [5]. In order to compare SAF with TIRF, we study the Molecular Detection Efficiency (MDE) as a function of the fluorophore/substrate distance , for both the techniques. MDE is given by [6]:
| (1) |
where is the excitation rate, is the quantum yield of the fluorophore and is the Molecular Collection Efficiency. For simplicity, we will assume that the fluorophore has = 1. In TIRF, the variation of MDE with is dominated by the excitation profile where is the penetration depth of the evanescent field. is function of the wavelength , the incident angle and the refractive indices and . In contrast to TIRF, for the SAF technique MDE is dominated by while is roughly constant. Figure 1(a) shows the emission lobe in glass for a fluorophore placed at the interface (). The SAF emission appears in red and represents about 50% of the emission in the glass [6]. The normalized MDE in TIRF for different angles and in SAF are represented figure 1(b). The MDE in TIRF has been obtained multiplying the (UAF+SAF) by the TIRF excitation profile . For the SAF, the normalized MDE is simply given by the . We calculate the for UAF and SAF using the vectorial Debye integral model[7]. The calculated theoretical penetration depth in SAF is equal to 129 nm (with = 593 nm, = 1.33 and = 1.51) which is the penetration depth of TIRF at .
Recently, an implementation of the SAF technique has been proposed using a specifically designed objective lens with a parabolic mirror to collect supercritical angles [8]. This objective lens has the advantage of simplicity and low cost which is of particular interest in biosensing applications [9]. However, since imaging with this objective involves objective/sample scanning, it is relatively slow and limited to fixed biological samples.
Here, we propose an alternative configuration to obtain directly Full Field SAF images (F2-SAF) for a real time imaging of dynamic biological processes. This approach has been introduced by Axelrod about ten years ago with a 1.65 NA objective lens [10]. Although the images showed a clear axial confinement, the lateral resolution was reduced by a factor 2. This certainly originates in the experimental set-up that did not permit accurate and quantitative measurements. In this paper, we give quantitative analysis of the optical characteristics of this technique and show that its performances should be reevaluated, thus opening the path to biological applications.
The schematic of the experimental setup is represented in figure 2. We use a commercial inverted microscope (Nikon Ti) with an apochromat objective lens 1.49 NA 60x from Nikon and an EM-CCD camera (iXon+, Andor Technology). The illumination source is a standard fibred 130 W mercury lamp which provides a homogeneous illumination on the sample. A two-lens system is included in the optical path to image the back focal plane (BFP) of the objective on a conjugate plane. The relation between the radius in the BFP and the angle of emission is given by the Abbe condition: , where is the focal distance of an apochromat objective and is the refractive index of immersion medium. A circular mask in the shape of an opaque disk is placed on this conjugate plane to remove UAF. It is mounted on a micrometric XYZ translation stage that allows fine positioning. An additional removable Bertrand lens can be added in the beam path to image directly the BFP. This permits an easy centering and axial positioning of the mask. An image of the BFP is shown in figure 2 for a solution of Rhodamine (obtained with a Nikon camera Reflex D700). UAF and SAF areas are easily identifiable.
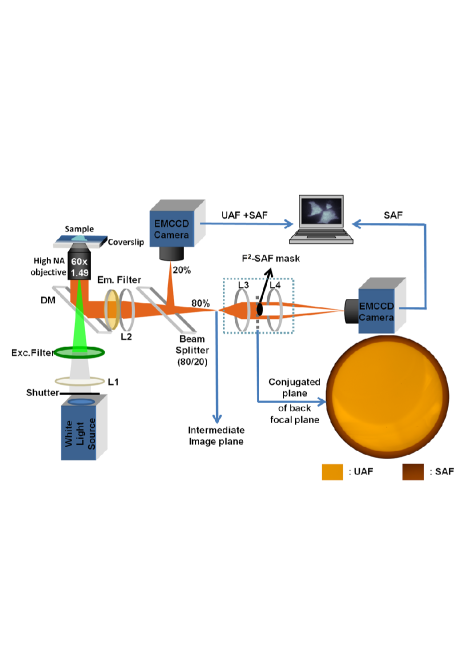
For biological studies, it can be of great interest to acquire in parallel the standard epifluorescence image (UAF+SAF), and the SAF image. In order to obtain a simultaneous acquisition, a 20:80 beamsplitter cube has been added to split the beam into a UAF+SAF path (20%) and a F2-SAF path (80%) on two identical and synchronized EM-CCD cameras.
In the following paragraph, we focus on the optical performances of this F2-SAF technique: the axial sectioning and the lateral resolution. We use a method introduced by Mattheyses and Axelrod [11] to measure the penetration depth. This technique takes advantage of the intensity profile of 10 m fluorescence beads to measure the penetration depth. The measured values are nm. This is in good agreement with the Debye model. Besides, the penetration depth is constant all over the image.
The lateral resolution of the F2-SAF is measured by acquiring the 2D Point Spread Function (PSF) of 100 nm fluorescent latex beads (FluoSpheres® carboxylate-modified microspheres, Invitrogen). To reach a sufficient accuracy for the 2D PSF measurements on the camera, we have added a 6.7x afocal optical system, composed of two doublet lenses of focal length mm and mm, between the microscope and the camera. We thus obtain an over-sampling of 42 nm/pixel (far above the Nyquist criterion).
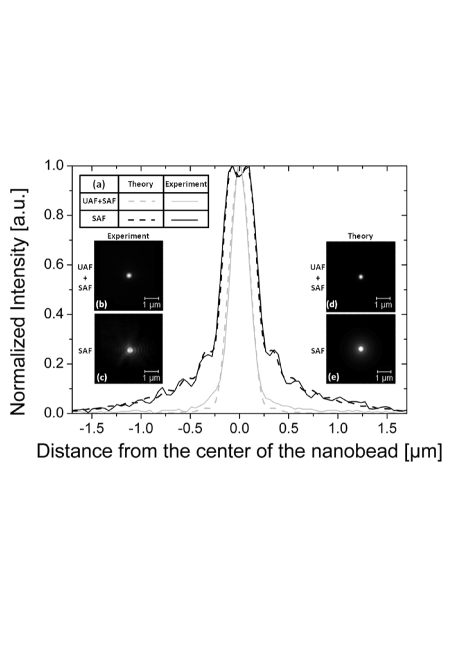
Figure 3(a) shows the theoretical normalized cross-sectional profile (dashed lines) of the PSF obtained with the vectorial Debye integral model which takes into account the polarization [12]. It is in good agreement with the experimental profiles (smooth lines) in UAF+SAF and F2-SAF. In the case of a dipole perpendicular to the surface, the emission is polarized radially with a minimum at the center. The dipole average orientation has been used as a fitting parameter. A nearly isotropic distribution gives the best fit (with small enhanced orthogonal proportion of 4%). The images of a single nanobead are shown in figures 3(b) for UAF+SAF and 3(c) for F2-SAF. The associated theoretical images are shown in figures 3(d) and (e) respectively. As expected, we notice a loss of resolution on the F2-SAF PSF [13, 14]. To evaluate the resolution, we compare the full width at half maximum (FWHM). The UAF+SAF PSF is known to be fitted accurately by a gaussian[15]. The normalized intensity profile is given by where the standard deviation is the only fitting parameter. The FWHM is given by: . The gaussian curve fits accurately the experimental data. For UAF+SAF collection, we obtain the value nm which is in good agreement with the one expected from the theory: nm (). For SAF collection, we measure nm (average over 15 nanobeads). This represents a loss of resolution of about 25% as compared to standard epifluorescence. We also pay a particular attention to the study of any possible off-axis modifications of the PSF due to the abberations introduced by the objective lens. The value of has remained consistent all over the image.
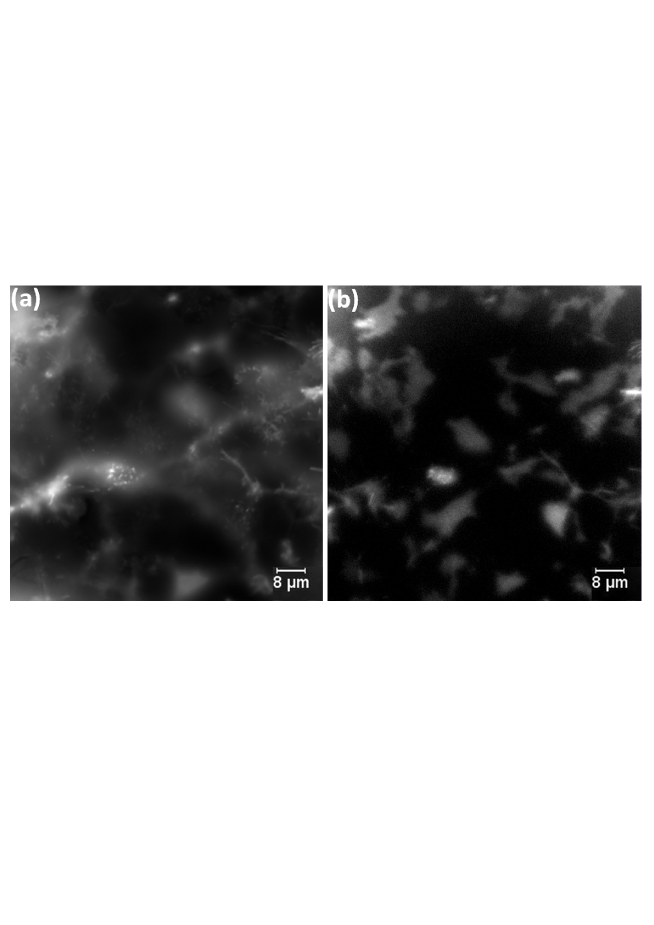
We validate this full field imaging technique by performing real time cell imaging. We use Human Embryonic Kidney (HEK 293) cells transfected with type I cannabinoid receptors tagged with GFP (CB1R-GFP). Two cameras synchronized together with a time exposure of 300 ms have been used to obtain simultaneously images of the whole cell and of its membrane. Figure 4(a) shows HEK cells in UAF+SAF and their membranes 4(b) in F2-SAF, where the fluorescence coming from the inner parts of the cells is clearly removed. These images have been obtained with a simple white lamp. As expected, there is a slight loss of lateral resolution in the F2-SAF image, however the quality of the image is satisfactory. It is possible by using this configuration to monitor membrane trafficking in real time.
In this paper, we have shown that F2-SAF enables real time cell membrane imaging with a simple mask in the BFP of a commercial objective to remove UAF components. We observed a slight loss in the lateral resolution which is due to the larger PSF of the fluorophores with emission dipoles orthogonal to the surface. Nevertheless, the quality of the images permits us to easily resolve the structures of the membrane. Besides, image quality could be further improved by using deconvolution techniques. The axial sectioning is of the order of 100 nm. Moreover, penetration depth and lateral resolution performances are maintained throughout the whole image. F2-SAF technique allows one to perform the observation of the whole cell and its membrane simultaneously at low cost using a standard epifluorescence microscope and an incoherent source which provides an homogeneous illumination all over the sample. We are currently applying this technique to biomedical issues, in particular the study of dictyostelium motility and endocytosis tracking. This technique could also find applications in other field like liquid-liquid interface studies. Ongoing developments focus on alternative optical configurations using removable masks with a single camera.
The authors thank C. Boccara and S. Grésillon for fruitful discussions, S. Lécart for cell samples, S. Sivankutty for helpful comments on this article. This work has been supported by grants from Region Ile de France and C’Nano Ile de France.
References
- [1] M.S. Bretscher and C. Aguado-Velasco, ”Membrane traffic during cell locomotion”, curr. Opin. Cell Biol. 10, 537-541 (1998).
- [2] D. Axelrod, ”Total Internal Reflection Fluorescence Microscopy in Cell Biology”, Traffic 2, 764-774 (2001).
- [3] M. Oheim, F. Schapper, ”Non-linear evanescent-field imaging”, J. Phys. D.: Appl. Phys. 38, 185-197 (2005).
- [4] T. Ruckstuhl, J. Enderlein, S. Jung, S. Seeger, ”Forbidden Light Detection from Single Molecules”, Analytical Chemistry 72, 2117 2123 (2000).
- [5] T. Ruckstuhl and D. Verdes, ”Supercritical angle fluorescence (SAF) microscopy”, Opt. Express 12, 4246-4254 (2004).
- [6] E. Fort and S. Grésillon, ”Surface enhanced fluorescence”, J. Phys. D: Appl. Phys. 41, 013001-013031 (2008).
- [7] B. Richards and E. Wolf, Electromagnetic diffraction in optical systems. II. structure of the image field in an aplanatic system , in Proceedings of the Royal Society of London. Series A, Mathematical and Physical Sciences (1959) pp. 358 379.
- [8] T. Ruckstuhl, M. Rankl and S. Seeger, ”Highly sensitive biosensing using a supercritical angle fluorescence (SAF) instrument ”, Biosensors and Bioelectronics 18, 1193-1199 (2003).
- [9] C. M Winterflood, T. Ruckstuhl, D. Verdes and S. Seeger, ”Nanometer Axial Resolution by Three-Dimensional Supercritical Angle Fluorescence Microscopy”, Phys. Rev. Lett. 105, 108103-108106 (2010).
- [10] D. Axelrod, ”Selective imaging of surface fluorescence with very high aperture microscope objectives,” J. of Biomed. Opt. 6, 6-13 (2001).
- [11] A.L. Mattheyses, D. Axelrod, ”Direct measurement of the evanescent field profile produced by objective-based total internal reflection fluorescence”, Journal of Biomedical Optics 11, 014006-014012 (2006).
- [12] W.T. Tang, E. Chung, Y-H Kim, P.T.C. So and C.J.R. Sheppard, ”Investigation of the point spread function of surface plasmon-coupled emission microscopy”, Optics Express 15, 4634-4646 (2007).
- [13] C. Rivolta, ”Airy disk diffraction pattern : comparison of some values of f/No. and obscuration ratio”, Applied Optics 25, 2404-2408 (1986).
- [14] V.N. Mahajan, ”Uniform versus Gaussian beams : a comparison of the effects of diffraction, obscuration, and aberrations”, J. Opt. Soc. Am. A 3, 470-485 (1986).
- [15] B. Zhang, J. Zerubia and JC. Olivo-Marin, ”Gaussian approximations of fluorescence microscope point-spread function models”, Applied Optics 46, 1819-1829 (2007).
Informational Fourth Page
References
- [1] M.S. Bretscher and C. Aguado-Velasco, curr. Opin. Cell Biol. 10, 537 (1998).
- [2] D. Axelrod, Traffic 2, 764 (2001).
- [3] M. Oheim, F. Schapper, J. Phys. D.: Appl. Phys. 38, 185 (2005).
- [4] T. Ruckstuhl, J. Enderlein, S. Jung, S. Seeger, Analytical Chemistry 72, 2117 (2000).
- [5] T. Ruckstuhl and D. Verdes, Opt. Express 12, 4246 (2004).
- [6] E. Fort and S. Grésillon, J. Phys. D: Appl. Phys. 41, 013001 (2008).
- [7] B. Richards and E. Wolf, in Proceedings of the Royal Society of London. Series A, Mathematical and Physical Sciences (1959) pp. 358.
- [8] T. Ruckstuhl, M. Rankl and S. Seeger, Biosensors and Bioelectronics 18, 1193 (2003).
- [9] C. M Winterflood, T. Ruckstuhl, D. Verdes and S. Seeger, Phys. Rev. Lett. 105, 108103 (2010).
- [10] D. Axelrod, J. of Biomed. Opt. 6, 6 (2001).
- [11] A.L. Mattheyses, D. Axelrod, Journal of Biomedical Optics 11, 014006 (2006).
- [12] W.T. Tang, E. Chung, Y-H Kim, P.T.C. So and C.J.R. Sheppard, Optics Express 15, 4634 (2007).
- [13] C. Rivolta, Applied Optics 25, 2404 (1986).
- [14] V.N. Mahajan, J. Opt. Soc. Am. A 3, 470 (1986).
- [15] B. Zhang, J. Zerubia and JC. Olivo-Marin, Applied Optics 46, 1819 (2007).