The Carina Project. VI. The helium burning variable stars11affiliation: Based on images collected with the MOSAICII camera available at the CTIO 4m Blanco telescope, La Serena; (2003B-0051,2004B-0227, 2005B-0092, P.I.: A.R. Walker) and in part with the WFI available at the 2.2m MPG/ESO telescope (A064.L-0327) and with images obtained from the ESO/ST-ECF Science Archive Facility.
Abstract
We present new optical () time-series data for the evolved variable stars in the Carina dwarf spheroidal galaxy. The quality of the data and the observing strategy allowed us to identify 14 new variable stars. Eight out of the 14 are RR Lyrae (RRL) stars, four are Anomalous Cepheids (ACs) and two are geometrical variables. Comparison of the period distribution for the entire sample of RRLs with similar distributions in nearby dSphs and in the Large Magellanic Cloud indicates that the old stellar populations in these systems share similar properties. This finding is also supported by the RRL distribution in the Bailey diagram. On the other hand, the period distribution and the Bailey diagram of ACs display significant differences among the above stellar systems. This evidence suggests that the properties of intermediate-age stellar populations might be affected both by environmental effects and structural parameters. We use the Period–Wesenheit (PW) relation of RRLs together with evolutionary prescriptions and find a true distance modulus of 20.090.07(intrinsic)0.1(statistical) mag that agrees quite well with similar estimates available in the literature. We identified four peculiar variables. Taking into account their position in the Bailey diagram and in the PW relation, two of them (V14, V149) appear to be candidate ACs, while two (V158, V182) might be peculiar RRLs. In particular, the variable V158 has a period and a -band amplitude very similar to the low-mass RRL —RRLR-02792—recently identified by Pietrzyński et al. (2012) in the Galactic bulge.
1 Introduction
Nearby dwarf spheroidal galaxies (dSphs) play a fundamental role in modern astrophysics. Wide-field imagers available at the 4–8m class telescopes provided a complete census of their stellar content down to the main sequence of the old stellar population (Bono et al., 2010; Stetson et al., 2011; Monelli et al., 2012). Multi-slit and multi-fiber spectrographs available at the same facilities have provided the opportunity to investigate their kinematic structure (Battaglia et al., 2008; Fabrizio et al., 2011) and their metallicity distribution (Clementini et al., 2005; Fabrizio et al., 2012; Lemasle et al., 2012; Venn et al., 2012). Dwarf spheroidals are also important laboratories for near-field cosmology. Recent investigations indicate that the galaxies obey a well defined relation between mass and metallicity, where more massive galaxies are more metal-rich than less massive ones. This evidence has been typically explained as a consequence of galactic outflows, wherein more massive systems are able to retain metal-rich gas, while galactic outflows expel it in low-mass stellar systems. However, we are facing the evidence that nearby dSphs are, at fixed mass, more metal-poor than expected by the canonical mass-metallicity relation (Chilingarian et al., 2011).
Moreover, it has recently been shown that the metallicity—in stellar systems with total mass smaller than —is anti-correlated with the star-formation rate (SFR, Mannucci et al. 2010). This empirical evidence is typically explained as a local infall of metal-poor gas that simultaneously increases the SFR and decreases the mean metallicity of these systems. Recent investigations have indicated quite complex star formation activity in nearby dSphs. For example it has been suggested that Leo I experienced almost continuous star formation during the last 10 Gyrs (Fiorentino et al., 2012), while Carina experienced multiple and distinct star formation events (Bono et al., 2010). Moreover, several dSphs in the Local Group (LG) show broad metallicity distributions (Hill, 2010) suggesting that they have been able to retain the supernova yields of previous stellar generations.
Variable stars in nearby dwarfs are important benchmarks for determining not only their distance and their geometry (Minniti et al., 2003; Ripepi et al., 2012; Inno et al., 2013), but also their stellar populations (Pritzl et al., 2005; Pietrzyński et al., 2006; Kinemuchi et al., 2008; Kuehn et al., 2008; Szewczyk et al., 2008; Moretti et al., 2009; Musella et al., 2009; Szewczyk et al., 2009; Pietrzyński et al., 2010; Musella et al., 2012; Matsunaga et al., 2011; Dall’Ora et al., 2012).
Nearby dwarfs also offer the unique opportunity to study the dependence of stellar pulsation properties on the environment and, in particular, on the chemical enrichment history (Caputo et al., 2005; Lanfranchi et al., 2006). In this context the Carina dSph plays a key role, since it hosts a significant number of evolved and unevolved (Mateo et al., 1998) variable stars tracing the different episodes of star formation (see e.g. Dall’Ora et al. 2003; Monelli et al. 2003; Bono et al. 2010).
In this paper we present an updated investigation of the variable star content in Carina based on new time-series data collected with the MOSAICII camera available at the CTIO 4m Blanco telescope and with the WFI camera available at the 2.2m MPG/ESO telescope. In Section 2 we present the observations and the data-reduction strategy. In Section 3 we discuss the location of new and old evolved variable stars in the color-magnitude diagram (CMD). In Section 4 we compare the period distribution and the pulsation properties of evolved Carina variables with similar variable stars in nearby dwarfs. The conclusions and a few final remarks close the paper.
2 Observations & Data Reduction
Our imaging data for the main body of Carina111We also have observations of flanking fields to the south and northeast of the galaxy, but we do not discuss these here. are divided into 23 observing runs, as detailed in Table 1. To be more precise, there were in fact 21 different observing runs, but in two cases (here named wfi17/W00jan and B03jan/double) we obtained incomplete sets of observations from the same observing run via two different sources. In each case, after elimination of duplicate observations, the non-redundant sets of images were kept as two separate “observing runs” lest any inconsistencies in the preprocessing of the different sets of images lead to subtle changes in the absolute flux calibrations of the data. The observations of Carina were contained within 327 distinct datasets, where a dataset consists of either (a) all images obtained by a given CCD on a given photometric night, or (b) all images obtained by a given CCD on one or more non-photometric nights during a given observing run.
Table 1 lists the number of different exposures obtained of Carina, but because most of the
observations were made with mosaic cameras, the actual number of
CCD images that we processed was much greater (the
“Multiplex” column in the table indicates the number of distinct
CCD images obtained in the course of each exposure).
In total, we processed 5,946 distinct CCD images
for this photometric study of the main body of Carina.
Processing of these data was carried out in our usual fashion with the
DAOPHOT IV/ALLSTAR/ALLFRAME suite of programs (e.g. Stetson 1987, 1994). Of the 327 datasets
containing Carina observations, 223 were considered photometric
and were transformed individually to the photometric system
of Landolt (1992) via observations of Landolt’s primary
photometric standards as well as secondary standards established
by Stetson (2000, 2005). The remaining 104 datasets were
considered non-photometric; for each of these the color-dependent
transformations to the Landolt photometric system were determined
from all available observations of primary and secondary
standards, but the photometric zero point of each individual CCD
image was determined by reference to secondary standards contained
within the image itself.
Because of the non-overlapping nature of the fields of the different CCDs in each mosaic camera, no individual star appears in more than a small fraction of the total number of images. The maximum number of flux measurements for any given star was 17 in , 167 in , 222 in , and 85 in . The 14 exposures in the filter (comprising 112 individual CCD images) were all obtained on non-photometric occasions; as a result, Stetson was unable to define local secondary standards in the photometric bandpass, and we were not able to calibrate these -band observations to the Landolt photometric system. Nevertheless, these 112 -band images were included in the ALLFRAME reductions of Carina in order to make use of the information they contribute to the completeness of the star list and the precision of the astrometry.
3 Variable Stars
We applied a slightly more robust variant of the Welch & Stetson (1993) variability search technique to the new multi-band optical photometry of the main body of Carina. On the basis of these data we have identified 108 evolved variable stars; among them 14 are new identifications. A simple string-length algorithm was applied to the time-series data to search for periodicity. Fourier series were then fitted by non-linear least-squares to refine the periods and determine mean magnitudes and amplitudes.
For eight of the already known variables (six ACs: V27, V115, V149, V178, V187, V203 two RR Lyraes: V22, V176) we have updated the pulsation periods. Indeed, the previous search for variable stars had been performed on , time-series data covering only three consecutive nights (Dall’Ora et al., 2003), and a few period determinations were affected by alias problems. Table 2 lists (from left to right) the identification, the classification, the epoch of maximum light, the period (days), the magnitude-averaged [(), ()], the intensity-averaged [, ], the and the amplitude (AV, AB) for the entire sample of variable stars identified in the current photometric survey.
Eight out of the 14 new variables are RR Lyrae stars (RRLs), four are candidate anomalous Cepheids (ACs) and two are geometrical variables (eclipsing binary, W UMa). The pulsation properties of the new variables are listed in Table 3, A more detailed discussion of the pulsation characteristics of the entire sample will be addressed in a future paper (Coppola et al. 2013, in preparation).
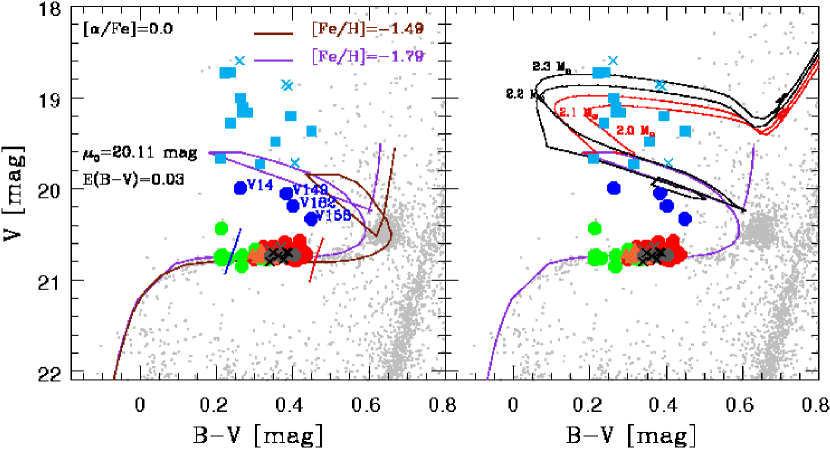
Figure 1 shows the ,() CMD of Carina in the region across the helium burning phases for both the old (horizontal branch [HB]) and the intermediate-age stellar population (red clump, [RC]). The 69 RRLs associated with the old stellar populations have been plotted as circles: red and green circles mark RRLs pulsating in the fundamental (RRab, 57) and in the first overtone (RRc, 12) modes, respectively, while orange triangles mark the six candidate mixed mode variables, i.e., variables oscillating simultaneously in two or more pulsation modes (RRd). The five RRLs showing modulation in both amplitude and phase (i.e., the so-called Blazhko RRLs) are plotted as grey circles. The fundamental RRLs newly detected have been plotted as crosses. The sixteen variables brighter than the RRLs have been classified according to Dall’Ora et al. (2003) as fundamental-mode ACs: cyan squares represent previously known variables while the cyan crosses indicate, once again, our new AC candidates. Four variables located between the RRLs and the ACs have been plotted as blue circles, since the nature of these objects, based only on their location in the CMD, is not yet clear.
To further constrain the evolutionary status of the Carina variables, solid curves in the left panel of Figure 1 represent the theoretical central helium-burning sequence for both old and intermediate-age stellar structures with the labeled solar–scaled chemical compositions and stellar masses ranging from 0.5 to 2.8 . The black and red curves in the right-hand panel of Figure 1 represent theoretical evolutionary tracks for stars near the transition mass between central helium burning in degenerate (red) and non-degenerate cores (black); these are shown, for clarity, only for the lower of the two metallicity values. The adopted true distance modulus and reddening (Dall’Ora et al., 2003) are also labelled. The metal abundances we have adopted for this illustration follow current spectroscopic measurements based on high resolution spectra (Fabrizio et al., 2012; Venn et al., 2012; Lemasle et al., 2012).
The data plotted in this figure display several interesting features:
a) The observed RRLs agree quite well with predicted ZAHBs. The same
conclusion applies to the distribution of RRLs within the
predicted instability strip. Indeed, only a few RRc variables appear
to be slightly bluer than the predicted first-overtone blue edge
for Z=0.0004 ([Fe/H]=–1.7 dex).
b) The ACs are only partially explained by current low-mass
evolutionary prescriptions, since a fraction of them (19.2 mag, ()0.3 mag)
are systematically hotter and brighter than predicted by partially
electron-degenerate helium-burning models ( 2.2; red curves in the
right-hand panel of Figure 1).
The data plotted here support the suggestion that the brighter ACs
are candidate short-period classical Cepheids. The difference between
ACs and classical Cepheids is that the latter stars are slightly more
massive ( 2.2 for the metal abundances considered here)
and are characterized by quiescent helium-burning in non-degenerate cores.
c) The intermediate-mass stars (AC, RC) show a spread in metallicity of the
order of 0.25 dex as currently suggested by the spectroscopic measurements
(Fabrizio et al. (2012) and references therein).
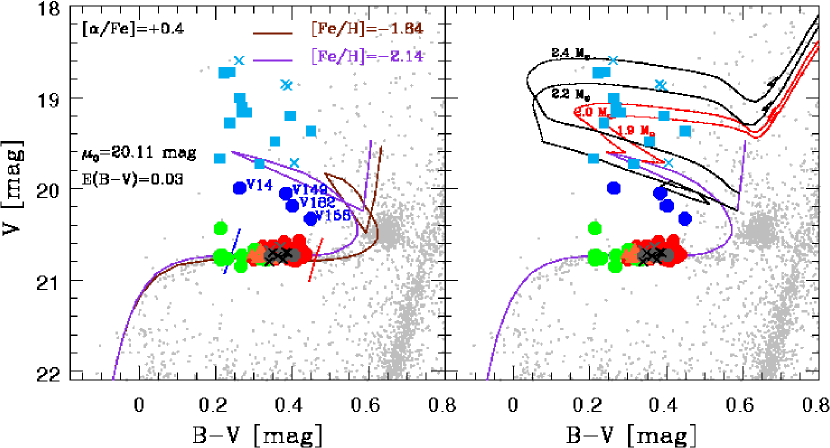
Figure 2 shows the same data, but here the comparison is with
alpha-enhanced (Fe 0.4) theoretical helium-burning structures.
The data plotted in this figure indicate that a decrease in iron abundance to
[Fe/H]=–2.14 dex combined with the enhancement (resulting in an overall
metallicity of [M/H]=–1.79 dex, virtually the same as a solar–scaled abundance
pattern with [Fe/H]=–1.79 dex) has a minimal impact at least on the
RRLs.
On the other hand, the blue circles in Figures 1 and 2 appear brighter than typical RRL,
but fainter than ACs for the assumed metallicity. Therefore, the
classification of these objects is more uncertain and further
information is required to constrain their evolutionary and pulsational
status.
4 Pulsation properties
4.1 Period Distribution
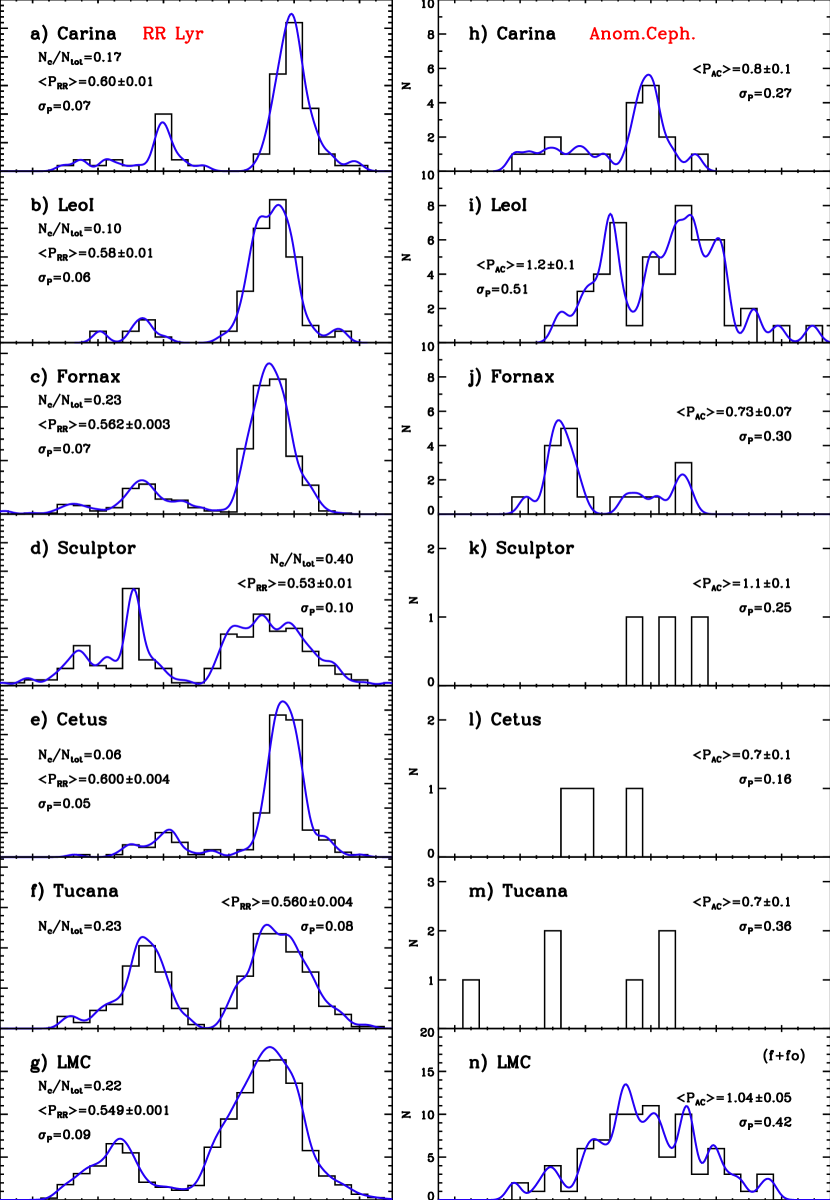
The period distribution of the Carina RRLs is shown in the top left panel a) of Figure 3. The period distribution shows two well-defined peaks for RRab ( P –0.19) and RRc ( P –0.4) variables, plus a third minor peak at ( P –0.5).
The mean period of fundamental RRLs is a crucial observable in the definition of the so-called Oosterhoff dichotomy (Oosterhoff, 1939), typical of Galactic globular clusters (GGCs). The GGCs hosting RR Lyrae stars can be split, according to the mean period of RRL stars, into two different groups: the Oosterhoff type I [OoI], with Pab days and the Oosterhoff type II [OoII] with Pab days. In order to provide a more complete picture of the Carina variable star content, the periods of both first overtone and double-mode pulsators were fundamentalized according to the relation . The mean period of the entire sample of RRLs is then PRR days. This suggests that Carina can be classified as an OoII system, in agreement with previous results (Dall’Ora et al., 2003). However, the Oosterhoff dichotomy also shows up in the RRL population ratio, i.e., the ratio between the number of RRc and the total number of RRLs. The OoI clusters have a ratio , while for OoII clusters this ratio is (Clement et al., 2001). On the basis of the new RRL sample, we found Nc/N, thus suggesting that this system is, according to the RRL population ratio, more similar to an OoI cluster. This discrepancy suggests that Carina is, in fact, Oosterhoff-intermediate, like Draco (Kinemuchi et al., 2008), Ursa Minor (Nemec et al., 1988), Large Magellanic Cloud (LMC) globular clusters (Bono et al., 1994) and the outer-halo globular cluster Palomar 3 (Kinemuchi et al., 2008).
To better understand the period distribution of Carina variables we compare their properties with those of other LG dSphs. We start with the pulsating variables in the Leo I dSph ([Fe/H]=–1.43, =0.33 dex; Kirby et al. 2011), including 86 RRLs and 51 ACs, have recently been investigated by Fiorentino et al. (2012). The period distribution of this galaxy’s RRLs peaks at PRR days (see panel b) of Figure 3), thus also resembling an Oosterhoff-intermediate system. On the other hand, Leo I appears to be an OoI system according to the RRL population ratio –Nc/Ntot– that is close to . The indication is that the pulsation properties of RRLs in Carina and in Leo I are generally similar.
The period distributions of RRLs in the Fornax dSph ([Fe/H]=–0.99, =0.36 dex; Kirby et al. 2011; Figure 3 panel c)) are taken from Bersier & Wood (2002). The value of PRR days is also typical of an Oo-intermediate system, while according to the RRL population ratio (Nc/N) Fornax seems to resemble an OoI type globular cluster. We will discuss in more detail the variable star content of Fornax in Section 4.
The period distribution of the 221 RRLs in the Sculptor dSph ([Fe/H]=–1.68, =0.48 dex; Kirby et al. 2009, 2011) by Kaluzny et al. (1995) peaks around a mean period PRR days (panel d) of Figure 3), suggesting an OoI system, but once again this is in contrast with the value of Nc/N making it more similar to an OoII system.
Together with the above satellite dwarf galaxies we decided to include in our analysis two isolated dwarfs, namely Cetus and Tucana (Bernard et al., 2009). The former galaxy hosts 155 RRLs and the period distribution shows a well defined main peak with a mean period PRR days (panel e) of Figure 3), suggesting an OoII system. In spite of the large sample of RRLs, Cetus only hosts eight first overtones. This means that the RRL population ratio is quite small Nc/Ntot=0.06, therefore suggesting an OoI system. The period distribution of RRL (298) in Tucana is quite different when compared with Cetus. The mean period is PRR days (panel f) of Figure 3) and suggests an OoI system. Moreover, Tucana hosts a sizable sample of first overtones (82) that is almost the 30% of the entire sample, and indeed the RRL population ratio attains a value significantly larger Nc/Ntot=0.23. This means that Tucana could be a “pure” OoI system. This and the evidence that this system hosts a high fraction of mixed-mode variables (60) makes Tucana a very interesting laboratory to investigate the occurrence of this still poorly understood pulsation phenomenon (Bernard et al., 2009). The current results for Cetus and Tucana appear even more appealing if we take into account the fact that they have a similar mean metallicity ([Fe/H]–1.8 dex) and a similar internal abundance dispersion (0.2 dex, Bernard et al. 2009).
Finally, according both to the value of PRR days and to the fraction of RRc, Nc/N, the LMC ([Fe/H]=–1.48, =0.29 dex; Gratton et al. 2004) resembles an OoI system (Soszyński et al., 2009, see Figure 3 panel g)).
The above empirical evidence brings forward a few interesting findings: the RRLs in nearby dSphs show similar period distributions, with pulsation properties ranging from OoI to OoII globulars, but the exact classification does depend on the diagnostic adopted to parameterize the pulsation properties. None of these dSph’s can be described as a clean example of either OoI or OoII according to all available classification criteria, with the only exception of Tucana, suggesting that the HB and the RGB luminosity function of this last system deserve a more detailed analysis. The RRLs in the LMC also show different properties, but this might be a consequence of the broad range in metal abundance (Gratton et al., 2004) and/or age shown by the old stellar component. The differences among the other dwarf galaxies and canonical GGCs, considered together, are not yet clearly understood.
A third peak at P –0.55 is present in all the above histograms, possibly strengthening the inference that this feature is more likely an indicator of a spread in metal abundance rather than a population of second-overtone RRLs, as originally suggested by Dall’Ora et al. (2003). We note here that current nonlinear pulsation models do not predict second overtone pulsators (see Bono et al., 1997) among RR Lyrae stars.
Panel h) of Figure 3 shows the period distribution of the ACs in Carina. The period distribution of these variables ranges from to with a well defined peak at and a secondary group located in the short period range ( –0.2). To begin to interpret the pulsation properties of ACs in Carina, we compared their period distributions with similar samples of ACs in Leo I, Fornax, and the LMC. The period distribution of the ACs in Leo I (Fiorentino et al., 2012, see Figure 3, panel i)) peaks at periods that are systematically longer than in Carina, and indeed the mean period is systematically longer (1.20.1 vs 0.80.1 days). Moreover, the ACs in Leo I also show a tail in the long-period range ( 0.2–0.6) that is not present in Carina.
The period distribution of ACs in Fornax (panel j) of Figure 3) is even more puzzling, since it shows two well-defined peaks. However, in contrast with the Carina and Leo I samples, the main peak of the Fornax ACs is in the short-period range (–0.25). This is a peculiar feature, since the number of ACs in this period range is in the other dSphs small (see also the case of LMC in panel n) of Figure 3).
The number of ACs currently known in Sculptor, Cetus and Tucana does not allow us to reach any firm conclusion concerning their pulsation properties.
The period distribution of the ACs in the LMC ranges from to (see panel n) of Figure 3) with a well defined mode at –0.1. The period histogram is characterized by a broad distribution extending across both the short and the long period range.
The above findings indicate that the ACs in nearby dSphs display significant differences among these stellar systems. The same conclusion applies to ACs in the LMC, thus suggesting that the intermediate-age star formation and enrichment history of these systems followed different paths (Fiorentino & Monelli, 2012). In this context it is worth recalling that ACs in Leo I display a period distribution more skewed toward longer periods than ACs in the LMC. This evidence might be the consequence either of a very recent star formation episode or a systematic difference in metal abundance or both.
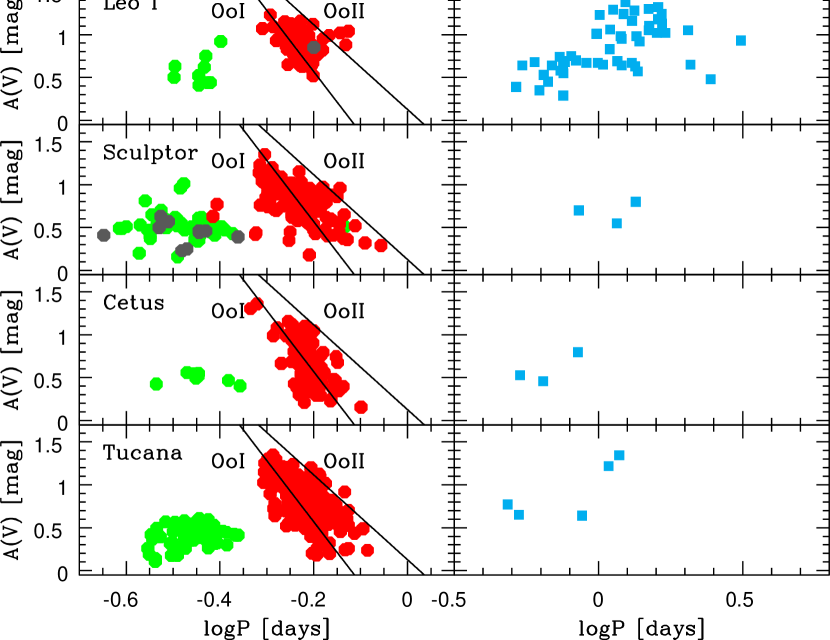
4.2 The Period-Amplitude Diagram
To further investigate the pulsation properties of helium burning variable stars in Carina we also adopted the Bailey diagram, i.e., the luminosity amplitude vs logarithmic period. From top to bottom, the first two left panels of Figure 4 show, once again, that the RRLs in Carina and in Leo I (Stetson et al. 2013, in preparation) have similar properties. Indeed, the RRab variables display -band amplitudes that are between the normal trend of OoI and OoII globular clusters (black solid lines). However, the RRc in Carina cover a slightly broader range in periods when compared with RRc in Leo I. It is worth mentioning that both the Blazhko and double-mode RRLs cover very limited ranges of period. The former group clusters around P –0.25 to –0.20, while the latter is concentrated around P –0.40. The comparison with Leo I is hampered by the fact that only two Blazhko RRLs are currently known in this system.
Moving to the lower panels, the RRab in Sculptor, Cetus and Tucana cover a broad range of both periods and amplitudes, but they seem to be in better agreement with the properties of OoI globulars. The RRc in Carina, Sculptor, Cetus and Tucana show similar behavior, displaying the so-called “bell-shaped” distribution, more typical of OoII globular clusters (Bono et al., 1997a). However, the spread in amplitudes and periods of RRc in Carina and in Cetus is significantly smaller than in Sculptor and in Tucana. This empirical evidence further suggests that the spread in metallicity of the old stellar population in Carina and in Cetus is smaller than in Sculptor and in Tucana. The broad RRc period distribution of Sculptor and Tucana might also be affected by evolutionary effects (Bono et al., 1997b, see their Figure 11). The RRab in Tucana display, at fixed period, a broad range in amplitudes. However, they appear to be more similar to OoII than to OoI type. This further support the evidence that Tucana is mainly an OoI system. Finally, we mention that, unlike those in Carina, the Blazhko RRLs in Sculptor are RRc variables and cover a broad range in period.
The data plotted in the right panels indicate, once again, that ACs in Carina and Leo I show quite different properties. In the latter system a majority ( 60%) of ACs have -band amplitudes larger than 0.9 mag, while in the firts only five out of the 18 ACs ( 28%) have such large amplitudes. The current analysis is hampered by the fact that we still lack a solid diagnostic to discriminate between fundamental and first-overtone ACs. Carina contains two short-period ACs with small -band amplitudes (0.1–0.2 mag), but their position in the Period-Wesenheit diagram does not appear to be peculiar (see below).
It is worth noticing that, according to the Bailey diagram, the four peculiar variables (V14, V149, V158 and V182, indicated by blue circles) appear to be candidate ACs, and indeed they attain amplitudes similar to the other ACs in the same period range. However, two (V158, V182) out of the four might be candidate RRL stars. The reason is twofold: a) they are located in the same region of the Bailey diagram as the other RRLs, while the variables V14 and V149 exhibit amplitudes that are too large for their periods; b) they are both fainter and redder than the other ACs (cf. Figure 2). The hypothesis that V158 and V182 are candidate RRL stars was first suggested by Monelli et al. (2003). In particular, these authors suggested that V158 and V182 might be the aftermath of intermediate-mass stars that during their evolution experienced violent mass-loss events. The existence of this class of objects has been soundly demonstrated by Pietrzyński et al. (2012). They identified an RR Lyrae-like variable in an eclipsing binary system (RRLYR-02792) located in the Galactic bulge and provided a firm estimate of its dynamical mass. They found that its mass is 0.26 , thus confirming its peculiar nature. This object mimics a typical RRL, but its evolutionary status is significantly different. The main energy source of this low-mass variable seems to be hydrogen-shell burning, since current theoretical and empirical constraints indicate that central helium burning—typical of RRLs—can take place only in structures more massive than 0.5 (Castellani et al., 2007). The peculiar evolutionary history of RRLYR-02792 is also supported by the fact it is characterized by a large negative period derivative (–8.42.6 10-6 days/year), thus further supporting the difference with canonical RRLs for which the same derivative is typically two orders of magnitude smaller (Kunder et al., 2011). Interestingly enough, the prototype of this new class of variable stars in the Bailey diagram is located (cyan cross) very close to V158, i.e., one of the two peculiar candidate RRLs. Unfortunately, the current data do not allow us to estimate the period derivatives of V158 and V182.
To further investigate the nature of the two peculiar RRL candidates, we considered whether they might be either evolved RRL or candidate type II Cepheids (P2C). To our knowledge P2C variables have been identified only in Fornax by Bersier & Wood (2002), but they might also be present in Carina. Figure 5 shows the predicted ,() CMD of the scaled-solar metal-poor helium burning sequence plotted in Figure 1, together with the blue edge for first overtone pulsators and the red edge for fundamental pulsators. Using the pulsation relation provided by Di Criscienzo et al. (2004), we found that the periods at the intersection between the ZAHB and the instability strip are =0.279 and =0.787 days, where the former has been fundamentalized. This period range agrees quite well with the observed range of Carina RRLs. To further investigate the possibility either of evolved RRLs or P2C we took into account the off-ZAHB evolution of two old HB stellar structures with stellar masses smaller than the typical masses of RRLs (0.70 0.75). The two green lines cross, as expected, the instability strip at higher luminosity, and therefore they produce RRLs with longer periods. The structure with =0.65 at the intersection between the ZAHB and the instability strip gives periods of =0.371 and =1.131 days, while the structure with =0.60 gives periods of =0.558 and =1.530 days. These findings further indicate that the period of the two peculiar RRLs (V158, 0.632 days; V182, 0.778 days) are too short compared with the predicted ones. Indeed pulsation and evolutionary prescriptions indicate that pulsators located close to red edge of the instability strip and at least one-half magnitude brighter than typical RRLs should have periods longer than one day, i.e., they should be P2C of the BL Herculis type (Marconi & Di Criscienzo, 2007; Marconi et al., 2011).
4.3 The Period-Wesenheit relation
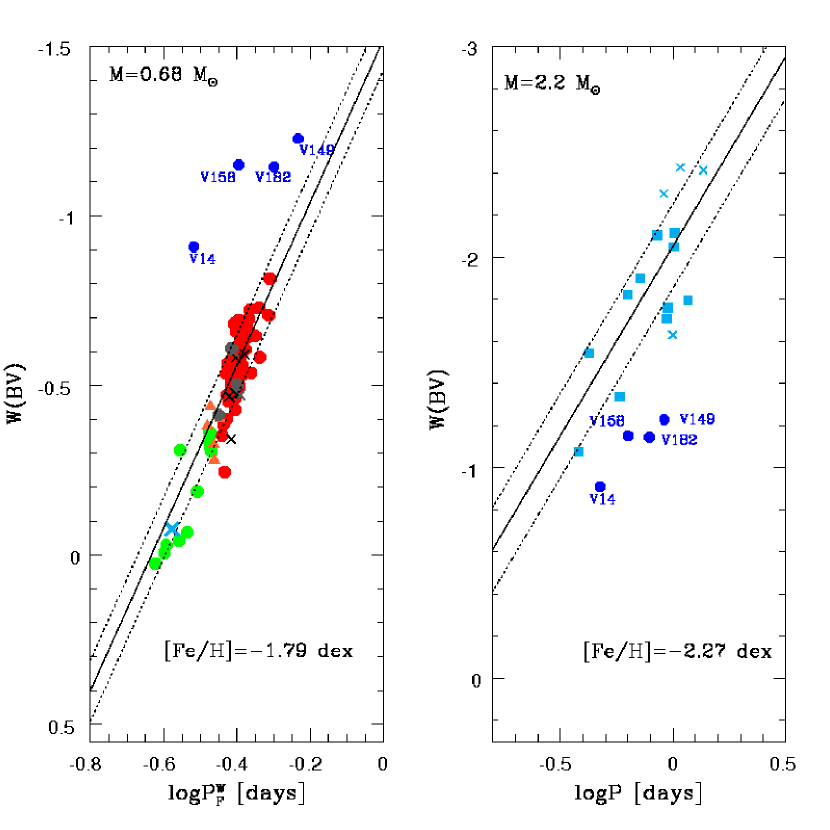
Additional insights about the evolutionary status of the four peculiar variables, can be obtained adopting the Period-Wesenheit (PW) relation. The main advantage in using Wesenheit magnitudes is that they are reddening-free by definition, being estimated using both apparent magnitudes and colors linked by a coefficient given by an extinction law (see e.g. Marconi et al., 2004, and references therein). Note that we do not expect, a priori, that foreground or internal reddening in Carina will be a serious issue for our work; at Galactic longitude and latitude the foreground extinction is expected to be small and indeed we have previously adopted E(B-V) = 0.03 mag for this direction (cf. Figure 2), and no interstellar material has yet been identified within Carina. A secondary advantage of the Wesenheit magnitude is that it also largely removes the dependence of period on temperature at fixed luminosity, resulting from the finite width of the instability strip: loci of constant period on the observational CMD are nearly parallel to the reddening vector (see e.g. Stetson et al., 1998). The Wesenheit magnitude therefore produces a narrower period-apparent magnitude relation one based on simple - or -band magnitudes. The data plotted in Figure 6 show the PW relations for Carina RRLs (left panel) and ACs (right panel). The solid lines show the predicted PW relations at constant mass and metallicity according to pulsational models for RRLs computed by Di Criscienzo et al. (2004) and for ACs computed by Marconi et al. (2004). The dotted lines display the intrinsic dispersion of the above relations. The left panel shows the Wesenheit magnitude versus the P. This parameter depends on the period (RRc variables were fundamentalized), the mass and the metallicity according to the following relation:
| (1) |
where the symbols have their usual meaning (see for more details Di Criscienzo et al. 2004). Adopting the iron abundance and the mean mass indicated in left panel of Figure 6, we found a true distance modulus of =20.090.07(intrinsic)0.1 (systematic) mag. The intrinsic error estimate accounts for uncertainties in the mean RRL magnitudes, the photometric zero points, and the intrinsic dispersion of the theoretical PW diagram. The systematic errors account for uncertainties in the pulsational models. The peculiar nature of the above variables is further indicated by the fact that they exhibit Wesenheit magnitudes that are, at fixed period, systematically brighter than typical RRLs. The difference is at the 3 level, on average.
The empirical scenario becomes even more puzzling if we consider the PW relations of ACs. Two (V14, V158) out of the four peculiar variables have Wesenheit magnitudes relatively close to the AC PW relation for the stellar mass and chemical composition indicated (Marconi et al., 2004), while the other two are on average 6 fainter. However, the spread in magnitude of the AC PW relation is significantly larger than for RRL (0.2 vs 0.09 mag), thus suggesting that this is not a robust diagnostic of the evolutionary status of intermediate-age helium-burning variable stars. This evidence is further supported by the fact that the candidate short-period classical Cepheids (brighter ACs) seem to obey the same PW relation. The width of the observed AC PW relation is mainly due to a dispersion in mass and partially to evolutionary effects and mode identification.
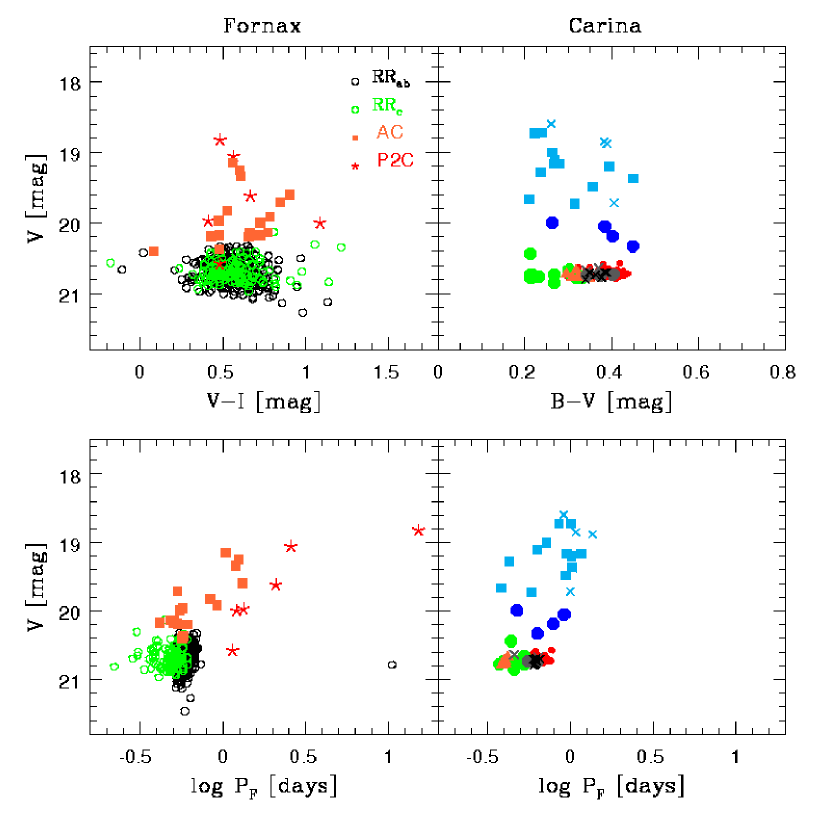
Finally, we decided to compare in more detail the Carina evolved variable stars with their counterparts in Fornax, even if the census of evolved variable stars in this system is still far from being complete (Bersier & Wood, 2002). To this end, the apparent magnitudes of RRLs in Fornax were rescaled to the apparent magnitude of RRLs in Carina assuming a true distance modulus of =20.62 mag and a reddening of E(B-V)=0.025 mag (Bersier, 2000; Bersier & Wood, 2002). The data plotted in the top left panel of Figure 7 show that the distribution of evolved variables in Fornax is significantly different from that observed in Carina. Canonical RRLs in Carina are separated from canonical ACs by almost one magnitude, while in Fornax there is an almost continuous transition between RRLs, ACs and P2Cs. The lack of a clear separation between RRL and ACs is suspicious, since evolutionary models predict a steady increase in luminosity when moving from the ZAHB to the intermediate-age helium burning sequence and a minimum gap of mag between the ZAHB and the evolved variable magnitude level is expected even in the most metal poor regime (see Figure 7 in Caputo et al., 2004, for details). However, a spread in metallicity could cause a spread in visual magnitude, and in turn smear out the separation between RRLs and ACs.
To further investigate this interesting point, we performed the same comparison but in the V-magnitude logarithmic period plane. Data plotted in the bottom panels show that Carina RRLs and ACs are well separated. On the other hand, the Fornax ACs split into two different groups: the short period group (–0.1) overlaps with RRLs, while the long-period group (–0.1) is, at fixed period, brighter than the P2Cs. The long-period group has a canonical behavior, since ACs are approximately a factor of three more massive than than P2C and, at fixed period, they should be brighter. The short-period group appears peculiar, since their periods (0.44–0.56 days) cover the same period range as the evolved RRLs (see the discussion concerning the nature of the two peculiar RRL candidates in Carina). This preliminary evidence, if supported by new and more detailed investigations on Fornax evolved variables, might explain the peculiar peak in the period distribution of Fornax ACs.
5 Conclusions and final remarks
We have presented a new census and analysis of helium-burning variable stars in the Carina dSph. Their observed properties have been compared with theoretical predictions to constrain their evolutionary and pulsational status and their distance. The main results of our analysis are the following:
-
i)
we have identified eight new RRLs that are found to share the same general properties as the whole sample. In particular, they agree quite well with the predicted ZAHB and instability strip for a metallicity ranging from [Fe/H]=–1.79 to –1.49 dex. The RRL period distribution shows a remarkable similarity with the RRLs in Leo I, Fornax and the LMC. Using the theoretical PW relation for the metallicity and the stellar mass inferred from the comparison with the theoretical ZAHB, we found a true distance modulus =20.090.070.1 mag that agrees quite well with previous estimates in the literature (Pietrzyński et al., 2003, 2009).
-
ii)
We have identified four new ACs with periods around one day. The comparison with evolutionary predictions suggests that the stellar mass of these objects ranges from 2.0 to 2.4 M⊙. The current empirical evidence indicates that the bright tail of the distribution might be short-period classical Cepheids. This means that Carina and Leo I (Fiorentino et al., 2012) are good laboratories to study the transition from intermediate-mass stars characterized by quiescent central helium burning (M/M⊙2.2), producing classical Cepheids, to those burning helium in an electron-degenerate core (M/M⊙2.2), producing ACs. We also found that the period distribution of ACs is quite different among nearby dwarf galaxies. This occurence might indicate that the star formation history in the last few Gyrs differs strongly from system to system. This finding supports recent results by Fiorentino et al. (2012).
-
iii)
We have investigated the properties of four already known variables that appear to be peculiar in the CMD, since their mean magnitudes are intermediate between RRLs and ACs. The comparison between predicted and observed periods indicates that they cannot be of the BL Her type, i.e., low-mass (M/M⊙0.50 to 0.60) HB stars evolving from the blue (hot) to the red (cool) region of the CMD and crossing the instability strip at luminosities brighter than typical RRLs. We found that their periods are 30% shorter than predicted by pulsation models (typically in the range from 0.7 to 1.3 days). According to the Bailey diagram two (V14, V149) out of the four appear to be candidate ACs, whereas the variables V158 and V182 might be peculiar RRLs as already suggested by Monelli et al. (2003). It is also interesting to note that in the Bailey diagram the variable V158 is located very close to the prototype —RRLYR-02792—of a new group of variable stars recently discovered by Pietrzyński et al. (2012) and investigated by Smolec et al. (2013). This new group of variables mimics the properties of typical RRLs, but they have a mass that is a factor of two smaller. This suggests that they are intermediate-mass stars that have experienced violent mass-loss events.
-
iv)
A firm quantitative analysis of evolved variable stars in nearby dwarfs requires not only homogenous and accurate multiband photometry, but also time series data that cover a broad time interval. Only these data can open the path to a thorough spectroscopic investigation that can allow us to investigate how the environment, the chemical composition and the star formation history affect their evolutionary and pulsation properties.
The above findings further emphasize the key role that evolved variable stars in dSphs can play to constrain the evolutionary and pulsation properties of low- and intermediate-mass stars. The similarity of the old stellar populations traced by RRLs in nearby stellar systems indicates that the early star formation in these systems was quite homogeneous. On the other hand, the difference in the intermediate-age populations, as traced by ACs, suggests that recent star formation events in these systems does differ strongly from system to system.
It goes without saying that detailed investigations of the pulsational properties of evolved variables in nearby isolated systems can shed new light on their individual properties and on their environmental influences.
It is a real pleasure to thank an anonymous referee for his/her very positive opinion concerning the content of our paper and for his/her valuable comments.
References
- Battaglia et al. (2008) Battaglia, G., Helmi, A., Tolstoy, E., et al. 2008, ApJ, 681, L13
- Bernard et al. (2009) Bernard, E. J., Monelli, M., Gallart, C., et al. 2009, ApJ, 699, 1742
- Bersier (2000) Bersier, D. 2000, ApJ, 543, L23
- Bersier & Wood (2002) Bersier, D., & Wood, P. R. 2002, AJ, 123, 840
- Bono et al. (1994) Bono, G., Caputo, F., & Stellingwerf, R. F. 1994, ApJ, 423, 294
- Bono et al. (1997a) Bono, G., Caputo, F., Castellani, V., & Marconi, M. 1997, A&AS, 121, 327 (a)
- Bono et al. (1997b) Bono, G., Caputo, F., Cassisi, S., Incerpi, R., & Marconi, M. 1997, ApJ, 483, 811 (b)
- Bono et al. (1997) Bono, G., Caputo, F., Cassisi, S., et al. 1997, ApJ, 477, 346
- Bono et al. (2010) Bono, G., Stetson, P. B., Walker, A. R., et al. 2010, PASP, 122, 651
- Caputo et al. (2004) Caputo, F., Castellani, V., Degl’Innocenti, S., Fiorentino, G., & Marconi, M. 2004, A&A, 424, 927
- Caputo et al. (2005) Caputo, F., Bono, G., Fiorentino, G., Marconi, M., & Musella, I. 2005, ApJ, 629, 1021
- Castellani et al. (2007) Castellani, V., Calamida, A., Bono, G., et al. 2007, ApJ, 663, 1021
- Chilingarian et al. (2011) Chilingarian, I. V., Mieske, S., Hilker, M., & Infante, L. 2011, MNRAS, 412, 1627
- Clement & Rowe (2000) Clement, C. M., & Rowe, J. 2000, AJ, 120, 2579
- Clement et al. (2001) Clement, C. M., Muzzin, A., Dufton, Q., et al. 2001, AJ, 122, 2587
- Clementini et al. (2005) Clementini, G., Ripepi, V., Bragaglia, A., et al. 2005, MNRAS, 363, 734
- Dall’Ora et al. (2003) Dall’Ora, M., Ripepi, V., Caputo, F., et al. 2003, AJ, 126, 197
- Dall’Ora et al. (2012) Dall’Ora, M., Kinemuchi, K., Ripepi, V., et al. 2012, ApJ, 752, 42
- Di Criscienzo et al. (2004) Di Criscienzo, M., Marconi, M., & Caputo, F. 2004, ApJ, 612, 1092
- Fabrizio et al. (2011) Fabrizio, M., Nonino, M., Bono, G., et al. 2011, PASP, 123, 902,
- Fabrizio et al. (2012) Fabrizio, M., Merle, T., Thévenin, F., et al. 2012, PASP, 124, 519
- Fiorentino et al. (2012) Fiorentino, G., Stetson, P. B., Monelli, M., et al. 2012, ApJ, 759, L12
- Fiorentino & Monelli (2012) Fiorentino, G., & Monelli, M. 2012, A&A, 540, A102
- Gratton et al. (2004) Gratton, R. G., Bragaglia, A., Clementini, G., et al. 2004, A&A, 421, 937
- Hill (2010) Hill, V. 2010, IAU Symposium, 265, 219
- Inno et al. (2013) Inno, L., Matsunaga, N., Bono, G., et al. 2013, ApJ, 764, 84
- Landolt (1992) Landolt, A. U. 1992, AJ, 104, 340
- Lanfranchi et al. (2006) Lanfranchi, G. A., Matteucci, F., & Cescutti, G. 2006, A&A, 453, 67
- Kaluzny et al. (1995) Kaluzny, J., Kubiak, M., Szymanski, M., et al. 1995, A&AS, 112, 407
- Kinemuchi et al. (2008) Kinemuchi, K., Harris, H. C., Smith, Horace A., et al. 2008, AJ, 136, 1921
- Kirby et al. (2009) Kirby, E. N., Guhathakurta, P., Bolte, M., Sneden, C., & Geha, M. C. 2009, ApJ, 705, 328
- Kirby et al. (2011) Kirby, E. N., Lanfranchi, G. A., Simon, J. D., Cohen, J. G., & Guhathakurta, P. 2011, ApJ, 727, 78
- Kuehn et al. (2008) Kuehn, C., Kinemuchi, K., Ripepi, V., et al. 2008, ApJ, 674, L81
- Kunder et al. (2011) Kunder, A., Walker, A., Stetson, P. B., et al. 2011, AJ, 141, 15
- Mannucci et al. (2010) Mannucci, F., Cresci, G., Maiolino, R., Marconi, A., & Gnerucci, A. 2010, MNRAS, 408, 2115
- Marconi et al. (2004) Marconi, M., Fiorentino, G., & Caputo, F. 2004, A&A, 417, 1101
- Marconi & Di Criscienzo (2007) Marconi, M., & Di Criscienzo, M. 2007, A&A, 467, 223
- Marconi et al. (2011) Marconi, M., Bono, G., Caputo, F., et al. 2011, ApJ, 738, 111
- Mateo et al. (1998) Mateo, M., Hurley-Keller, D., & Nemec, J. 1998, AJ, 115, 1856
- Matsunaga et al. (2011) Matsunaga, N., Feast, M. W., & Soszyński, I. 2011, MNRAS, 413, 223
- Minniti et al. (2003) Minniti, D., Borissova, J., Rejkuba, M., et al. 2003, Science, 301, 1508
- Musella et al. (2009) Musella, I., Ripepi, V., Clementini, G., et al. 2009, ApJ, 695, L83
- Musella et al. (2012) Musella, I., Ripepi, V., Marconi, M., et al. 2012, ApJ, 756, 121
- Lemasle et al. (2012) Lemasle, B., Hill, V., Tolstoy, E., et al. 2012, A&A, 538, A100
- Monelli et al. (2003) Monelli, M., Pulone, L., Corsi, C. E., et al. 2003, AJ, 126, 218
- Monelli et al. (2012) Monelli, M., Bernard, E. J., Gallart, C., et al. 2012, MNRAS, 422, 89
- Moretti et al. (2009) Moretti, M. I., Dall’Ora, M., Ripepi, V., et al. 2009, ApJ, 699, L125
- Nemec et al. (1988) Nemec, J. M., Wehlau, A., & Mendes de Oliveira, C. 1988, AJ, 96, 528
- Oosterhoff (1939) Oosterhoff, P. T. 1939, The Observatory, 62, 104
- Ripepi et al. (2012) Ripepi, V., Moretti, M. I., Marconi, M., et al. 2012, MNRAS, 424, 1807
- Pietrinferni et al. (2004) Pietrinferni, A., Cassisi, S., Salaris, M., & Castelli, F. 2004, ApJ, 612, 168
- Pietrzyński et al. (2003) Pietrzyński, G., Gieren, W., & Udalski, A. 2003, AJ, 125, 2494
- Pietrzyński et al. (2006) Pietrzyński, G., Gieren, W., Soszyński, I., et al. 2006, ApJ, 642, 216
- Pietrzyński et al. (2009) Pietrzyński, G., Górski, M., Gieren, W., et al. 2009, AJ, 138, 459
- Pietrzyński et al. (2010) Pietrzyński, G., Gieren, W., Hamuy, M., et al. 2010, AJ, 140, 1475
- Pietrzyński et al. (2012) Pietrzyński, G., Thompson, I. B., Gieren, W., et al. 2012, Nature, 484, 75
- Pritzl et al. (2005) Pritzl, B. J., Armandroff, T. E., Jacoby, G. H., & Da Costa, G. S. 2005, AJ, 129, 2232
- Smolec et al. (2013) Smolec, R., Pietrzyński, G., Graczyk, D., et al. 2013, MNRAS, 428, 3034
- Soszyński et al. (2008) Soszyński, I., Udalski, A., Szymański, M. K., et al. 2008, Acta Astron., 58, 293
- Soszyński et al. (2009) Soszyński, I., Udalski, A., Szymański, M. K., et al. 2009, Acta Astron., 59, 1
- Stetson (1987) Stetson, P. B. 1987, PASP, 99, 191
- Stetson (1994) Stetson, P. B. 1994, PASP, 106, 250
- Stetson et al. (1998) Stetson, P. B., Saha, A., Ferrarese, L., et al. 1998, ApJ, 508, 491
- Stetson (2000) Stetson, P. B. 2000, PASP, 112, 925
- Stetson (2005) Stetson, P. B. 2005, PASP, 117, 563
- Stetson et al. (2011) Stetson, P. B., Monelli, M., Fabrizio, M., et al. 2011, The Messenger, 144, 32
- Szewczyk et al. (2008) Szewczyk, O., Pietrzyński, G., Gieren, W., et al. 2008, AJ, 136, 272
- Szewczyk et al. (2009) Szewczyk, O., Pietrzyński, G., Gieren, W., et al. 2009, AJ, 138, 1661
- Venn et al. (2012) Venn, K. A., Shetrone, M. D., Irwin, M. J., et al. 2012, ApJ, 751, 102
- Welch & Stetson (1993) Welch, D. L., & Stetson, P. B. 1993, AJ, 105, 1813

| Run ID | Dates | Telescope | Camera | Multiplex | ||||||
|---|---|---|---|---|---|---|---|---|---|---|
| 1 | ct92: | 1992 12 19-22 | CTIO 1.5m | Tek2K-1 | – | 30 | – | – | 42 | |
| 2 | wfi3: | 1999 03 17 | MPI/ESO 2.2m | WFI | – | – | 1 | – | – | |
| 3 | fors9912: | 1999 12 02 | ESO VLT 8.0m | FORS1 | – | – | 1 | – | 1 | |
| 4 | wfi15: | 1999 12 15-19 | MPI/ESO 2.2m | WFI | – | – | 52 | – | 16 | |
| 5 | B00jan: | 1999 12 30-2000 01 10 | CTIO 4.0m | Mosaic2 | – | 48 | 48 | – | – | |
| 6 | wfi17: | 1999 12 31-2000 01 07 | MPI/ESO 2.2m | WFI | – | 45 | 48 | – | 4 | |
| 7 | W00jan: | 2000 01 06-08 | MPI/ESO 2.2m | WFI | – | 26 | 28 | – | – | |
| 8 | wfi22: | 2000 02 26 | MPI/ESO 2.2m | WFI | – | 13 | 12 | – | 12 | |
| 9 | wfi21: | 2000 03 05 | MPI/ESO 2.2m | WFI | – | 2 | 2 | – | 2 | |
| 10 | wfi14: | 2000 10 29-01 | MPI/ESO 2.2m | WFI | 5 | 8 | 8 | – | – | |
| 11 | cg: | 2001 01 17-18 | CTIO 4.0m | Mosaic2 | – | – | 6 | – | 12 | |
| 12 | B02oct: | 2002 10 31 | CTIO 4.0m | Mosaic2 | – | 5 | 5 | – | – | |
| 13 | B02nov: | 2002 11 29 | CTIO 4.0m | Mosaic2 | – | 5 | 5 | – | – | |
| 14 | B03jan: | 2003 01 02 | CTIO 4.0m | Mosaic2 | – | 4 | 3 | – | – | |
| 15 | double: | 2003 01 02 | CTIO 4.0m | Mosaic2 | – | – | 1 | – | – | |
| 16 | wfi19: | 2003 03 05-07 | MPI/ESO 2.2m | WFI | – | 19 | 15 | – | – | |
| 17 | B03octa: | 2003 10 27 | CTIO 4.0m | Mosaic2 | – | 5 | 7 | – | – | |
| 18 | B03nov: | 2003 11 28 | CTIO 4.0m | Mosaic2 | – | 8 | 10 | – | – | |
| 19 | B04jan: | 2004 01 22-23 | CTIO 4.0m | Mosaic2 | – | 13 | 15 | – | – | |
| 20 | B04jan29: | 2004 01 29 | CTIO 4.0m | Mosaic2 | – | 1 | 1 | – | – | |
| 21 | B04dec11: | 2004 12 12 | CTIO 4.0m | Mosaic2 | 4 | – | 5 | – | 7 | |
| 22 | B04dec19: | 2004 12 20 | CTIO 4.0m | Mosaic2 | 6 | – | – | – | 12 | |
| 23 | wfi29: | 2008 09 28-10 07 | MPI/ESO 2.2m | WFI | – | 14 | 14 | 14 | 14 |
Notes:
1 Observers: T. Smecker-Hane, P. B. Stetson;
2 Program ID: unknown, observer unknown;
3 Program ID: 64.N-0421(A);
4 Program ID: 000.H-0597;
5 Observers: A. Walker, C. Smith;
6 Program IDs: 064.N-0512, 0164.N-0210,064.L-0327;
7 Program ID: a064.L-0327; proprietary data not found in the archive;
8 Program ID: 164.O-0561(E), observer M. Schirmer;
9 Program ID: 064.N-0564, observer V. Testa;
10 Program ID: 164.O-0089(A), observer V. Ripepi;
11 Observers: C. Gallart, J. P. Garcia;
12 Proposal ID: 2002B-0077, observer A. Walker;
13 Proposal ID: 2002B-0077, observer A. Walker;
14 Observer: A. Walker;
15 Observer: A. Walker, single exposure missing from Run #14;
16 Program ID: 70.B-0635(A); #3 non-functional;
18 Observer: A. Walker; chip #3 non-functional;
19 Proposal ID: 2004b-051, observer A. Walker; chip #3 non-functional;
20 Observers: C. Aguilera, C. Smith, A. Walker; chip #3 non-functional;
21 Observer: A. Walker;
22 Observers: A. Walker, M. Monelli;
23 Program ID: 081.A-9026(A).
| ID | Type | Period | (V)a | (B)a | AV | AB | |||
|---|---|---|---|---|---|---|---|---|---|
| (days) | (mag) | (mag) | (mag) | (mag) | (mag) | (mag) | |||
| V7 | RRab | 0.603314 | 20.766 | 20.715 | 21.159 | 21.081 | 1.082 | 1.265 | |
| V10 | RRab | 0.58451541 | 20.765 | 20.712 | 21.168 | 21.085 | 1.070 | 1.311 | |
| V11 | RRd | 0.405505 | 20.780 | 20.770 | 21.095 | 21.079 | 0.413 | 0.498 | |
| V14 | AC | 0.4766970 | 20.027 | 19.997 | 20.303 | 20.260 | 0.749 | 0.886 | |
| V17 | EB | 0.3933399 | 19.604 | 19.603 | 20.968 | 20.967 | 0.157 | 0.184 | |
| V22 | RRab | 0.6380664 | 20.769 | 20.755 | 21.180 | 21.156 | 0.569 | 0.706 | |
| V24 | RRab | 0.6182002 | 20.738 | 20.712 | 21.138 | 21.096 | 0.729 | 0.914 | |
| V26 | RRd | 0.419218 | 20.684 | 20.673 | 21.008 | 20.991 | 0.488 | 0.532 | |
| V27 | AC | 1.020387 | 19.409 | 19.369 | 19.887 | 19.819 | 0.950 | 1.221 | |
| V29 | AC | 0.7178805 | 19.043 | 19.008 | 19.323 | 19.271 | 0.809 | 1.005 | |
| V30 | RRab | 0.618813 | 20.798 | 20.774 | 21.210 | 21.173 | 0.713 | 0.890 | |
| V31 | RRab | 0.6457939 | 20.765 | 20.754 | 21.166 | 21.149 | 0.473 | 0.584 | |
| V33 | AC | 0.5836253 | 19.753 | 19.731 | 20.077 | 20.046 | 0.639 | 0.773 | |
| V34 | RRab | 0.5869487 | 20.804 | 20.758 | 21.174 | 21.103 | 1.079 | 1.302 | |
| V40 | RRc | 0.3926230 | 20.796 | 20.784 | 21.133 | 21.116 | 0.446 | 0.544 | |
| V43 | RRc | 0.2992490 | 20.748 | 20.735 | 20.971 | 20.952 | 0.476 | 0.572 | |
| V47 | RRc | 0.3237693 | 20.786 | 20.764 | 21.026 | 20.995 | 0.639 | 0.735 | |
| V49 | RRab | 0.6815054 | 20.706 | 20.696 | 21.118 | 21.102 | 0.419 | 0.535 | |
| V57 | RRab | 0.6129004 | 20.809 | 20.787 | 21.233 | 21.198 | 0.676 | 0.834 | |
| V60 | RRab | 0.6094138 | 20.787 | 20.756 | 21.194 | 21.147 | 0.833 | 1.013 | |
| V61 | RRab | 0.6213529 | 20.709 | 20.682 | 21.129 | 21.086 | 0.749 | 0.910 | |
| V65 | RRab | 0.6517114 | 20.754 | 20.719 | 21.150 | 21.094 | 0.888 | 1.116 | |
| V67 | RRab | 0.603718 | 20.762 | 20.735 | 21.150 | 21.104 | 0.725 | 0.941 | |
| V68 | RRab | 0.678732 | 20.729 | 20.722 | 21.169 | 21.159 | 0.369 | 0.407 | |
| V73 | RRab | 0.5695186 | 20.819 | 20.761 | 21.174 | 21.091 | 1.151 | 1.307 | |
| V74 | RRc | 0.3982350 | 20.783 | 20.771 | 21.106 | 21.089 | 0.439 | 0.534 | |
| V77 | RR | 0.60431 | 20.754 | 20.731 | 21.178 | 21.134 | 0.730 | 0.869 | |
| V84 | RRab | 0.616665 | 20.755 | 20.726 | 21.119 | 21.080 | 0.827 | 0.901 | |
| V85 | RRab | 0.640514 | 20.677 | 20.654 | 21.081 | 21.047 | 0.689 | 0.828 | |
| V87 | AC | 0.855616 | 18.742 | 18.728 | 18.987 | 18.967 | 0.483 | 0.584 | |
| V89 | RRd | 0.387544 | 20.790 | 20.785 | 21.145 | 21.132 | 0.338 | 0.461 | |
| V90 | RRab | 0.631361 | 20.816 | 20.796 | 21.239 | 21.205 | 0.625 | 0.786 | |
| V91 | RRab | 0.7180700 | 20.697 | 20.683 | 21.133 | 21.109 | 0.566 | 0.726 | |
| V92 | RRab | 0.6301265 | 20.767 | 20.749 | 21.205 | 21.177 | 0.627 | 0.761 | |
| V105 | RRab | 0.6323024 | 20.710 | 20.690 | 21.139 | 21.107 | 0.681 | 0.801 | |
| V115 | AC | 1.010975 | 18.751 | 18.731 | 18.980 | 18.953 | 0.601 | 0.678 | |
| V116 | RRab | 0.6833130 | 20.786 | 20.763 | 21.192 | 21.153 | 0.728 | 0.920 | |
| V122 | RRab | 0.6314708 | 20.695 | 20.672 | 21.096 | 21.059 | 0.719 | 0.873 | |
| V123 | RRab | 0.674967 | 20.690 | 20.670 | 21.114 | 21.082 | 0.687 | 0.778 | |
| V124 | RRab | 0.5917212 | 20.709 | 20.672 | 21.099 | 21.042 | 0.884 | 1.069 | |
| V125 | RRab | 0.5940966 | 20.693 | 20.640 | 21.044 | 20.963 | 1.104 | 1.326 | |
| V126 | RR | 0.5570978 | 20.787 | 20.742 | 21.130 | 21.085 | 1.034 | 0.959 | |
| V127 | RR | 0.626010 | 20.760 | 20.747 | 21.146 | 21.121 | 0.472 | 0.704 | |
| V129 | AC | 0.6301751 | 19.141 | 19.105 | 19.428 | 19.374 | 0.799 | 0.988 | |
| V135 | RRab | 0.5909249 | 20.675 | 20.630 | 21.050 | 20.979 | 0.969 | 1.233 | |
| V136 | RRab | 0.631613 | 20.708 | 20.691 | 21.127 | 21.100 | 0.580 | 0.728 | |
| V138 | RRab | 0.6392584 | 20.720 | 20.704 | 21.133 | 21.109 | 0.554 | 0.670 | |
| V141 | RRab | 0.6353331 | 20.754 | 20.740 | 21.170 | 21.147 | 0.528 | 0.685 | |
| V142 | RRc | 0.3635433 | 20.752 | 20.734 | 21.031 | 21.002 | 0.559 | 0.696 | |
| V143 | RRab | 0.6095792 | 20.704 | 20.678 | 21.100 | 21.058 | 0.756 | 0.945 | |
| V144 | RRc | 0.3933563 | 20.677 | 20.665 | 20.985 | 20.967 | 0.431 | 0.556 | |
| V148 | RRc | 0.326654 | 20.460 | 20.441 | 20.680 | 20.654 | 0.600 | 0.692 | |
| V149 | AC | 0.917713 | 20.092 | 20.053 | 20.498 | 20.437 | 0.969 | 1.199 | |
| V151 | RRc | 0.3418011 | 20.866 | 20.852 | 21.140 | 21.119 | 0.468 | 0.584 | |
| V153 | RRab | 0.6603690 | 20.701 | 20.687 | 21.099 | 21.075 | 0.552 | 0.681 | |
| V158 | RR | 0.632464 | 20.342 | 20.332 | 20.800 | 20.781 | 0.468 | 0.630 | |
| V159 | RRab | 0.5751536 | 20.752 | 20.707 | 21.099 | 21.030 | 0.957 | 1.188 | |
| V164 | RRab | 0.633919 | 20.745 | 20.731 | 21.125 | 21.098 | 0.564 | 0.723 | |
| V173 | RGBd | 0.660738 | 18.525 | 18.524 | 19.574 | 19.573 | 0.134 | 0.143 | |
| V174 | RRab | 0.6531168 | 20.768 | 20.759 | 21.189 | 21.175 | 0.397 | 0.498 | |
| V175 | RRc | 0.3923768 | 20.760 | 20.749 | 21.089 | 21.072 | 0.461 | 0.539 | |
| V176 | RRab | 0.764565 | 20.742 | 20.741 | 21.172 | 21.169 | 0.119 | 0.207 | |
| V178 | AC | 1.0155652 | 19.283 | 19.204 | 19.735 | 19.599 | 1.261 | 1.657 | |
| V179 | RRab | 0.663799 | 20.737 | 20.735 | 21.165 | 21.162 | 0.201 | 0.240 | |
| V180 | AC | 0.519033 | |||||||
| V181 | RRc | 0.2794913 | 20.780 | 20.779 | 20.995 | 20.993 | 0.097 | 0.152 | |
| V182 | RR | 0.788970 | 20.198 | 20.192 | 20.603 | 20.594 | 0.337 | 0.411 | |
| V183 | RRab | 0.6140441 | 20.599 | 20.587 | 20.987 | 20.967 | 0.497 | 0.630 | |
| V184 | RRc | 0.3951280 | 20.723 | 20.713 | 21.033 | 21.016 | 0.448 | 0.535 | |
| V185 | RRab | 0.620919 | 20.742 | 20.720 | 21.137 | 21.101 | 0.661 | 0.876 | |
| V186 | RRab | 0.5790123 | 20.828 | 20.775 | 21.160 | 21.075 | 1.092 | 1.319 | |
| V187 | AC | 0.950289 | 19.230 | 19.164 | 19.520 | 19.432 | 1.143 | 1.355 | |
| V188 | RRab | 0.5973782 | 20.726 | 20.676 | 21.092 | 21.016 | 1.087 | 1.330 | |
| V189 | RRab | 0.7023692 | 20.662 | 20.644 | 21.058 | 21.031 | 0.643 | 0.761 | |
| V190 | AC | 1.164708 | 19.255 | 19.166 | 19.555 | 19.447 | 1.459 | 1.480 | |
| V191 | RRab | 0.6502902 | 20.703 | 20.687 | 21.109 | 21.083 | 0.566 | 0.714 | |
| V192 | RRd | 0.405096 | 20.737 | 20.728 | 21.045 | 21.024 | 0.387 | 0.629 | |
| V193 | AC | 0.4263580 | 19.283 | 19.282 | 19.521 | 19.519 | 0.134 | 0.212 | |
| V194 | FVe | 0.2645829 | 16.068 | 16.067 | 15.873 | 15.872 | 0.145 | 0.112 | |
| V195 | RRab | 0.6189680 | 20.782 | 20.769 | 21.146 | 21.126 | 0.500 | 0.611 | |
| V196 | RRab | 0.6674832 | 20.685 | 20.677 | 21.087 | 21.073 | 0.435 | 0.498 | |
| V197 | RRc | 0.2961719 | 20.747 | 20.741 | 20.962 | 20.953 | 0.335 | 0.386 | |
| V198 | RRd | 0.395523 | 20.737 | 20.725 | 21.088 | 21.071 | 0.458 | 0.547 | |
| V199 | RRab | 0.769925 | 20.582 | 20.575 | 21.005 | 20.994 | 0.401 | 0.483 | |
| V200 | RRab | 0.637343 | 20.749 | 20.745 | 21.169 | 21.163 | 0.257 | 0.327 | |
| V201 | RRab | 0.7222442 | 20.756 | 20.738 | 21.162 | 21.135 | 0.631 | 0.774 | |
| V202 | RRab | 0.6150525 | 20.744 | 20.722 | 21.136 | 21.097 | 0.723 | 0.873 | |
| V203 | AC | 0.9398922 | 19.508 | 19.487 | 19.895 | 19.843 | 0.695 | 1.049 | |
| V204 | RRab | 0.6332666 | 20.748 | 20.731 | 21.145 | 21.121 | 0.582 | 0.683 | |
| V205 | AC | 0.3833677 | 19.668 | 19.667 | 19.879 | 19.877 | 0.158 | 0.188 | |
| V206 | RRab | 0.5887446 | 20.757 | 20.699 | 21.149 | 21.048 | 1.097 | 1.444 | |
| V207 | RRd | 0.403913 | 20.778 | 20.765 | 21.106 | 21.088 | 0.528 | 0.598 |
Note. —
a Magnitude-averaged magnitudes;
b Intensity-averaged magnitudes;
c Blazhko candidate;
d Variable located along the RGB;
e Field variable;
f Peculiar RR Lyrae.
| ID | Type | Period | (V)a | (B)a | AV | AB | |||
|---|---|---|---|---|---|---|---|---|---|
| (days) | (mag) | (mag) | (mag) | (mag) | (mag) | (mag) | |||
| V208 | RRab | 0.656588 | 20.716 | 20.703 | 21.112 | 21.091 | 0.508 | 0.624 | |
| V209 | RRab | 0.6123133 | 20.806 | 20.777 | 21.202 | 21.154 | 0.816 | 1.012 | |
| V210 | RR | 0.457815 | 20.647 | 20.639 | 21.023 | 21.009 | 0.378 | 0.497 | |
| V211 | RRab | 0.6194511 | 20.721 | 20.699 | 21.119 | 21.083 | 0.697 | 0.859 | |
| V212 | RRab | 0.6264287 | 20.782 | 20.740 | 21.168 | 21.103 | 0.974 | 1.186 | |
| V213 | RRab | 0.5956516 | 20.745 | 20.705 | 21.119 | 21.054 | 0.987 | 1.241 | |
| V214 | RR | 0.639186 | 20.708 | 20.679 | 21.086 | 21.021 | 0.774 | 1.148 | |
| V215 | RRab | 0.603031 | 20.844 | 20.803 | 21.217 | 21.143 | 0.941 | 1.196 | |
| V216 | AC | 1.079685 | 18.858 | 18.852 | 19.246 | 19.235 | 0.324 | 0.525 | |
| V217 | AC | 0.910935 | 18.625 | 18.599 | 18.899 | 18.860 | 0.689 | 0.853 | |
| V218 | AC | 0.9986934 | 19.734 | 19.719 | 20.153 | 20.125 | 0.504 | 0.680 | |
| V219 | AC | 1.365582 | 18.892 | 18.884 | 19.287 | 19.273 | 0.420 | 0.551 | |
| V220 | EB | 0.18632063 | 14.698 | 14.674 | 15.368 | 15.343 | 0.747 | 0.803 | |
| V221 | WUma | 1.785305 | 19.234 | 19.233 | 20.559 | 20.558 | 0.138 | 0.136 |
a Magnitude-averaged magnitudes;
b Intensity-averaged magnitudes;
c Blazhko candidate.