Broad Absorption Line Quasars with Redshifted Troughs: High-Velocity Infall or Rotationally Dominated Outflows?
Abstract
We report the discovery in the Sloan Digital Sky Survey and the SDSS-III Baryon Oscillation Spectroscopic Survey of seventeen broad absorption line (BAL) quasars with high-ionization troughs that include absorption redshifted relative to the quasar rest frame. The redshifted troughs extend to velocities up to km s-1 and the trough widths exceed 3000 km s-1 in all but one case. Approximately 1 in 1000 BAL quasars with blueshifted C iv absorption also has redshifted C iv absorption; objects with C iv absorption present only at redshifted velocities are roughly four times rarer. In more than half of our objects, redshifted absorption is seen in C ii or Al iii as well as C iv, making low-ionization absorption at least ten times more common among BAL quasars with redshifted troughs than among standard BAL quasars. However, the C iv absorption equivalent widths in our objects are on average smaller than those of standard BAL quasars with low-ionization absorption.
We consider several possible ways of generating redshifted absorption. The two most likely possibilities may be at work simultaneously, in the same objects or in different ones. Rotationally dominated outflows seen against a quasar’s extended continuum source can produce redshifted and blueshifted absorption, but variability consistent with this scenario is seen in only one of the four objects with multiple spectra. The infall of relatively dense and low-ionization gas to radii as small as 400 Schwarzschild radii can in principle explain the observed range of trough profiles, but current models do not easily explain the origin and survival of such gas. Whatever the origin(s) of the absorbing gas in these objects, it must be located at small radii to explain its large redshifted velocities, and thus offers a novel probe of the inner regions of quasars.
keywords:
galaxies: nuclei - quasars: general - quasars: absorption lines1 Introduction
The most luminous active galactic nuclei (AGN) are known as quasars. Broad absorption line (BAL) quasars are those quasars which show ultraviolet absorption troughs thousands of km s-1 wide (e.g., Lynds 1967; Allen et al. 2011), widths for which the accretion process in quasars is thought to be ultimately responsible. The traditional minimum velocity width for a BAL trough is 2000 km s-1 at 10% depth below the continuum (Weymann et al. 1991). Objects with narrower intrinsic absorption troughs, down to 500 km s-1 wide, are often referred to as mini-BAL quasars (e.g., Hamann & Sabra 2004). Objects with intrinsic troughs 500 km s-1 wide are referred to as narrow absorption line (NAL) quasars (see, e.g., Ganguly & Brotherton 2008). Intrinsic troughs are those which arise from gas connected with the accretion process onto the quasar, as opposed to arising elsewhere in the host galaxy, but it is not always possible to determine the origin of a given absorption system. If studying intrinsic quasar absorption regardless of velocity width is the goal, less restrictive minimum width definitions for BAL troughs can be established (Hall et al. 2002; Trump et al. 2006). However, such definitions also run the risk of increased contamination from intervening absorption systems (Knigge et al. 2008). Intervening absorption systems unrelated to the quasar will generally have widths 500 km s-1, but blending and clustering can produce apparently broader absorption profiles, especially in spectra where the resolution or signal-to-noise ratio (or both) is relatively low.
BAL quasars are often subdivided into three subtypes depending on the ionization stages seen in absorption (e.g., Hall et al. 2002). High-ionization BAL quasars (HiBALs) have absorption from C iv 1548,1550 (all wavelengths in Å), N v 1238,1242, and O vi 1031,1037, and are the most common subtype. Low-ionization BAL quasars (LoBALs) have high-ionization absorption plus absorption from C ii 1334, Al iii 1854,1862, and/or Mg ii 2796,2803. Iron low-ionization BAL quasars (FeLoBALs) have high- and low-ionization absorption plus absorption from excited states of Fe ii and/or Fe iii, and are the least common subtype.
BAL troughs are found over a wide range of velocities relative to the quasar, both collectively and in individual objects. The traditional velocity range over which the strength of BAL troughs detected in C iv 1548,1550 is evaluated is 25000 km s-1 to 3000 km s-1 (Weymann et al. 1991), where we adopt the convention that negative velocities denote absorption blueshifted from the quasar redshift. The high-velocity cutoff was established to avoid confusion with Si iv/O iv] 1400 emission and Si iv 1393,1402 BAL troughs; the low-velocity to avoid strong associated narrow-line C iv complexes.
In this paper we adopt the convention that quasars with troughs 2000 km s-1 wide, regardless of the trough velocity offset, are BAL quasars. In that case, the highest velocity known for a BAL outflow is either 56000 km s-1 in PG 2302+029 (Jannuzi et al. 1996) or 66000 km s-1 in H 1414+089 (Foltz et al. 1983).
Extending the velocity limits within which BAL troughs are measured to the widest possible wavelength range accessible in a given quasar sample is necessary if the goal is to study all broad intrinsic absorption in quasars. One drawback of that approach is contamination of low-velocity troughs with complexes of associated narrow-line absorption at the systemic redshift; studies at spectral resolution sufficient to resolve such complexes can help account for this effect. Another drawback is contamination of high-velocity troughs in one transition with low-velocity troughs of a shorter-wavelength transition (e.g., high-velocity C iv 1548,1550 with low-velocity Si iv 1393,1402). Physical considerations based on elemental abundances and ionization fractions can be used to correcly identify troughs in such cases; for example, C iv absorption can be seen without accompanying Si iv, but the reverse is not true (see, e.g., Gibson et al. 2010). As long as care is taken to account for the above effects, the ideal starting velocity for measuring the strength of BAL troughs is easy to define: the starting velocity for a given trough should be chosen to encompass the entire trough in that transition.
In principle, studying BAL troughs may require starting velocities which are redshifted relative to the quasar rest frame. Hall et al. (2002) presented two quasars with Mg ii troughs showing absorption both blueshifted and redshifted111In Hall et al. (2002) we referred to these objects as having longward-of-systemic absorption. Here we drop the use of ‘longward’ in favor of ‘redshifted’. The latter term can be ambiguous, but is valid here in the sense that along our line of sight at least some of the ultraviolet (UV) absorption present in each of these quasars is redshifted relative to the quasar’s systemic redshift. relative to the quasar rest frame: SDSS J112526.12002901.3 (J1125) and SDSS J112828.31011337.9 (J1128). We suggested that these are systems where the quasar’s extended ultraviolet continuum source is seen through an outflow which is dominated along our line of sight by its rotational velocity. This possibility had earlier been raised in the context of NAL outflows by Ganguly et al. (2001, their §5.3).
Here we use data from the Sloan Digital Sky Survey (SDSS; York et al. 2000) and the SDSS-III (Eisenstein et al. 2011) Baryon Oscillation Spectroscopic Survey (BOSS; Dawson et al. 2013),222http://www.sdss3.org/surveys/boss.php discussed in § 2, to present seventeen quasars with broad absorption troughs along our line of sight which are redshifted relative to the quasar’s systemic redshift and are seen in multiple transitions including C iv, Si iv and N v (§ 3). We consider various properties of this population of objects in § 4, discuss several possible explanations for these objects in § 5, and discuss some implications and tests of those explanations in § 6. Notes on confirmed, candidate and rejected objects are presented in the Appendices.
2 Data
The SDSS-I and SDSS-II surveys used two fiber-fed, double spectrographs to obtain resolution 2100 spectra over 3800–9200 Å for 106 galaxies and 105 quasar candidates (Stoughton et al. 2002; Abazajian et al. 2009). The SDSS-III initiative consists of four surveys including the BOSS. The BOSS will obtain spectra of 1.5106 luminous red galaxies and 1.5105 quasars at (Dawson et al. 2013). All known quasars in the BOSS footprint which are point sources in SDSS imaging (Fukugita et al. 1996; Gunn et al. 1998; Aihara et al. 2011a,b), including BAL quasars, are being targeted (Ross et al. 2012). In addition, 2000 known BAL quasars with SDSS spectra333We refer to spectra taken during SDSS-I or SDSS-II as SDSS spectra, and spectra taken during SDSS-III as BOSS spectra. are being targeted for reobservation via a BOSS ancillary project (Dawson et al. 2013). Together, the above observations will enable unprecedented studies of BAL quasar variability on multi-year timescales (e.g., Filiz Ak et al. 2012).
The BOSS uses the same 2.5m Sloan Foundation telescope (Gunn et al. 2006) as SDSS-I/II did, but the fiber-fed spectrographs have been upgraded with 1000 2 optical diameter fibers instead of 640 3 ones, improved optics, higher throughput gratings over a wider spectral range of 3600–10400 Å at a resolution , and new CCDs with improved blue and red response (Smee et al. 2012). The first BOSS spectra have been publicly released as part of the SDSS Data Release Nine (DR9; Ahn et al. 2012).
The BOSS spectra shown herein are from the BOSS reduction pipeline version v5_4_45 (Bolton et al. 2012) for all but one object.444The exception is J1628. Its spectrum herein is from version v5_6_0, the version in use when J1628 was observed in Sept. 2012. That version of the pipeline has a systematic flux excess shortward of 4100 Å at a level of 2.5% of the flux at 5600 Å, increasing to 12.5% at 3600 AA (§ 2.4.1 of Pâris et al. 2012); this fact rarely affects the conclusions we draw from our spectra, but should be kept in mind. All SDSS spectra shown herein are the improved sky-subtraction versions of Wild & Hewett (2010). The BOSS and SDSS spectra shown herein have not been corrected for Galactic extinction. In all spectra, we interpolated over narrow regions near strong night sky lines if large flux residuals from the sky subtraction were present.
3 BAL Quasars with Redshifted Absorption
| Name (SDSS J) | RA | DEC | Redshift | Redshift | BAL | Trough | FIRST | ||
| (J2000) | (J2000) | mag. | source | type | shape | mJy beam-1 | |||
| Quasars with redshifted C iv absorption | |||||||||
| 002825.02010604.2 | 7.104254 | 1.101175 | 20.509 | 4.11520.0102 | HW10 | Lo | 0.73 | 27.00 | |
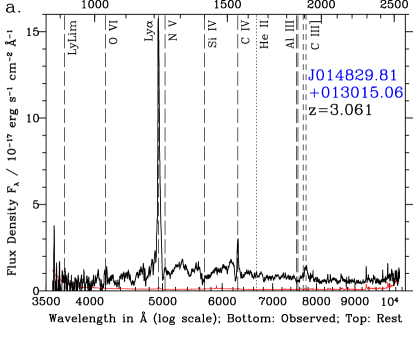
| 014829.81013015.0 | 27.124227 | 1.504184 | 20.415 | 3.0610.008 | C iii] PCA | Lo | V | 1.06 | 26.40 |
| 080544.99264102.9 | 121.437461 | 26.684147 | 21.745 | 2.7030.008 | C iii] PCA | Lo | V | 0.96 | 24.81 |
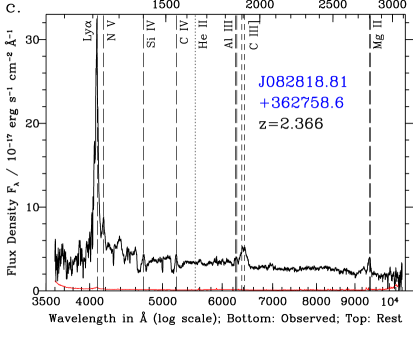
| 082818.81362758.6 | 127.078399 | 36.466304 | 19.767 | 2.3660.005 | full PCA | Lo | 0.93 | 26.52 | |
| 083030.26165444.7 | 127.626083 | 16.912417 | 19.160 | 2.43450.0005 | inspection | Lo | 0.99 | 27.17 | |
| 094108.92022944.7 | 145.287167 | 2.495776 | 20.197 | 3.4460.002 | C iii] PCA | Hi | 1.01 | 26.90 | |
| 101946.08051523.7 | 154.942000 | 5.256583 | 20.978 | 2.4520.001 | C iii] PCA | FeLo | 1.00 | 25.34 | |
| 103412.33072003.6 | 158.551375 | 7.334333 | 18.161 | 1.68930.0018 | HW10 | Lo∗ | 1.01 | 26.85 | |
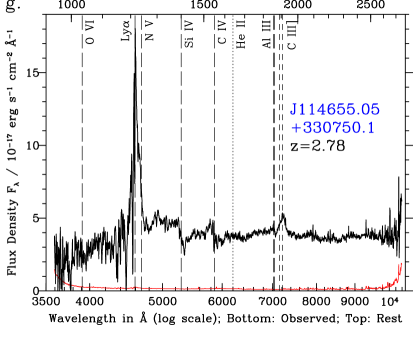
| 114655.05330750.1 | 176.729393 | 33.130585 | 19.294 | 2.7800.001 | C iii] PCA | Lo? | V | 0.95 | 27.26 |
| 114756.00025023.4 | 176.983335 | 2.839839 | 19.278 | 2.55590.0056 | HW10 | Lo | V/ | 1.03 | 27.17 |
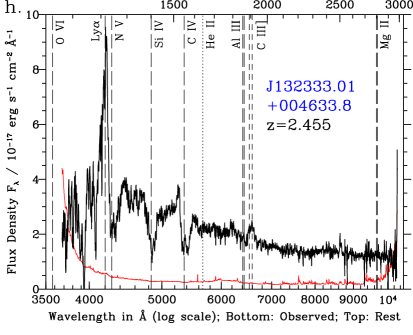
| 132333.01004633.8 | 200.887578 | 0.776082 | 20.286 | 2.4550.038 | inspection | Lo? | 0.98 | 26.02 | |
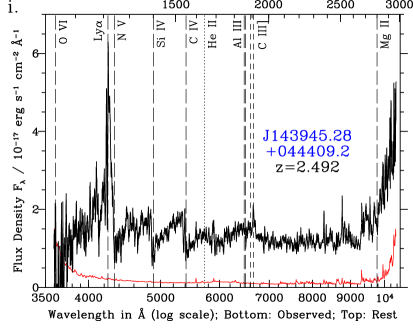
| 143945.28044409.2 | 219.938667 | 4.735889 | 20.850 | 2.4920.001 | C iii] PCA | Lo? | V | 1.00 | 25.56 |
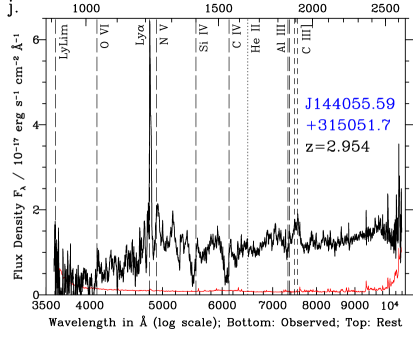
| 144055.59315051.7 | 220.231641 | 31.847709 | 20.295 | 2.9540.015 | C iii] PCA | Lo | 0.96 | 26.42 | |
| 162805.80474415.6 | 247.024167 | 47.737667 | 18.481 | 1.59490.0019 | HW10 | Hi | 0.93 | 26.38 | |
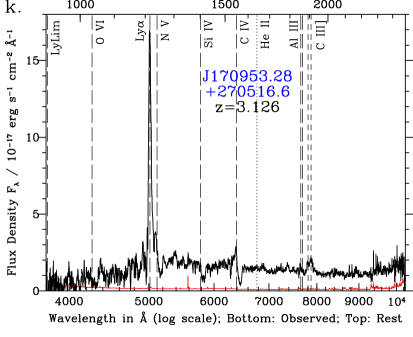
| 170953.28270516.6 | 257.472000 | 27.087944 | 20.560 | 3.1260.003 | C iii] PCA | Lo | 0.98 | 26.36 | |
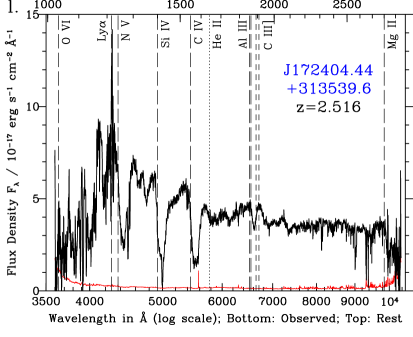
| 172404.44313539.6 | 261.018500 | 31.594333 | 19.600 | 2.5160.001 | C iii] PCA | Lo | 0.95 | 26.86 | |
| 215704.26002217.7 | 329.267750 | 0.371583 | 20.071 | 2.2400.002 | C iii] PCA | Lo | V | 0.73 | 26.18 |
| Quasars with redshifted Mg ii absorption | |||||||||
| 112526.12002901.3 | 171.358833 | 0.483694 | 17.896 | 0.86330.0007 | HW10 | FeLo | V | 0.99 | 25.54 |
| 112828.31011337.9 | 172.117958 | 1.227194 | 18.366 | 0.89320.0007 | HW10 | FeLo | V | 0.98 | 25.16 |
| Quasars with candidate redshifted C iv or Mg ii absorption | |||||||||
| 005030.13023915.0 | 12.625542 | 2.654167 | 19.987 | 2.1180.001 | full PCA | Lo | 0.93 | 25.94 | |
| 123901.00014813.4 | 189.754167 | 1.803722 | 19.973 | 2.4130.001 | inspection | Hi | V | 0.76 | 25.85 |
| 131637.26003636.0 | 199.155275 | 0.610007 | 18.049 | 0.93040.0007 | HW10 | Fe?Lo | 2.080.14 | 25.55 | |
| 134243.87362301.9 | 205.682805 | 36.383885 | 21.340 | 2.69170.0004 | inspection | Hi | 0.95 | 25.14 | |
| 163319.76190856.7 | 248.332333 | 19.149083 | 17.412 | 1.9350.001 | Mg ii PCA | Lo? | V | 2.340.15 | 28.31 |
| 170456.42232825.7 | 256.235083 | 23.473806 | 18.918 | 3.45000.0005 | inspection | Lo | 0.94 | 28.22 | |
| 213342.06071408.7 | 323.425278 | 7.235772 | 21.416 | 2.1650.005 | inspection | Hi | V | 0.83 | 24.55 |
The column gives the PSF magnitude in the band. Redshifts (see § 3.1) are given with uncertainties derived from the emission lines used to measure the redshifts; not included are the systematic uncertainties related to the shifts of those lines from the systemic redshift of each quasar. Redshift sources are inspection (for our own inspection redshifts), full, C iii] or Mg ii PCA (Principal Component Analysis; Pâris et al. 2012), and HW10 (Hewett & Wild 2010). The BAL type is Hi for high-ionization, Lo for low-ionization, and FeLo for iron low-ionization (§ 1). Trough shapes are discussed in § 4.2. The FIRST column gives the peak flux or limit in the FIRST catalog (Becker, White & Helfand 1995; Hodge et al. 2011). The column gives the absolute -band magnitude from Pâris et al. (2012) (Schneider et al. (2010) for J1628).
∗ J1034 has blueshifted low-ionization absorption but no clear redshifted low-ionization absorption.


Over the course of the SDSS and now the BOSS, we have accumulated a sample of BAL quasars whose rest-frame spectra exhibit troughs with absorption at wavelengths longer than the rest frame wavelength of one or more transitions. These objects were found by visual inspection of over 100,000 quasar spectra by the authors, including over 87,000 quasars in the Data Release Nine Quasar Catalog (Pâris et al. 2012, hereafter DR9Q).
As with any qualitative selection criteria, while we cannot guarantee that our inspections are complete, our numbers serve as lower limits to the frequency of BAL quasars with redshifted troughs in BAL quasar samples. (We can state that at an intermediate stage in the preparation of this paper, nine out of the ten redshifted BAL quasars known at the time were recovered by visual inspection of all visually identified BAL quasars in DR9Q.) In Table 1 we give basic parameters for seventeen confirmed cases of redshifted absorption in C iv, two previously known objects with redshifted absorption in Mg ii, and seven candidate cases of redshifted absorption. Detailed notes on each confirmed case are given in Appendix A. We discuss our reservations about the candidate objects in Appendix B and present a number of rejected candidates in Appendix C.
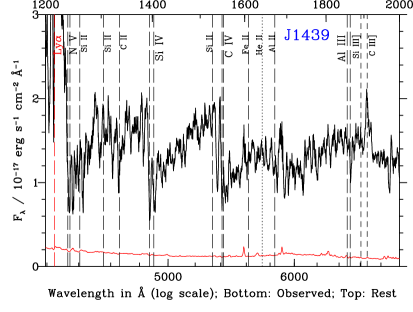
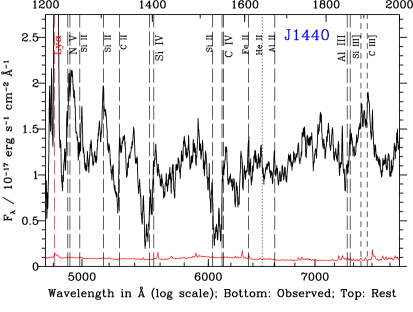
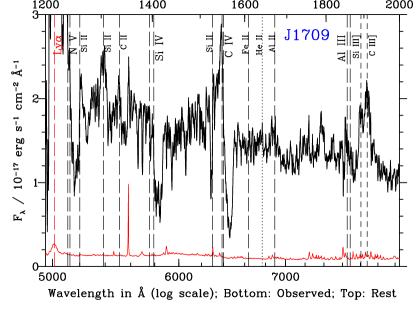
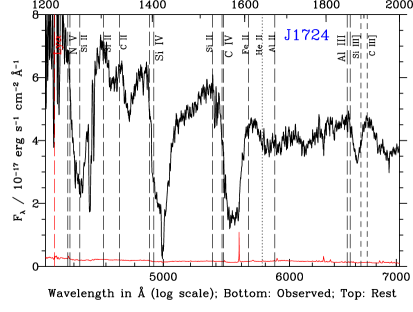
The spectrum of the most striking object is shown in Fig. 1 and discussed below. Spectra of all objects with redshifted high-ionization absorption are shown in Fig. 2 (BOSS discoveries, with close-ups of the same spectra in Fig. 4) and Fig. 6 (SDSS discovery spectra in green, with second-epoch spectroscopy from the BOSS in black).
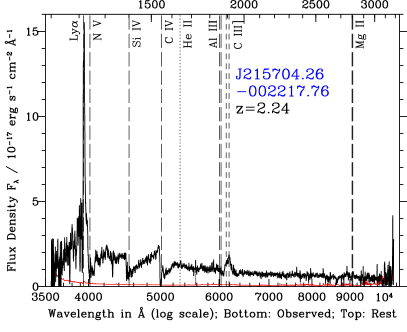
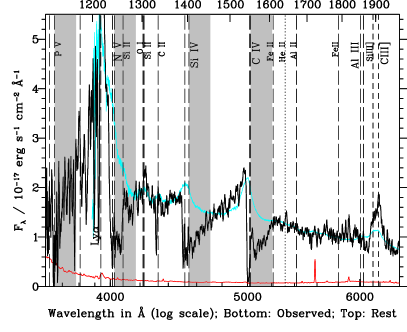
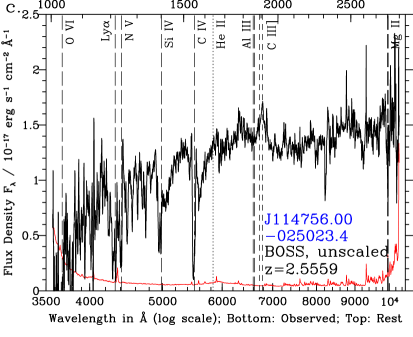
SDSS J215704.26002217.7 (J2157; Fig. 1) is the most dramatic example we have found of redshifted absorption. The quasar has a redshift , measured from its broad Si iii] 1892+C iii] 1908 emission as detailed in § 3.1.555This redshift is conservative in that if redshifted Al iii absorption has significantly affected the profile of this emission line, the true redshift will be lower and the redshifted absorption will extend to even larger redshifted velocities. Because J2157 has a prominent blue wing of broad C iv emission, for comparison to it in Fig. 1 we plot the composite spectrum of the quartile of quasars with the largest C iv blueshifts in the study of Richards et al. (2002). Of their four composites, the one plotted best matches the emission lines of J2157 in regions not affected by absorption. The absorption troughs in J2157 in N v 1238,1242, Si iv 1393,1402 and C iv 1548,1550 begin at a small blueshift (= km s-1 in C iv) and extend smoothly to a large redshift (=9050 km s-1 in C iv) at more or less constantly decreasing depth. There is also redshifted absorption in P v 1118,1128 (shaded in Fig. 1) and in Al iii 1854,1862. J2157 exhibits strong, narrow Ly emission accompanied by narrow O i 1302+Si ii1304, He ii 1640, Mg ii 2796,2803, and possibly C iv emission.
The presence of redshifted absorption in multiple transitions makes the identification of the troughs in J2157 and other such objects unambiguous. The variety of the redshifted absorption troughs’ profiles, widths, and velocity ranges rule out an explanation of the troughs as gaps between emission features (but see Appendix B for additional candidates where that explanation cannot be excluded).
3.1 Systemic redshifts and redshifted trough extents
The identification of these troughs as redshifted depends on the systemic redshift of these quasars being known to an uncertainty less than the trough widths. The redshifted absorption extends to 3000 km s-1 in all confirmed cases and up to 10,000 km s-1 in a few cases (see § 4.4). Such values are generally larger than the uncertainties in redshift measurements made using low-ionization broad emission lines. To estimate those uncertainties we use the results that, on average, narrow [O iii] in quasars is blueshifted by an average of 455 km s-1 from the host galaxy redshift defined by Ca ii K absorption (Hewett & Wild 2010), Mg ii is redshifted relative to [O iii] by 97269 km s-1 (Richards et al. 2002), and the C iii] complex666Variations in the relative strengths of the transitions in the C iii] complex can introduce offsets of order a few 100 km s-1 into the determination of the systemic redshift from it. This complex is a blend of C iii] 1908, Si iii] 1892, and Fe iii UV34 1895,1914,1926, plus Al iii 1854,1862 if the line profiles are sufficiently broad. At densities 105 cm-3 there will also be significant contributions from [C iii] 1907 and [Si iii] 1883 (Osterbrock & Ferland 2006). is blueshifted relative to Mg ii by 827604 km s-1 (Shen et al. 2007). Therefore, relative to the host galaxy redshift, Mg ii redshifts should on average be redshifted by 52269 km s-1, and C iii] redshifts should on average be blueshifted by 775661 km s-1. We do not correct redshifts we obtain from those transitions for the above offsets, but those offsets and scatter should be kept in mind as limits on the current accuracy of our redshifts.
We examined the spectra of our objects to determine ‘inspection redshifts’ which were then compared to the various redshifts tabulated in DR9Q, and, for quasars in the SDSS Data Release Seven (DR7; Abazajian et al. 2009) Quasar Catalog (Schneider et al. 2010), to the redshifts computed by Hewett & Wild (2010). These objects have unusual spectra which affect the accuracy of redshifts measured by fitting the overall spectrum with a Principal Component Analysis (PCA) reconstruction with the redshift as a free parameter (the DR9Q full PCA redshifts), but which rarely affect fits to the C iii] emission region. Therefore, the default redshifts adopted for our objects are the redshifts measured from the peak of a PCA reconstruction of the C iii] emission line (see DR9Q). The available C iii] PCA redshifts agreed very well with our inspection redshifts except in two cases, with an average km s-1 excluding the two special cases. Those cases are the candidates J0050 ( km s-1) and J1704 ( km s-1). In the former case we believe the C iii] PCA redshift to be incorrect and in the latter we believe the true redshift is bracketed by our inspection redshift and the C iii] PCA redshift (see Appendix B). For objects without C iii] PCA redshifts available, we use redshifts from HW10 whenever those redshifts were plausible. The remaining cases are discussed individually in Appendix A.
All of our seventeen confirmed objects have maximum redshifted trough velocities of 3170 km s-1 or greater, equivalent to requiring deviations from the mean of the C iii] redshift distribution of 3.6 or greater (we do not quote probabilities because we do not know how Gaussian the distribution is, especially in the tails). Overall, our objects do not have maximum redshifted trough velocities small enough that the redshifted absorption could be spurious, arising from an outlying redshift measurement from the C iii] emission line.
Finally, a K-S test reveals no statistically significant difference between the redshift distribution of our high-ionization objects and that of the DR9Q BAL sample.
3.2 Cases of particular interest
We discuss here several objects of particular interest. Notes on all objects with redshifted high-ionization absorption are given in Appendix A.
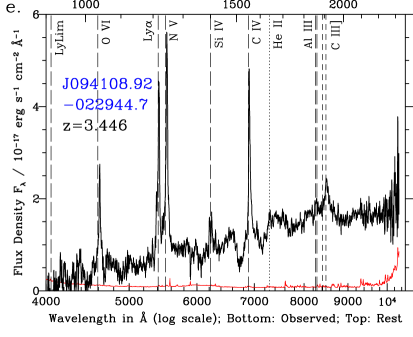
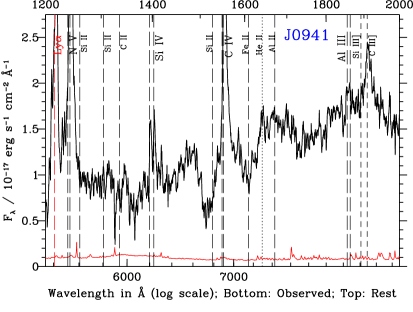
SDSS J094108.92022944.7 (J0941; Fig. 2e), at =3.446 from its DR9Q C iii] PCA redshift, is morphologically classified as a galaxy in the SDSS. Its image appears extended in the NW-SE direction. These properties make J0941 a prime candidate for being a binary quasar system where the BAL outflow of one quasar is silhouetted in front of a second quasar; see § 5.4. Note that J0941 was not targeted as a BOSS quasar candidate because all such candidates are required to be unresolved (Ross et al. 2012). It was targeted as part of the CMASS (“constant mass”) galaxy sample designed to select galaxies at (Dawson et al. 2013). It is unlikely to be a lensed quasar superimposed on a galaxy: the rest-frame equivalent width of broad C iii] in the observed spectrum is typical, so the observed flux must be dominated by the quasar and not a galaxy at . If J0941 is a lensed quasar, the lensing galaxy must be of sufficiently high redshift or low optical luminosity (or both) to leave no signature in the BOSS spectrum.
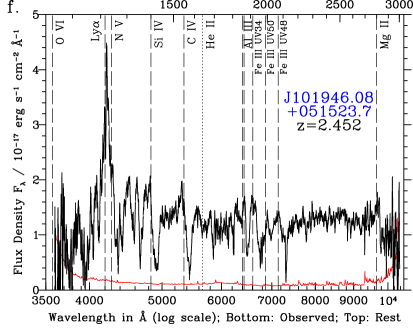
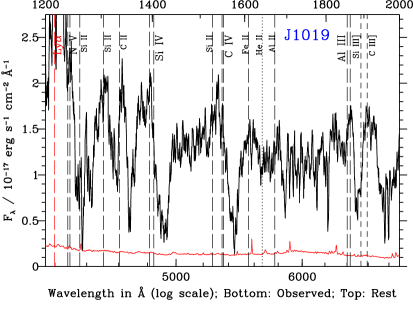
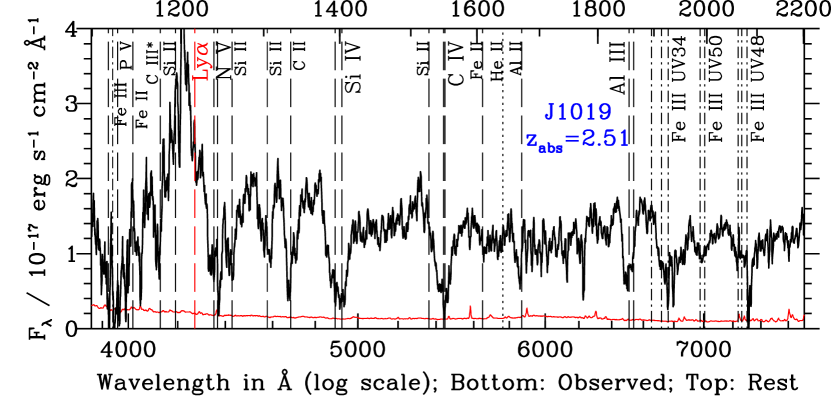
SDSS J101946.08051523.7 (J1019; Fig. 2f) has Ly which peaks at =2.4685, but we adopt the DR9Q C iii] PCA redshift of =2.452 as systemic. J1019 has mostly redshifted absorption in a wide range of transitions: Fe iii multiplets UV48, UV50 and UV34, Al iii, Al ii 1670, C iv, Si iv, C ii 1334, Si ii 1304, Si ii 1263, N v, and apparently C iii* 1175, P v 1118,1128+Fe iii1122, S iv 1062+S iv* 1072 and probably O vi 1031,1037. The last five transitions are in the Ly forest and are thus less certain identifications. If confirmed, P v and S iv would indicate a high column density absorber (Borguet et al. 2012). Absorption from Fe iii UV34 (EP 3.73 eV) and Fe iii UV48 (EP 5.08 eV) has been seen before in BAL quasars (Hall & Hutsemékers 2003), but this is the first reported case of a trough from Fe iii UV50 (EP 7.86 eV). Absorption from Fe ii is not clearly detected despite the detection of Si ii and the similarity of the two elements’ abundances and ionization potentials for ionization stages I–III. We discuss this quasar further in § 4.6.
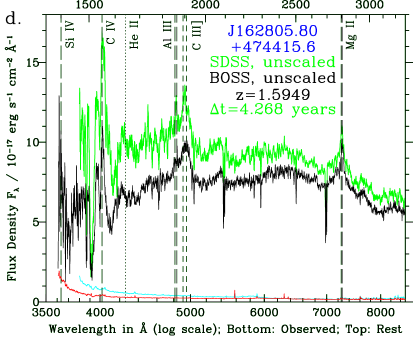
SDSS J162805.80474415.6 (J1628 Fig. 6d) at =1.5949 has broad C iv absorption blueshifted by up to 9810 km s-1 and a redshifted C iv trough extending to 12400 km s-1. We have previously outlined two alternative explanations for the latter trough (Hall et al. 2004b). It could be a high velocity (46000 km s-1) Al iii trough without accompanying Mg ii. The required velocity is less than the maximum velocity known for C iv, but considerably larger than the maximum velocity of 25000 km s-1 previously identified for Al iii (in SDSS J154303.24+264052.3; Allen et al. 2011). Furthermore, the lack of BAL quasars with Al iii seen between 25000 km s-1 and 45000 km s-1 makes this explanation unlikely. The trough could also be He ii 1640 absorption associated with the blueshifted C iv outflow. No unambiguous detection of He ii absorption in a BAL quasar has been reported, but it has been seen in disc-wind outflows in Galactic objects (Hartley et al. 2002). Such absorption would indicate gas of high density and with a moderately high ionization parameter (Wampler, Chugai & Petitjean 1995). Both of the above hypotheses remain technically viable for this object; however, the confirmed existence of redshifted C iv absorption in other quasars makes these alternate explanations less likely.777Similarly, Maiolino et al. (2004) reported that SDSS J104845.05463718.4 (J1048) at has blueshifted Si iv and C iv absorption plus absorption which could be C iv redshifted by km s-1 or He ii 1640 absorption in the blueshifted outflow. The putative redshifted C iv absorption in J1048 appears less prominent in the spectrum presented by Gallerani et al. (2010), however. The trough may have varied, but the significance of its detection is difficult to evaluate since no error array accompanies either published spectrum.
In addition to the new discoveries above, J1125 and J1128 from Hall et al. (2002) remain cases of redshifted Mg ii absorption,888Hall et al. (2002) also suggested that UN J10530058 and 3C 288.1 were candidates for redshifted absorption. SDSS spectra obtained of those sources reveal that the absorption is not redshifted in either case. It is at the systemic redshift as given by Mg ii for UN J10530058 and by numerous narrow lines for 3C 288.1. as discussed in § 1. In § 3.3.2 we discuss new BOSS spectra obtained for both objects.
3.3 Repeat spectra
3.3.1 Repeat spectra of high-ionization cases
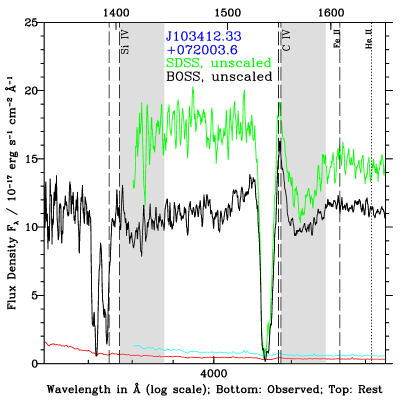
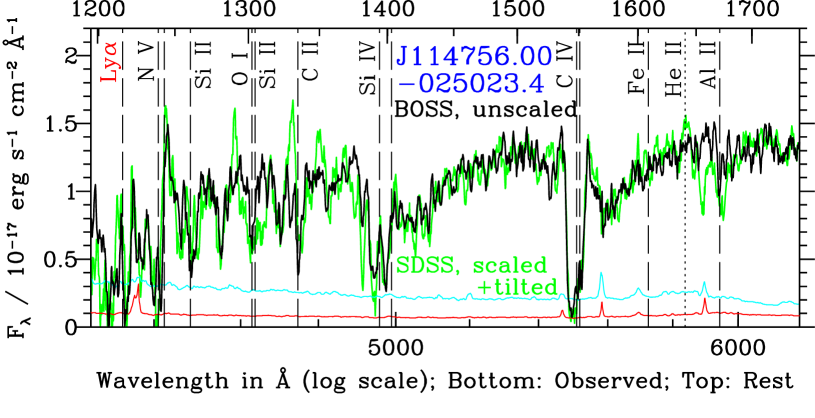
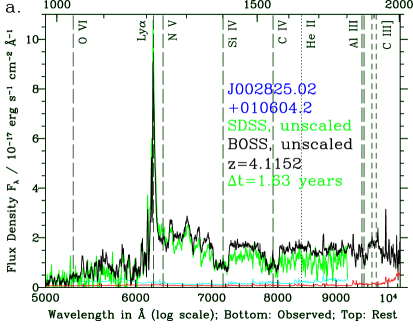
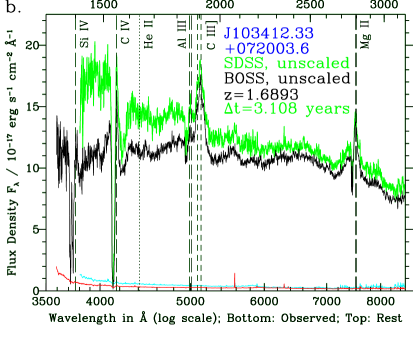
Our sample includes four quasars with SDSS spectra of redshifted C iv absorption and two with SDSS spectra of redshifted Mg ii absorption, all of which now also have BOSS spectra. Figure 6 shows the unscaled SDSS and BOSS spectra for the redshifted C iv absorption objects. In the case of J1147, the SDSS spectrophotometry disagrees with both the SDSS photometry and the BOSS spectrophotometry, and so we plot only the BOSS spectrum. (There are also two quasars with candidate redshifted C iv absorption which have SDSS spectra; see Figure 16.)
Between spectroscopic epochs separated by years in the rest frame, quasars can vary in flux level and continuum slope as well as in absorption properties (e.g., Foltz et al. 1987; Gibson et al. 2010; Rodríguez Hidalgo, Hamann & Hall 2011). To compare absorption troughs in these quasars’ SDSS and BOSS spectra we scale and tilt the BOSS spectra to match the SDSS spectra.999In only one of our quasars with two spectra—namely, J1704—is the search for continuum variability affected by issues with the DR9 spectrophotometry of BOSS quasar survey targets taken on dates when washers were used to offset those fibers to improve the spectral throughput in the blue (Dawson et al. 2013). We scale by a constant factor to account for flux variability and tilt through multiplication by a power-law to account for continuum slope differences (apparent or real). For display purposes, we normalize the spectra separately for each figure rather than using a single global fit.
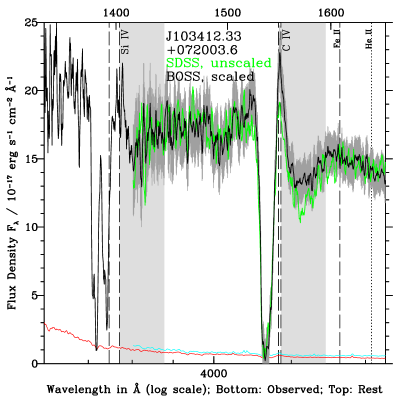
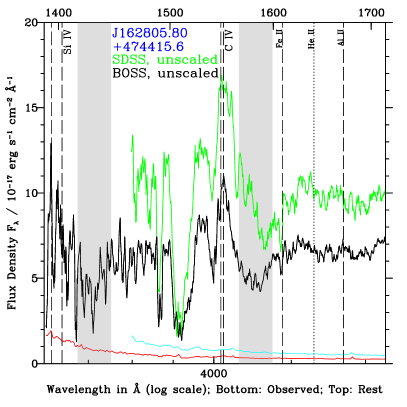
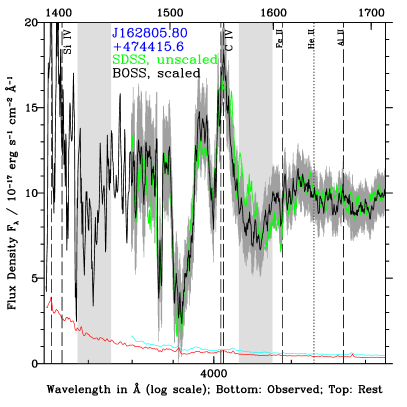
The results of this approach are shown for J1034 in Figure 7 and for J1628 in Figure 8. In each figure, the left- and right-hand panels show the unscaled and rescaled BOSS spectra (black), respectively, along with the unscaled SDSS spectrum (green). In the right-hand panels, around each BOSS spectrum we show in grey the statistical uncertainty range, where accounts for both the SDSS and scaled BOSS uncertainties. If the normalized absorption troughs in the two spectra were identical, the grey region would include 95% of the points in the green spectrum.
For J1034, in the 1135 rest-frame days between the SDSS and BOSS spectra the C iv absorption at the systemic redshift and at redshifted velocities weakened in relative strength, resulting in a stronger narrow emission peak for C iv. The normalized blueshifted absorption did not change significantly. The changes could be due to a strengthening of the underlying C iv emission line plus a velocity-dependent broad-line region covering factor. In any case, J1034 shows that redshifted and systemic absorption can vary in normalized spectra independently of the blueshifted absorption.
For J1628, in the 1559 rest-frame days between the SDSS and BOSS spectra the C iv emission line appears to have strengthened somewhat (between 1520 Å and 1560 Å rest-frame). The absorption at blueshifted velocities km s-1 did not change significantly. The redshifted absorption trough has shifted to smaller redshifted velocities, by about 2000 km s-1 on average. Whether this is a case of deceleration or just covering factor variations as a function of velocity cannot be determined without further observations. If this is a case of gas undergoing decelerating infall due to outward radiative acceleration, the acceleration amounts to cm s-2. For comparison, is predicted in the main acceleration region of a disc wind in the model of Murray et al. (1995). If the observed absorption arises in decelerating infalling gas, and assuming constant ionizing luminosity, the deceleration should be seen to increase with time as the gas moves to smaller radii.
An additional result of this approach is shown in Fig. 9. No significant variations are seen in the absorption in J1147 over 886 rest-frame days.
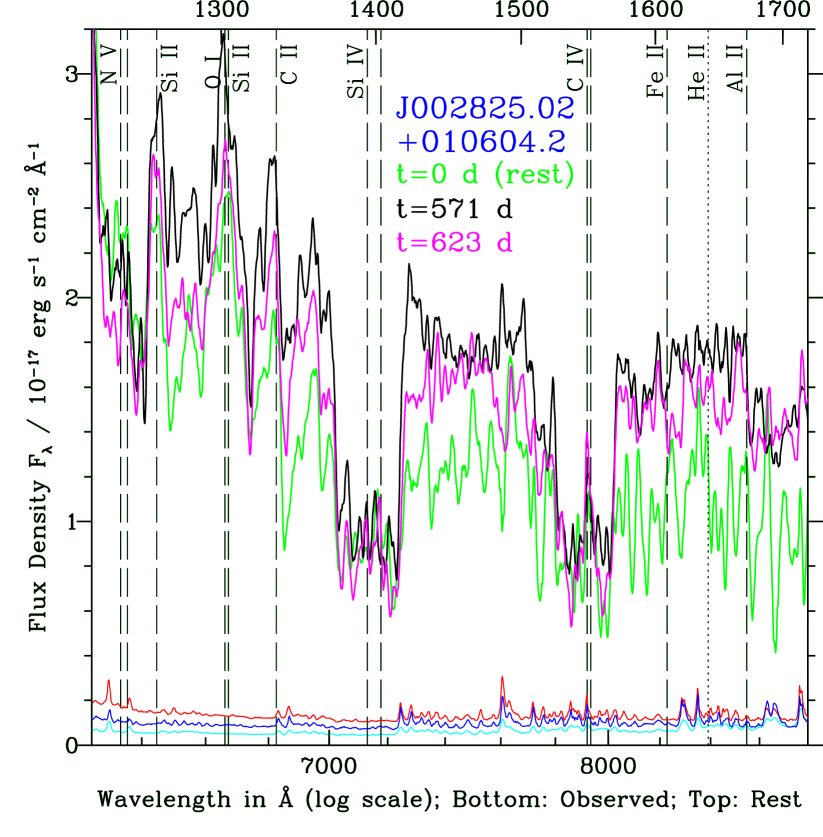
Finally, in Figure 10 we show one SDSS and two BOSS epochs of spectroscopy for J0028, with no scaling. In the 571 rest-frame days between the SDSS observation and the first BOSS observation of J0028 (green to black spectra in Fig. 10), the flux level of the unabsorbed continuum brightened by 50%, the flux levels within the two Si ii troughs and the C ii trough increased by nearly 50%, but the flux levels within the Si iv, C iv and N v troughs, both redshifted and blueshifted, did not change significantly except in the most highly blueshifted parts of the Si iv and C iv troughs. In the 52 rest-frame days between the two BOSS observations of J0028 (black to magenta spectra in Fig. 10), the flux level across most of the spectrum decreased by 10%. Between both pairs of spectra, the trough variability showed no evidence for any change with velocity across the systemic redshift dividing redshifted and blueshifted absorption.
3.3.2 Repeat spectra of low-ionization cases
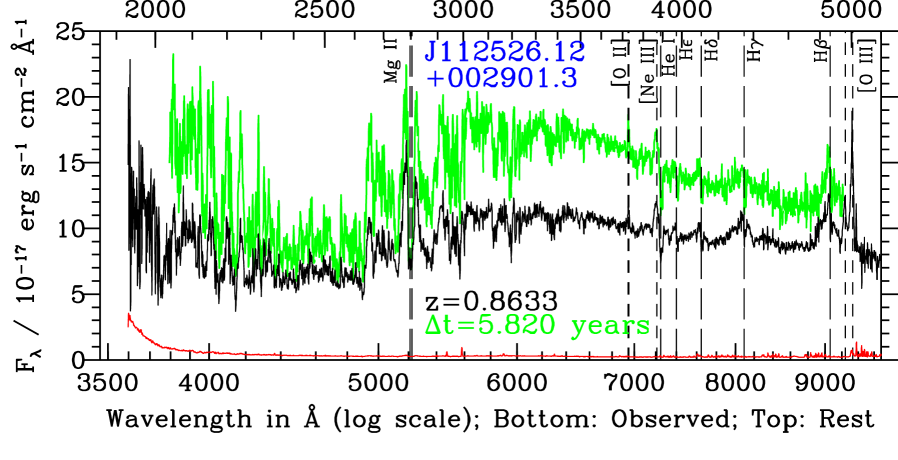
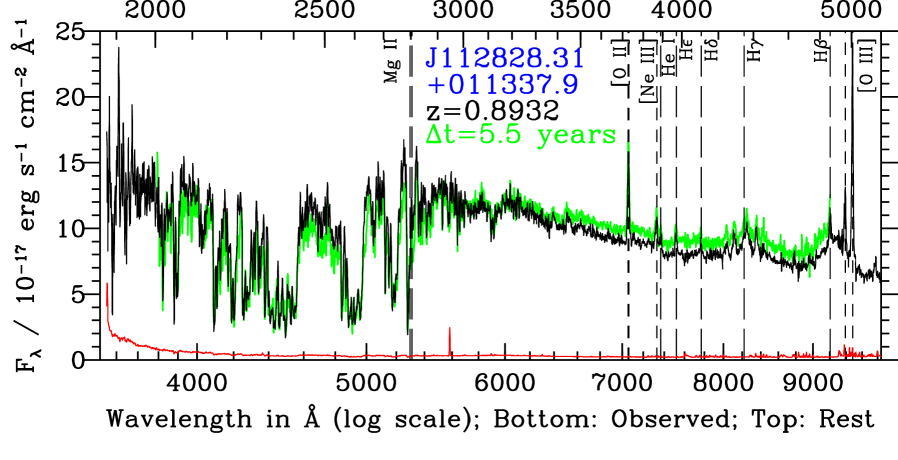
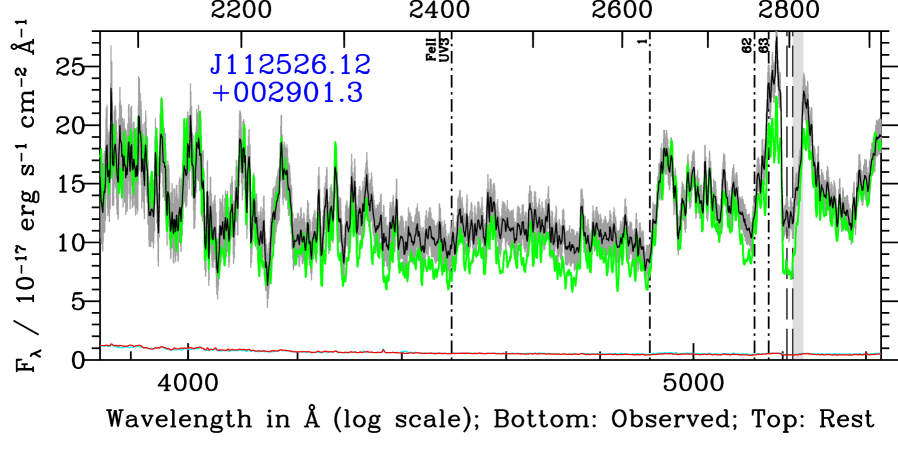
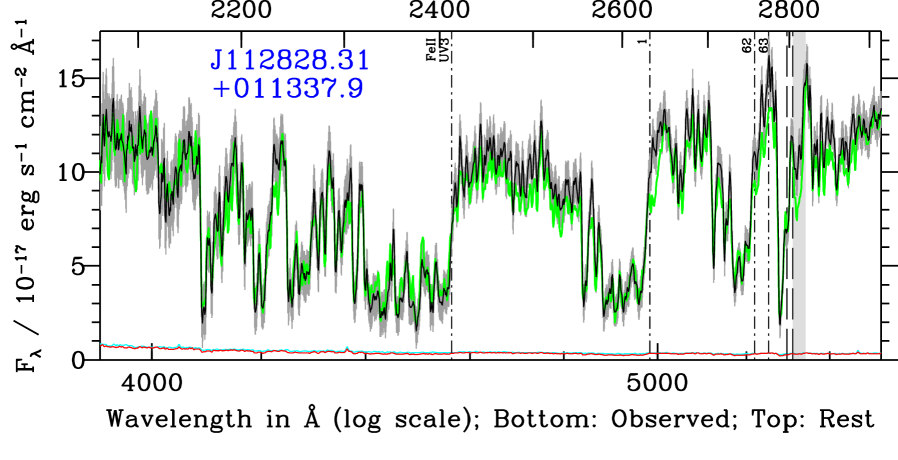
Both quasars with previously known redshifted Mg ii absorption, J1125 and J1128, have also been observed by the BOSS (Figure 11). We have adopted the redshifts from Hewett & Wild (2010) for both these objects. The redshift for J1128 is almost identical to that used in Hall et al. (2002). The redshift for J1125 (, primarily from [O ii]) is 338 km s-1 smaller than the used in Hall et al. (2002). That latter redshift corresponds to narrow Balmer-line absorption which was recognized in Hall et al. (2002) and assumed to be host-galaxy absorption. However, a small but growing number of quasars are now known to exhibit Balmer-line absorption in their outflows (Hall 2007; Aoki 2010; and references therein). Furthermore, [O ii] is offset by only 215 km s-1 on average from host-galaxy absorption in SDSS quasars (Hewett & Wild 2010). Therefore the Balmer-line absorption is most likely part of the redshifted absorption in this object, and we no longer adopt the redshift of that absorption as systemic.
Both quasars show broad Balmer-line emission, narrow [O ii] and [O iii] emission, and relatively narrow (few 1000 km s-1 wide) absorption from many ground-state (Fe ii) and excited-state (Fe ii*) transitions of singly ionized iron (Moore 1950), as well as absorption in Mg ii. Superpositions of these narrow lines form the apparent broad troughs in the spectra. There is also narrow Fe ii emission in the spectra; for example, the narrow emission lines flanking H in J1128 are slightly redshifted Fe ii (Véron-Cetty, Joly & Véron 2004).
As in the previous section, to compare absorption properties at both epochs we used a constant times a power law to rescale the BOSS spectra. For these objects we scaled to the SDSS spectra in continuum regions near 2100 Å and 2910 Å rest frame. The resulting spectra are shown in Fig. 12; again, the green spectrum precedes the black spectrum. Around each BOSS spectrum (black), we show in grey the statistical uncertainty range.
In both objects, the two normalized spectra show small but significant differences near Mg ii which cannot be matched by smooth continuum variations. The Mg ii absorption, emission, or both must have varied.
In J1125, the blueshifted Mg ii absorption has weakened more than the redshifted absorption has. The underlying Mg ii emission may have strengthened relative to the continuum (Figure 11 is consistent with constant emission-line flux and weakening continuum flux), but different behaviour in blueshifted and redshifted absorption would still be required if that were the case. Stronger emission and apparently weakened blueshifted absorption are also seen in H and H (not shown). Also, the Fe ii* absorption between 2300–2630 Å has apparently weakened, with most of the scaled BOSS spectrum above the SDSS spectrum.
In J1128, there have been decreases in the strengths of the redshifted absorption troughs in Mg ii and Fe ii* multiplets UV1, UV62 and UV63, visible just to the right of the vertical lines marking those transitions in the bottom panel of Figure 12. There has been no significant weakening in the blueshifted absorption in those transitions.
As with C iv absorption in the previous section, it appears that redshifted Mg ii absorption can vary independently of blueshifted absorption.
4 Properties of BAL quasars with redshifted troughs
4.1 Multiwavelength data
We found no X-ray observations of useful depth of our objects in the Chandra, XMM-Newton, Suzaku, BeppoSAX, Swift XRT, or pointed ROSAT archives, which we searched using HEASARC Browse101010http://heasarc.gsfc.nasa.gov/cgi-bin/W3Browse/w3browse.pl.
We searched for counterparts of our objects within 2 arcseconds in the Wide-field Infrared Survey Explorer (WISE; Wright et al. 2010) All-Sky Source Catalog. Fourteen objects with confirmed C iv absorption were detected (all except J0805, J0828 and J1709),111111The detection of J1439 is offset 1.7 arcseconds to the west, likely due to contamination from a galaxy 48 to the west which has a photometric redshift of (Oyaizu et al. 2008). along with four of seven candidates (all except J1342 and J2133) and all objects with confirmed or candidate redshifted Mg ii absorption. Three of the five non-detections are the three faintest objects in our sample, all with . None of our objects exhibit obviously unusual , or colors as compared to other quasars in DR9Q. A full multiwavelength study of these objects to determine how well their spectral energy distributions match those of standard BAL and non-BAL quasars will be very useful, but is beyond the scope of this work.
We note in passing that none of our confirmed objects and only two of our candidates have radio detections in FIRST (Table 1), one with candidate redshifted C iv absorption and one with candidate redshifted Mg ii absorption. The detection rate of DR9Q quasars at (where BOSS spectra cover Si iv to C iv) is 3.26%, so between zero and two radio-detected objects in our redshifted C iv sample is statistically consistent with expectations.
4.2 Trough shapes
The absorption profiles of the redshifted troughs (or the redshifted parts of the troughs) in these objects resemble those of blueshifted troughs in many ways.
When present, troughs from low-ionization species (ionization stages I to III) are generally narrower and weaker than those from high-ionization species (stages IV and higher); e.g., Al iii in J2157 (Fig. 1), or Si ii1304 and C ii 1334 in J1019 (Fig. 2f and 4f). The lack of objects with C iv absorption much stronger than absorption in other transitions is unlikely to be due purely to the selection effect of typically requiring absorption in multiple troughs to identify a quasar as having redshifted absorption. We have found no cases where strong, redshifted C iv is present but redshifted Si iv is not; only J1324 (Appendix B) comes close.
The residual intensities are similar in transitions with very different transition probabilities from species of very different abundances, indicative of partial covering of the emission regions at optical depth (e.g., Arav et al. 1999; Crenshaw, Kraemer & George 2003). Because the continuum emission region and the broad emission line region (BELR) have very different sizes, the BAL gas may have different covering factors of each region. Examination of these objects’ spectra near C iv shows that both the continuum source and the BELR can be fully covered by gas at systemic and blueshifted velocities. However, in no case is the continuum source fully covered by redshifted absorbing gas. Moreover, the redshifted gas need not cover the C iv BELR at all in any of these objects (though if it does not, the continuum source would be close to fully covered in J0830, J1019 and J1709). That possibility means that the redshifted absorbing gas could be located interior to the BELR (e.g. Arav et al. 1999), though it does not need to be (we cannot rule out equal covering of the continuum source and the BELR). The only exception to the above is the candidate J0050 (Appendix B), in which the absorption has nearly full coverage of both the continuum and the C iv BELR.
Broadly speaking, we can classify our quasars with high-ionization troughs into three categories based on the shapes of their absorption troughs: V-shaped, -shaped, or -shaped. See § 4.4 for a discussion of trough shapes in terms of quantitative absorption strengths.
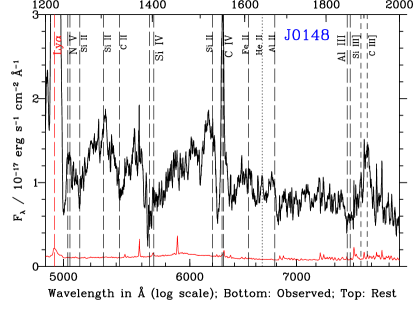
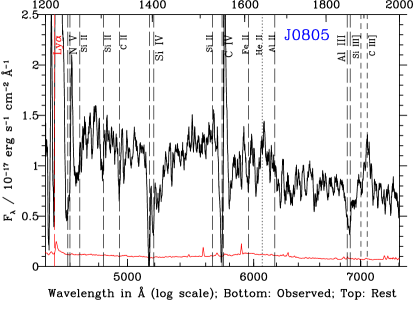
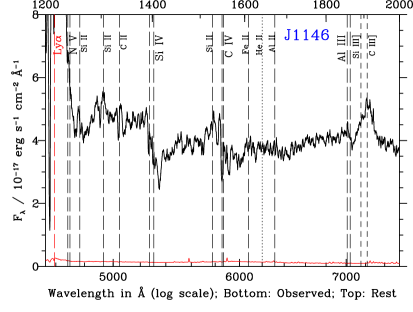
Six of our quasars, including J2157, have V-shaped absorption troughs which are strongest at their short-wavelength ends and which extend smoothly to longer wavelengths at decreasing depths. (In some cases the C iv trough is interrupted by narrow emission, but the Si iv trough shows the underlying V-shaped trough.) These quasars are J0148 (Fig. 2a and 4a), J0805 (Fig. 2b and 4b), J1146 (Fig. 2g and 4g), J1147 (a borderline case; see Fig. 6c and Fig. 9), J1439 (Fig. 2i and 4i) and J2157 (Fig. 1) plus, if confirmed, the candidates J1239, J1633, and J2133 (Appendix B). Our two low-redshift quasars with redshifted Mg ii absorption (J1125 and J1128; Fig. 12) also have V-shaped troughs, albeit quite narrow ones.
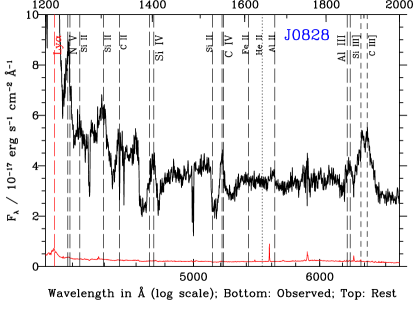
Five of our quasars have what appear to be separate blueshifted and redshifted absorption troughs, with the same structure in C iv and Si iv; we refer to such troughs as -shaped. These quasars are J0828 (Fig. 2c and 4c), J0941 (Fig. 2e and 4e), J1034 (Fig. 6b), J1440 (Fig. 2j and 4j) and J1628 (Fig. 6d) plus, if confirmed, the candidates J1316 and J1342 (Appendix B). The blueshifted absorption is stronger than the redshifted absorption in all cases, although the relative strengths are nearly equal in J0941 and J1324. In the case of J1034, the weakness of the C iv emission line between the two troughs means the absorption is likely to be continuous over a span of 11000 km s-1. J1034 may have less absorption at the systemic redshift or it may have a higher covering factor of the continuum than of the emission-line region.
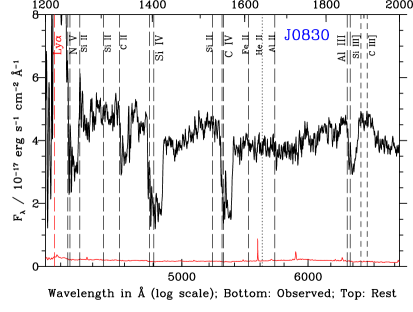
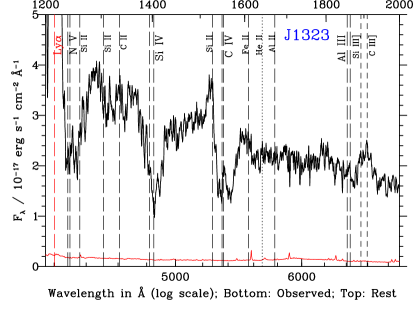
Six of our quasars have troughs which have relatively sharp edges at both their short- and long-wavelength ends and which reach maximum depth near the trough center (apart from occasional weak, narrow emission in C iv). We refer to such troughs as -shaped. These quasars are J0028 (Fig. 6a), J0830 (Fig. 2d and 4d), J1019 (Fig. 2f and 4f), J1323 (Fig. 2h and 4h), J1709 (Fig. 2k and 4k) and J1724 (Fig. 2l and 4l) plus, if confirmed, the candidates J0050 and J1704 (Appendix B).
Note that four of our quasars have absorption only at redshifted velocities: J1019, J1146, J1709 and J1724 plus, if confirmed, the candidate J0050 (Appendix B).
4.3 Low-ionization absorption
Among BAL quasars with redshifted C iv absorption, LoBAL quasars are greatly overrepresented. Of our 17 confirmed cases of redshifted C iv absorption, 12 to 14 also have redshifted low-ionization absorption, and one more (J1034) has blueshifted Al iii absorption but no clear redshifted Al iii absorption. The resulting LoBAL fraction is 56%–92% (90% confidence range). LoBAL quasars make up only 5% of the population of all SDSS BAL quasars (and thus only 1%–2% of the entire SDSS quasar population; Trump et al. 2006; Allen et al. 2011). However, LoBAL quasars constitute a larger fraction of the BAL quasar population in near-infrared-selected quasar samples: a factor of two larger comparing the studies of Dai, Shankar & Sivakoff (2008) and Dai, Shankar & Sivakoff (2012), and a remarkable 20 LoBAL quasars out of 21 BAL quasars in Glikman et al. (2012). Our LoBAL classifications are based on the detection of either C ii 1334 or Al iii 1854,1862 troughs, and there are no plausible alternate identifications for those troughs.
With only one FeLoBAL quasar in our sample, we can only say that they do not appear to be overrepresented among BAL quasars with redshifted C iv absorption to the same extent that LoBAL quasars are.
Si iv absorption is also more common among BAL quasars with redshifted C iv absorption than among all BAL quasars. (This is unlikely to be a selection effect; see § 4.2.) Allen et al. (2011) find Si iv absorption in only 42.5%1.4% of BAL quasars with C iv absorption. Redshifted Si iv absorption is seen in all but one of our BAL quasars with redshifted C iv absorption and spectral coverage of Si iv. The exception is the candidate object J1342 (Appendix B), and even it has blueshifted Si iv absorption.
4.4 Absorption Index values
| Quasar | Plate-MJD-Fiber | Shape | C iv blueshifted | C iv redshifted | C iv | C iv | C iv | ||
| range, km s-1 | range, km s-1 | AI | AI+ | AITot | |||||
| Quasars with redshifted C iv absorption | |||||||||
| J0028 | 0689-52262-363 | 780 | 0 | 3310830 | 1382658 | 843270 | 2225940 | ||
| … | 3586-55181-0548 | 880 | 0 | 3510120 | 2206384 | 138192 | 3586477 | ||
| … | 4220-55447-0790 | 440 | 0 | 3510250 | 2203776 | 1483255 | 36861029 | ||
| J0148 | 4273-55506-0334 | V | 160 | 120 | 2020210 | 60901080 | 538159 | 664383 | 1203543 |
| J0805 | 4458-55536-0158 | V | 70 | 70 | 2140120 | 3930160 | 1040145 | 327145 | 1367290 |
| J0828 | 3762-55507-0690 | 85 | 210 | 1270400 | 61301500 | 869200 | 296229 | 1166513 | |
| J0830 | 4489-55545-0364 | 70 | 0 | 317090 | 74372 | 1326102 | 2069175 | ||
| J0941 | 3782-55244-0417 | 880 | 1720 | 63702200 | 14780340 | 3301712 | 1718793 | 50191505 | |
| J1019 | 4802-55652-0629 | … | … | 80070 | 8300160 | 0 | 2672100 | 2672100 | |
| J1034 | 0999-52636-503 | 80 | 70 | 1730250 | 760070 | 211066 | 758100 | 2868165 | |
| … | 4852-55689-0592 | 70 | 70 | 236070 | 684070 | 20357 | 8128 | 211622 | |
| J1146 | 4614-55604-0726 | V | … | … | 1420880 | 7980540 | 0 | 176159 | 176159 |
| J1147 | 0329-52056-176 | V/ | 80 | 0 | 8900120 | 1706352 | 136610 | 3071356 | |
| … | 3790-55208-0290 | V/ | 70 | 0 | 1056070 | 169470 | 1780335 | 3474406 | |
| J1323 | 4006-55328-0170 | 70 | 0 | 560070 | 84926 | 139110 | 224026 | ||
| … | 4050-55599-0624 | 160 | 0 | 55201080 | 1195218 | 1338605 | 2533823 | ||
| J1439 | 4780-55682-0992 | V | 70 | 0 | 94001800 | 30633 | 1602356 | 1908389 | |
| J1440 | 3868-55360-0886 | 1070 | 85 | 18001270 | 12600400 | 3062167 | 1307509 | 4369676 | |
| J1628 | 0625-52145-121 | 240 | 100 | 5610590 | 124001000 | 2034292 | 934215 | 2967506 | |
| … | 6322-56190-0599 | 80 | 2000 | 2710120 | 111001200 | 2058141 | 1167282 | 3225422 | |
| J1709 | 5014-55717-0763 | … | … | 70070 | 443070 | 0 | 180448 | 180448 | |
| J1724 | 5002-55710-0600 | … | … | 0640 | 9350540 | 0 | 3812618 | 3812618 | |
| J2157 | 4197-55479-0030 | V | 85 | 0 | 905070 | 132934 | 2627187 | 3956221 | |
| Quasars with candidate redshifted C iv absorption | |||||||||
| J0050 | 4306-55584-0846 | … | … | 0200 | 178070 | 0 | 139710 | 139710 | |
| J1239 | 0521-52326-221 | V | 160 | 0200 | 2360250 | 11670590 | 1226431 | 1152155 | 2378276 |
| … | 4754-55649-0294 | V | 70 | 0200 | 1770160 | 11640160 | 113955 | 176635 | 290521 |
| J1342 | 3987-55590-0124 | 1170 | 120 | 92070 | 699080 | 1385129 | 79314 | 2178117 | |
| J1633 | 4061-55362-0256 | V | 70 | 0 | 73002800 | 93014 | 601121 | 1531135 | |
| J1704 | 1687-53260-150 | 70 | 0 | 2410240 | 4128142 | 56066 | 4688209 | ||
| … | 4177-55688-0220 | 350 | 0 | 2550120 | 4428288 | 44792 | 4875380 | ||
| J2133 | 4088-55451-0426 | V | 100 | 0 | 520080 | 891260 | 854190 | 1809495 | |
The Plate-MJD-Fiber column gives the SDSS/BOSS spectroscopic plate number, MJD of observation, and fiber number. SDSS and BOSS observations can be distinguished because SDSS uses a three-digit fiber number (001 to 600) while BOSS uses a four-digit fiber number (0001 to 1000). Trough shapes are discussed in § 4.2. The velocity ranges of absorption in C iv are measured relative to the redshift given in Table 1, but do not include the systematic uncertainties on those systemic redshifts. Entries with a 0 in both the blueshifted and redshifted columns represent absorption troughs which are continuous across the systemic redshift. Absorption indices are discussed in § 4.4; the values here were calculated using km s-1.


The balnicity index (BI), which is essentially a modified equivalent width, was introduced by Weymann et al. (1991) as a measure of the strength of a blueshifted absorption trough in a quasar spectrum. The absorption index (AI; Hall et al. 2002; Trump et al. 2006) is a modification of the BI which extends to narrower troughs and to blueshifted velocities closer to systemic. We use the AI to measure the strength of blueshifted absorption, and we define AI+ as the corresponding measurement for redshifted absorption and AITot as the corresponding measurement for absorption at all velocities. With being the normalized rest-frame121212For non-singlet transitions, we use the rest frame of the longest-wavelength component of the transition. Doing so yields a conservative measure of the AI+. spectrum as a function of velocity from the systemic redshift, and with negative velocities representing blueshifted absorption, we have:
| (1) | |||
| (2) | |||
| (3) |
where in contiguous intervals of width or greater within the integration limits wherein the quantity in brackets is everywhere positive; otherwise, . Although we will write AI instead of AI in general, in the definition we use AI to emphasize that AI values depend on the used. In Hall et al. (2002) and DR9Q, km s-1 and have been used. For ease of comparison with DR9Q, we adopt those values also.131313Trump et al. (2006) adopted km s-1 and used to calculate but to calculate AI values, so that the AI would be a true equivalent width measured in km s-1. We have given the limits to the integrals as the speed of light to emphasize that the ideal AI would measure the absorption in a given transition at all outflow velocities, even though in practice limits on the integrals will be set by confusion with absorption from other transitions.
We present C iv absorption indices for our quasars in Table 2. AI values were calculated automatically in the DR9Q only for five confirmed and three candidate objects, due to low signal-to-noise ratios or poor continuum fits in other objects. We therefore calculated our own AI, AI+ and AITot values for all our quasars to ensure internally consistent measurements. We first performed weighted-average smoothing on each spectrum, using a smoothing box size of the minimum odd number of pixels required to yield an average signal-to-noise ratio 10 in the 1325 Å–1625 Å wavelength range; typically, this was 7 pixels (each BOSS pixel spans 69 km s-1 in the observed frame). We then normalized each smoothed spectrum by a fifth-order polynomial continuum fit to wavelengths usually free from strong emission or absorption (see Appendix A of Hall et al. 2002), adjusted as necessary for each object individually. The AI values calculated from these normalized continua are expected to be underestimated relative to AI values from DR9Q because DR9Q accounts for emission lines in the normalizing continuum and we do not. We find this to be the case for seven out of eight objects where a comparison is possible. It is of course preferable to account for emission lines, but to do so accurately for these unusual objects will require study of their continuum and emission-line properties which is beyond the scope of this work. We calculated AITot between 15000 km s-1 and 15000 km s-1 in general, but adjusted the limits for individual quasars as needed to avoid obvious intervening narrow absorption and to include all intrinsic absorption from the transition under consideration. We do not use the traditional blueshifted limit of 25000 km s-1 to avoid counting redshifted Si iv as blueshifted C iv. We estimated the uncertainties for the velocity limits and AI, AI+ and AITot values by repeating our measurements on spectra normalized using a different method — that of Filiz Ak et al. (2012) — and then calculating the dispersion between those two measurements of each quantity. The average uncertainty on the AI values is 20%. For the velocity uncertainties, we added in quadrature a base uncertainty of 69 km s-1, equivalent to one spectral pixel. The average velocity uncertainty is 450 km s-1; note that this is in addition to the systematic uncertainty on the quasar redshift (the velocity zeropoint).
In the left panel of Figure 13 we compare the cumulative distribution functions of non-zero C iv AI values for visually identified BAL quasars from DR9Q (solid line) with those of redshifted-trough BAL quasars’ AI values (short-dashed line), AI+ values (dotted line), and AITot values (long-dashed line). Although the distribution of AITot in our small sample of BAL quasars with redshifted troughs appears to lack the tail to high values seen in the AI distribution of all DR9Q visual BAL quasars, the difference is not statistically significant: there is a 52% chance of identical intrinsic distributions. (We calculate all probabilities here using a two-sample Kuiper’s test (Press et al. 2007), a variant of the K-S test which is equally sensitive to deviations at all values of the distribution.) The differences between the AI distribution in all visual BAL quasars and the AI or AI+ distributions of BAL quasars with redshifted troughs are only marginally statistically significant, due to our small sample size (3.1% or 0.12% chances of identical intrinsic distributions, respectively, equivalent to or ). The AI and AI+ distributions of BAL quasars with redshifted troughs are themselves statistically indistinguishable (67% chance of identical intrinsic distributions).
Note, however, that despite commonly having low-ionization absorption (§ 4.3), redshifted-trough BAL quasars are completely inconsistent with being a random sample of LoBAL quasars, as traced by DR9Q quasars with Al iii absorption (dot-dashed line). LoBAL troughs are preferentially seen in standard BAL quasars when the C iv absorption is strong (see, e.g., Figures 5 and 6 of Allen et al. 2011), but the C iv AI distribution of redshifted-trough BAL quasars lacks the tail to large AI values seen in standard BAL quasars, let alone in LoBAL quasars.
In the right panel of Figure 13 we plot the redshifted absorption index AI+ versus the (blueshifted) absorption index AI for confirmed and candidate quasars with redshifted absorption. There is no overall correlation between AI+ and AI.
There is a tendency for differently shaped troughs to inhabit different regions of the diagram. In -shaped troughs, the redshifted absorption is always weaker than the blueshifted absorption. The opposite is true in most V-shaped and especially in most -shaped troughs. Selection effects may help explain the latter: -shaped and V-shaped troughs with only a small redshifted component might have been missed in the assembly of our sample, given redshift uncertainties and the difficulty of detecting weak absorption atop broad emission lines. However, selection effects cannot explain the lack of -shaped troughs with stronger redshifted than blueshifted absorption.
More objects and better systemic redshift determinations will be useful in interpreting this diagram. If the separation of different trough shapes in this diagram persists with more objects added and after more study of selection effects, that may suggest that different mechanisms are responsible for different trough shapes.
To summarize, in our objects the AI and AI+ values are uncorrelated overall, but the AITot values are a statistical match to the AI distribution for standard BAL quasars. This result is somewhat surprising, given that our objects are predominantly LoBALs (see § 4.3) and that LoBALs have stronger average C iv absorption than HiBALs. This contradiction indicates that there is likely a different origin for at least the low-ionization absorption in our objects as compared to standard BAL quasars.
4.5 How rare are these objects?
For an approximate estimate of how common BAL quasars with redshifted troughs are, we begin with the SDSS DR5 BAL catalog of Gibson et al. (2009) and the SDSS DR6 BAL catalog of Allen et al. (2011). The strength of a BAL trough can be measured by its balnicity index (§ 4.4). Gibson et al. (2009) quote values for both the traditional balnicity index (BI), measured between blueshifts of 3000 km s-1 and 25000 km s-1, and a modified balnicity index BI0 measured between blueshifts of 0 km s-1 and 25000 km s-1. Allen et al. (2011) only quote BI values.
We have found four SDSS quasars with redshifted C iv absorption (Figure 6) and two SDSS quasars with redshifted Mg ii absorption (Figure 11) which we can compare to SDSS BAL quasar samples.
Of 4664 quasars with C iv BI00 in Gibson et al. (2009), 3 have redshifted absorption (J0028 does not make that cut). Of 3880 quasars with C iv BI0 in Gibson et al. (2009), only J1628 has redshifted absorption. Of 3317 quasars with C iv BI0 in Allen et al. (2011), only J1034 has redshifted absorption. Thus, in the SDSS at most about 1 in 1600 BAL quasars with blueshifted C iv absorption also has redshifted C iv absorption (0.064%, with a 90% confidence range of 0.028%0.124%, based on the BI0 statistics and determined following Gehrels 1986).
The quasars we have discovered with redshifted C iv absorption in the BOSS DR9Q are only marginallly consistent with that result. Of our seventeen quasars with redshifted absorption, two were only included in the BOSS as ancillary targets because of that absorption (J1034 and J1628), one was targeted as a galaxy (J0941), and three others have only redshifted absorption. The remaining eleven have a parent sample of 7228 visually identified BAL quasars at (where BOSS spectra cover Si iv to C iv) in the DR9Q (Pâris et al. 2012). Thus, approximately 1 in 660 DR9Q quasars with blueshifted absorption also has redshifted absorption (0.15%, with 90% confidence range 0.11%0.21%). Note that the overall incidence of quasars with redshifted BAL troughs among BOSS DR9Q quasar targets at is approximately 1 in 5000 (14/69674).
In summary, the frequency of BAL quasars with both blueshifted and redshifted C iv absorption differs by a factor of two between the SDSS and the BOSS surveys, although the 90% confidence ranges overlap due to small-number statistics. If the difference in frequency is confirmed, it might mean that the incidence of redshifted absorption troughs decreases with increasing quasar UV luminosity, as the mean luminosity of BOSS quasars is lower than that of SDSS quasars by about a factor of four. However, a K-S test between the distributions of our sample and of other BOSS BAL quasars reveals no statistically significant discrepancy (22.5% chance of identical intrinsic distributions).
The statistics are somewhat different for redshifted Mg ii absorption. Of 332 quasars with Mg ii BI00 in Gibson et al. (2009), two have redshifted absorption (or three, if the candidate J1316 is confirmed; see Appendix B). Of 244 quasars with Mg ii BI0 in Gibson et al. (2009), two have redshifted absorption. Of 222 quasars with Mg ii BI0 in Allen et al. (2011), two have redshifted absorption. Thus, approximately 1 in 130 BAL quasars with blueshifted Mg ii absorption also has redshifted Mg ii absorption (0.60%, with a 90% confidence range of 0.19% to 1.35%, based on the BI0 statistics of the two confirmed objects). We are unwilling to place much emphasis on this higher abundance of redshifted Mg ii troughs based on two objects, especially since the 90% confidence ranges overlap, but it is clearly worthy of further investigation.
4.6 A distance constraint on the absorber in SDSS J101946.08+051523.7
In Fig. 14 we show a detailed view of the spectrum of J1019 (§ 3.2). J1019 may have absorption in C iii*, a set of transitions arising from levels with an excitation potential (EP) 6.5 eV above the ground state. C iii* can be a useful density diagnostic due to the range of critical densities of its different levels (section 4 of Gabel et al. 2005). J1019 also has absorption in Fe iii UV34 1895,1914,1926 (EP 3.73 eV, cm-3), Fe iii UV48 2062,2068,2079 (EP 5.08 eV, cm-3) and Fe iii UV50 (EP 7.86 eV, cm-3), a multiplet spanning 1987–1996 Å. The Fe iii troughs appear to extend to redshifted velocities as large as seen in C iv and larger than seen in Al iii. The short-wavelength end of the Fe iii UV34 trough appears to be filled in by emission from a combination of C iii], Si iii], and Fe iii UV34 itself.
Strong absorption from Fe iii without strong accompanying Fe ii absorption is rare in part because it occurs only for absorbers with column density too low to form a hydrogen ionization front (outside of which Fe ii will form) and with electron densities sufficiently high ( cm-3) to increase the recombination of Fe iv to Fe iii (Rogerson et al. 2011, section 4). Such densities have also been seen in outflowing gas in NGC 4051 (King, Miller & Raymond 2012). J1019 and possibly J1316 (Appendix B) represent the first reported detections of Fe iii UV50 absorption in quasars. Its rarity is explained by the relative populations of the ground states of the UV34, UV48 and UV50 multiplets at cm-3 and K; namely, 1:0.16:0.016 (Bautista & Pradhan 1998).
Thus, the density in the medium causing the absorption at redshifted velocities of thousands of km s-1 in J1019 is higher than the gas-phase densities found everywhere else in a galaxy, except in accretion discs (e.g., Fig. 1 of Hopkins & Quataert 2010). Even protostellar cores in molecular clouds only reach gas-phase densities of cm-3 (di Francesco et al. 2007). If this dense gas is in fact accreting onto the quasar, it must have been compressed at some stage in the accretion process.
This lower limit on the density enables us to set an upper limit on the distance of the absorbing gas from the ionizing continuum source by rearranging the definition of the ionization parameter : where is the number of hydrogen-ionizing photons emitted per second. J1019 is almost exactly an order of magnitude less luminous than the quasar studied by Moe et al. (2009), so its value of should also be an order of magnitude less: . With Fe iii most abundant at (de Kool et al. 2002),141414It is possible to see Fe iii absorption at ionization parameters , but the relative strengths of absorption from Fe iii and from Fe ii in the object cannot be reproduced at such parameters. To see Fe iii UV50 at over the width of the trough in J1019 requires cm-3, which is sufficient to generate a hydrogen ionization front and accompanying Fe ii absorption unless (Figure 6 of de Kool et al. 2002). We adopt a slightly lower value of to place a conservative upper limit on the distance of the absorbing gas. we conservatively estimate that the absorbing gas in this object is located at pc, with an uncertainty in this upper limit of about a factor of two. High resolution spectroscopy of J1019 (and possibly J1316) will be extremely useful for measuring or setting limits on the column densities in the Fe iii lines to obtain more accurate value of and and thus of .
5 Possible explanations
Having established the reality and incidence of redshifted absorption in BAL quasars, we now consider possible explanations for redshifted absorption, more than one of which may be at work in our sample. We consider gravitational redshifts, infall, rotating outflows, binary quasars, and the relativistic Doppler shift.
Where relevant, as a fiducial example we consider a 108 black hole surrounded by a standard Shakura & Sunyaev (1973, hereafter SS73) disc with accreting at a fraction of the Eddington rate. The disc’s surface temperature profile is approximately (SS73 Eq. 3.5, but see Blackburne et al. 2011), so the physical diameter of the region of an SS73 accretion disc which emits significant continuum at wavelength can be written as
| (4) |
for a black hole of mass . The crossing time of the 1550 Å continuum region of this fiducial BH and accretion disc for gas moving at percent of the speed of light is 210/ days. For example, gas moving at 300 km s-1 across the line of sight, a plausible speed in the core of a massive galaxy, would have a crossing time of 5.75 years.
5.1 Gravitational redshifts
Dorodnitsyn (2009, 2010) have shown that various wind velocity laws plus gravitational redshifting can lead to a variety of redshifted and blueshifted troughs being produced by spherically symmetric winds, provided they are launched within of the black hole. However, we can rule out gravitational redshifts as the sole explanation for redshifted absorption in our objects. The gravitational redshift of a transition seen in absorption or emission at radius around a Schwarzschild black hole is given by
| (5) |
A purely gravitational redshift explanation for our objects would require absorption from gas at to explain redshifted velocities between 3000 and 14,700 km s-1. Such radii are comparable to the ultraviolet continuum emission region sizes of quasars. Unshielded gas at such small radii would be too highly ionized by that continuum (or too dense, in the accretion disc itself) for ions such as C iv to exist (e.g., Murray & Chiang 1998). However, gravitational redshifting may contribute to the observed redshifted velocities of absorption from a rotating, shielded wind launched from within or just outside the continuum emission region; see § 5.3.1.
5.2 Infall
Simple infall of gas on large scales is a reasonable explanation for absorption at redshifted velocities characteristic of dark matter halos; i.e. up to a few 100 km s-1 in galaxies151515Silhouetted absorption from an expanding structure within the galaxy hosting the quasar is a related possibility. For example, supernova remants (SNRs) are larger than quasar continuum emission regions, can show absorption from a wide range of ionization stages, and have asymmetries which can vary the ratios of blueshifted and redshifted absorption (though probably not enough to explain -shaped troughs). Some SNRs are likely to be created at relatively small distances from quasars as a result of star formation in the outer regions of quasar accretion discs (Collin & Zahn 1999), which would increase the covering factor of SNRs around quasars. However, the density in such discs is likely to be high enough to greatly suppress the expansion of such SNRs (§ 2.1 of Thompson, Quataert & Murray 2005). SNRs can have expansion velocities of 10,000 km s-1 or more, but the gas moving at such velocities is typically too highly ionized to absorb at UV wavelengths (Hayato et al. 2010). The swept-up gas which can show absorption in ions such as O vi typically does so over a velocity range of only hundreds of km s-1 (Jenkins, Wallerstein & Silk 1976). Furthermore, absorption from cool supernova ejecta free-expanding at thousands of km s-1 in the interior of a SNR is seen only in elements such as Ca, Si and Fe in ionization stages I to IV (Winkler et al. 2005), which can produce spectra very different from those of our objects or of standard BAL quasars (Wu et al. 1997; Fesen et al. 1999). Thus, a silhouetted SNR explanation seems unlikely for these objects, although it should be kept in mind. and up to a few 1000 km s-1 for galaxies in galaxy clusters. However, the widths of the absorption troughs in our objects rule out direct infall explanations except in the narrowest cases (2000 km s-1 or so). Absorption from an infalling galaxy (or the quasar host galaxy) could conceivably produce such linewidths if its gas is affected by a merger or a starburst-driven wind. Iono et al. (2007) find gas motion spanning a range of 1200 km s-1 in the central kpc of the merging binary AGN NGC 6240. Steidel et al. (2010) find that O i 1302 absorption in Lyman-break galaxies can span a velocity range of at least 700 km s-1 infall to 1000 km s-1 outflow (their Figures 6, 9 and 10). In our sample, only J0050 (see Appendix B), J1125, and perhaps J1128 have such narrow troughs. Absorption from a galaxy is a possible explanation for J0050. However, the Fe ii absorption blanketing the spectrum of J1125 and J1128 is much stronger than is ever seen in star-forming galaxies (Farrah et al. 2005). Also, neither J1125 nor J1128 host luminous starbursts detectable in the far-IR (Farrah et al. 2012).
To generate absorption at infall velocities 3000 km s-1 toward the UV continuum sources in these quasars requires gas infall along our line of sight (and others, if the infall is not purely radial) down to radii small enough to generate such velocities. To a good approximation, the maximum velocity gain achievable through infall to radius is the escape velocity from that radius (), so if redshifted absorption at velocity is caused by gas radially infalling towards the quasar, then . The maximum observed ( km s-1) in our sample requires infall to . This calculation agrees within a factor of two with the 3-D simulations of Kurosawa & Proga (2009), in which infall velocities of 4500 km s-1 to 7000 km s-1 can be reached at (their Figures 7 and 8), and of Barai, Proga & Nagamine (2012), in which infall velocities of 1500 km s-1 to 2000 km s-1 can be reached at (their Figure 3). Such velocities are reached in their models if the infall is weakly rotating and is viewed close to perpendicular to its rotation vector. The corresponding 2-D simulations of Proga, Ostriker & Kurosawa (2008) yield very similar maximum infall velocities (Proga, personal communication). Similarly, the 2-D simulations of Li, Ostriker & Sunyaev (2012) show that free-falling inflows can reach . However, it remains to be seen whether or not these simulations can reproduce the large optical depths observed at these redshifted velocities in our objects.
Simulations of gas inflow on larger scales in galaxy nuclei have been performed by, e.g., Levine et al. (2008), Hopkins & Quataert (2010), Hobbs et al. (2011) and Gaspari, Ruszkowski & Oh (2013). Levine et al. (2008) find that a flattened but thick circumnuclear disc () is formed, containing large-scale structure such as spiral waves and bars. However, the average inflow velocity is only 10% of the rotational velocity at each radius in their simulation domain ( pc). Hopkins & Quataert (2010) find inflow velocities of 0.01–0.3 times the rotational velocity in their simulations (their § 4). At scales of 1–10 pc, they find that eccentric discs or single-armed spirals can form and drive gas inwards. However, even in the extreme case of plunging hyperbolic orbits for such gas, the maximum inflow velocity achieved will be only times the Keplerian velocity at the innermost radius of the flow plus the turbulent velocity with which the gas began its infall (1000 km s-1). Hobbs et al. (2011) argue that supersonic turbulence can lead to the formation of dense filaments which fall ballistically towards the black hole. Their model may be a promising way to explain our objects, but their study is confined to scales 1 pc, making direct comparison difficult. Gaspari et al. (2013) make a similar argument using simulations that extend down to sub-parsec scales, but do not report gas infall velocities.
The absorbing gas in our objects has avoided overionization and is experiencing a net outward force from scattered UV radiation, so why is it infalling? One possible answer is that the absorbing gas is unusually dense, which might also help explain the high fraction of LoBALs in our sample (§ 4.3). Denser gas will have a lower ionization parameter, all else being equal, and is plausibly more likely to form optically thick structures. Such structures are less likely to be driven into outflow by a quasar’s radiation pressure (in the absence of velocity gradients, only the inner face of an opticallly thick gas clump will scatter UV lines to provide an outward force, but the entire clump mass will feel the inward force of gravity). Thus, dense gas clumps formed by swept-up lower-density gas may end up in infall (Nayakshin & Zubovas 2012).
In this scenario, more variability should occur at larger redshifted velocities than at smaller ones, because gas with larger infall velocities is likely to have larger transverse velocities as well. (Note that standard BAL quasars exhibit greater trough variability at higher trough outflow velocities, which is likely due to higher transverse velocities in such troughs; see Capellupo et al. 2011 and Filiz Ak et al. 2012.) For troughs broader than can reasonably be produced outside the nucleus of a galaxy (1000 km s-1 or so), the longer the troughs are seen not to vary, the more ordered the infall has to be, and the less likely infall becomes as a hypothesis.
A key test of the infall hypothesis will be to compute absorption profiles for the simulations to determine if they can match the apparent optical depths of the ionization stages seen in these objects (e.g., Sim et al. 2012). In observed cases where the absorption profiles are smooth over a large velocity range, the infall motions must be ordered so that our line of sight intercepts most of the infall trajectory. In that case the gas must have lost considerable angular momentum and have avoided shocking to unobservably high temperatures and ionization stages during the accretion process. Gas with such properties will be rare, but redshifted BAL troughs are also rare. Therefore, an explanation postulating infall velocities of 3000 km s-1 in some of these objects remains potentially viable.
However, in this scenario, infalling redshifted troughs and outflowing blueshifted troughs should have nothing to do with each other, so there is no reason to expect their absorption index distributions to be statistically indistinguishable, as observed (§ 4.4), nor to expect the distribution of their summed absorption indices (AITot) to be a statistical match to the AI distribution for standard BAL quasars.
Furthermore, we can argue against infalling gas in some objects following § 4.2 of Martin & Bouché (2009), who point out that the covering factor of optically thick structures in a wind changes in a predictable way with radius. In BAL quasars where C iv and Si iv are of comparable depth, the absorbing gas is almost certainly optically thick, with the depth of the troughs determined by the covering factor of the absorbing structures (Crenshaw et al. 2003; Arav et al. 2008). Regardless of whether these structures are outflowing or infalling, if they are located in a gaseous halo with pressure profile then their volume will adjust at different radii so as to maintain pressure equilibrium (). We can thus write where we assume , appropriate for a monatomic, ideal gas undergoing adiabatic compression. For clouds that keep the same shape and orientation as their volume changes, the covering factor is given by the area of the clouds () relative to the area of the sphere at that radius: . For an isothermal sphere , yielding . For the covering factor to decrease with decreasing radius would require an implausibly steep pressure profile with .
For radially infalling gas, we have , which yields for the isothermal case and in general. Thus, unless , troughs from infalling gas undergoing adiabatic compression should have covering factors which increase with redshifted velocity until the gas leaves our line of sight or the ion in question vanishes due to increasing ionization (from shocks, photoionization of lower-density fragments created from instabilities in the main clump, or both). Conceptually, gas clumps free-falling toward a quasar do not shrink as fast as the surface area around the quasar shrinks (unless the pressure increases implausibly fast with decreasing radius), leading to an increasing covering factor with increasing redshifted velocity. This effect can be seen in the simulated clumpy accretion flows of Barai et al. (2012, their Figure 2 or Figure 7).
Note that the ionization parameter depends on the ionizing luminosity , the distance , and the gas density : . Thus, under our assumptions the ionization parameter will increase with decreasing radius for , following in the isothermal case. With , we have in the isothermal case and in general. There is no clear sign in our objects for an overall trend of increasing ionization (as traced by the Al iii/C iv ratio) with increasing redshifted velocity. It can be is difficult to determine the extent of redshifted troughs of Al iii due to confusion with the broad emission complex at 1900 Å. Nonetheless, in some objects (e.g., J0830 and probably J1709) the troughs of Al iii, N v and C iv all appear to have the same redshifted extent, while in others (e.g., J1019 and J1724), Al iii is limited to less redshifted velocities.
In summary: for the case of adiabatic compression, infalling gas is ruled out as an explanation for redshifted troughs with V-shaped profiles, but infall remains a possibility for those and -shaped profiles wherein the covering factor initially increases with increasing redshifted velocity. Such an increase is found in seven out of the eleven objects with or -shaped profiles in our sample (J0828, J0941, J1019, J1146, J1440, J1709 and J1724) and in the candidates J0050 and J1342, and may be found in other objects (e.g., J0830) depending on the exact values of their systemic redshifts. The above conclusion does depend on our assumption of constant cloud shape. Abandoning that assumption, reconciling the case of adiabatic compression with our observations would require between 2 and (to match the behaviour of with velocity) and clouds which radially elongate in those respective cases by a factor of 106/5=16 to 102/3=5 per factor of ten decrease in radius (to match the behaviour of with velocity). Detailed simulations involving heating and cooling may also show infall to still be a possible explanation for our objects.
5.3 Rotating accretion disc winds
As mentioned in § 1, Ganguly et al. (2001) and Hall et al. (2002) have noted that redshifted absorption can occur when an extended emission source is seen through a rotating outflow. Specifically, the outflow must have a rotational velocity which dominates the component along our line of sight of its poloidal (nonazimuthal) velocity. To yield redshifted velocities of 1000 km s-1, the inner radius of the outflow should also be no more than 10 times larger than the radial extent of the continuum source (Hall et al. 2002, § 6.5.2 and thereafter). In a rotating disc-wind model, discs viewed at high inclination (close to edge-on) will always be more likely to produce redshifted absorption. Unobscured high inclination sightlines will be rare in models where the obscuring torus (or equivalent) is coplanar with the disc, but are possible with tilted but not twisted discs as obscurers (e.g., Lawrence & Elvis 2010).
The rotating wind scenario is consistent with the result that the AITot values for these objects have the same statistical distribution as in standard BAL quasars. Conceptually, one can imagine gas which is distributed over a range of blueshifted velocities in standard BAL quasars being seen near its launch radius, where it is rotating over a range of blue- and red-shifted velocities.
The high fraction of LoBALs in our sample (§ 4.3) might be understandable in this scenario if the absorbing gas is of relatively high density, resulting in outflows with lower terminal velocities. That would enable redshifted velocities due to rotation to be dominant over a larger range of outflow distances in these objects than in standard BAL quasars.
5.3.1 Velocity profiles of rotating disc wind absorption
To estimate the relevant properties of a rotating disc-wind, we consider our fiducial 108 black hole and SS73 disc with cm = 92 . We adopt an inner wind launching radius of cm = 1255 (Elvis 2000; Murray & Chiang 1998), at which km s-1. For a wind terminal velocity greater than 8500 km s-1 (the escape velocity from ), we find that redshifted velocities of up to 600 km s-1 in C iv can be reached in either the Elvis or Murray et al. model (assumed launching angles of 27∘ and 6∘, respectively).
Larger redshifted velocities can be produced if the inner wind launching radius is closer to the continuum emission region. That could arise if the continuum region is larger than predicted by SS73, which observationally does seem to be the case: quasar half-light radii at rest-frame 1736 Å are larger than predicted by a factor of 5 (Jiménez-Vicente et al. 2012) to 15 (Blackburne et al. 2011), on average. Increasing the continuum source by a factor of 5 makes redshifted velocities of up to 2150 km s-1 possible. A factor of 15 increase, so that , makes a redshifted velocity of up to km s-1 possible. Such a velocity is within a factor of two or three of the largest redshifted velocities seen in our sample.
Equating the highest redshifted velocities in our sample with implies a wind launch radius as small as in this model. Such an would be within the observationally determined UV continuum emission region. The simulations of Proga & Kallman (2004) indicate that winds can be launched from radii as small as , but how much C iv absorption is likely to arise at those radii is an open question.
The redshifted velocities from a rotating disc wind might also increase with . For an SS73 disc at fixed Eddington ratio, (Equation 4); if scales the same way then , increasing the maximum redshifted velocities by a factor of 2.15 for the most massive black holes with . However, if scales linearly with then the maximum redshifted velocity is independent of .
Two properties of our objects’ absorption profiles are relevant to the rotating wind model.
All our objects except J0028 (and the candidates J1342 and J1704) have C iv absorption which extends farther in the redshifted velocity direction than in the blueshifted velocity direction. Azimuthal asymmetries in rotating winds can in principle explain this result; such asymmetries will eventually disappear due to rotation, and objects with winds hosting such asymmetries will still over the long term have larger blueshifted than redshifted velocities.
Also, rotating winds launched at large radii cannot have redshifted trough depths greater than 50%, as seen in J0830, J1019, J1709, J1724 and probably J2157. Because at most half of the outflow is rotating away from the absorber, only half of the continuum source will be seen through redshifted absorption.
Both of these properties may be explainable with gravitational redshifting. If the absorption arises at small enough radii, gravitational redshifting will shift the absorption profile to more redshifted velocities, making it possible for more than half of the continuum source to be seen through redshifted absorption. The 3800 km s-1 average difference between maximum absolute blueshifted and redshifted velocities would require some absorption to arise at an average . However, the lack of cases of absorption extending farther in the blueshifted direction than in the redshifted direction, and the lack of any blueshifted absorption in some cases, might require a failed wind in these objects. In other words, in this model the redshifted absorption might have to arise at such small radii that the observed velocities are due solely to rotation and gravitational redshifting, with no actual outflowing velocity component to extend the profiles farther in the blueshifted direction than in the redshifted direction.
5.3.2 Numerical simulations of rotating disc winds
Some numerical disc-wind outflow models have predicted absorption troughs spanning both blueshifted and redshifted velocities, at least for some parameter choices. For examples, see Figures 7 and 9 of Knigge, Woods & Drew (1995), Figure 1 of Proga et al. (2002), Figure 1 of Proga (2003), and Figure 3 of Proga & Kallman (2004).161616Absorption troughs spanning roughly 2000 km s-1 around a systemic redshift have been seen in nova-like variables in our Galaxy (e.g., Figures 1c and 2c of Hartley et al. 2002). Those authors attributed the absorption to rotationally broadened photospheric features from an accretion disc, which is not a viable explanation for quasars because the broadening will be 0.1 in the ultraviolet continuum emitting region of quasars (few tens of ).
Furthermore, some profiles in Proga et al. (2002) show distinct blueshifted and redshifted absorption troughs (their Figure 1, panels c, d, h and i), similar to those seen in J1034 and J1628. These troughs arise at relatively large inclination angles () when considering only absorption from wind radii 10 times the continuum source size. When the same models are extended to follow the wind to larger radii (Proga 2003), additional absorption at small line-of-sight velocities is seen between the blueshifted and redshifted absorption, resulting in an absorption profile spanning both blueshifted and redshifted velocities.
Therefore, one possibility for producing distinct blueshifted and redshifted absorption troughs is a rotating wind more ionized at large radii than in the models of Proga (2003). Such a situation could occur if the density in the wind were to drop off more rapidly with distance from the black hole than assumed in those models (due to more efficient acceleration, for example), or perhaps if the overall density in the wind were lower. Such density profiles being uncommon could help explain the rarity of BAL quasars with redshifted absorption. Further work on simulated line profiles including gravitational redshifting and resolved continuum emission regions (e.g., Proga, Rodriguez-Hidalgo & Hamann 2012) will be useful in untangling how redshifted absorption troughs arise.
5.3.3 Absorption variability in rotating disc winds
Absorption at only systemic and redshifted velocities can be produced by an azimuthally asymmetric outflow with absorbing gas present in the receding part of the silhouetted rotating outflow but not the approaching part. That scenario makes a specific prediction that the parcels of redshifted absorbing gas will each move to larger redshifted velocities as the flow rotates, so that the low-velocity end of the trough moves to higher velocities until the trough disappears. Any new absorption components rotating into view should appear as blueshifted absorption. Note that the component of the poloidal velocity perpendicular to our line of sight can complicate the above picture by limiting the range of line-of-sight velocities through which a gas element flows as it crosses the continuum source.
Azimuthal asymmetries can also produce variability in objects in which rotating disc winds produce both blueshifted and redshifted troughs. The variability of the absorption in J1125 (Fig. 12) is potentially consistent with the model: the blueshifted absorption weakened more than the redshifted, consistent with rotating absorbing gas moving from blueshifted to redshifted velocities. However, the variability of the blueshifted and redshifted absorption in J1034 (Fig. 7), J1128 (Fig. 12), and J1628 (Fig. 8) does not follow the above pattern, arguing against the rotating disc-wind model. In the first two cases the redshifted absorption weakened while the blueshifted did not (although that behaviour might be explained by poloidal velocity, as mentioned above). In the case of J1628, the redshifted absorption trough moved toward zero velocity, consistent with a decelerating inflow but not a rotating disc.
We can write the time required for gas with an azimuthal velocity equal to the Keplerian velocity at its radius of to pass in front of the continuum-emitting region of the accretion disc () in units of the orbital timescale at as
| (6) |
As increases, this ratio declines from 0.5 at to a minimum value of 0.412 at 1.2 before increasing to 0.5 at 2.3 and 1 at 10. (Note that the above is a lower limit to the true crossing time, as angular momentum conservation lowers the rotational velocity of outflowing gas far from its launch radius below the Keplerian velocity at that radius. However, such gas is unlikely to produce redshifted absorption.)
For the 1550 Å continuum-emitting region around our fiducial black hole, years and years, where is the inner edge of our fiducial wind. For five times larger, years and years. Because (Equation 4) and , . Assuming , both and are a factor of ten longer for the most massive black holes ( ).
Thus, variability on a timescale dependent on the continuum source size and black hole mass is expected in this model, with the most common variability pattern being absorption appearing at blueshifted velocities and moving to redshifted velocities. Note that variability can be avoided if the winds have sufficiently small azimuthal variations in their covering factors and/or transmitted flux over more than one orbital time. (and large azimuthal variations in can occur without causing variability as long as is always satisfied.) Such high levels of symmetry would only be possible for -shaped and -shaped troughs, as azimuthal asymmetry is required to explain V-shaped troughs in this model. Whether such high levels of symmetry are possible is an open question, but some BAL outflows do appear to have substantial azimuthal symmetry (e.g., Gibson et al. 2010).
5.3.4 Summary: rotating disc winds
A rotating disc wind model can in principle produce the redshifted velocities observed in these objects, but such a model has difficulty explaining the observed variability in several of our objects. Gravitational redshifting may help explain the prevalence of absorption that extends farther in the redshifted velocity direction than the blueshifted, as well as the four or five cases of redshifted troughs with depths greater than 50% of the continuum, but overall, a simple rotating disc wind model does not cleanly explain all objects in our sample. Determining how often, if ever, rotating outflows can exhibit the parameters required to match these redshifted troughs will be a useful goal for analytic and numerical simulations.
5.4 Silhouetted outflows in binary quasars
Quasars inhabit massive dark matter halos, which are highly clustered
(e.g., Tegmark & Peebles 1998; Shen et al. 2007).
Therefore, close binary quasar systems should exist,
and in fact numerous examples are known (e.g., Hennawi et al. 2006).
A binary quasar system can produce a quasar with a redshifted BAL trough
if the following conditions are met:
1) The quasar physically farthest from us is at a redshift
given by the emission lines seen in the SDSS spectrum.
2) The quasar physically closest to us:
emits many fewer photons along our sight-line than does
the background quasar (so that its broad emission lines are not obvious
in the combined spectrum),
produces a BAL outflow,
and is oriented such that the background quasar backlights at least
part of the outflow with a relative radial velocity vector that produces
redshifted absorption.171717It is possible
for the wind from the background quasar to be oriented so as to pass between us
and the foreground quasar, but such an orientation can only produce redshifted
absorption through the relativistic Doppler effect (§ 5.5).
This scenario is viable in cases where the quasars are far enough
apart ( pc or so) that they do not dramatically disrupt
each other’s accretion discs, fueling, or BAL outflows.
A large projected area of the flow on the sky increases the chance of backlighting, and some BAL outflows are known to extend to kpc scales (e.g., Edmonds et al. 2011, and references therein). Different parts of the outflow along the same sightline could have different redshifts or blueshifts. The binary scenario may be favored for V-shaped troughs, which have the appearance a standard BAL outflow might have if it were pointed away from the observer and then backlit.
We inspected available images of our objects for evidence supporting a binary quasar scenario for their spectra. The SDSS imaging pipeline classifies all objects as unresolved except for J0941, which is morphologically extended (§ 3.2).181818J1034 has an unresolved, red object 462 away which was not selected as a quasar candidate in the SDSS, and therefore is likely to be a late-type star. Near-IR imaging from UKIDSS (Warren et al. 2007) confirms that J0941 is not a pure point source, but yields no evidence for binarity in J0805, J1019, J1439 or J2157. Also, deep coadds of SDSS imaging data in Stripe 82 (Annis et al. 2011) show no evidence for binarity in J0028 or J2157. However, the angular separation of any putative binary quasar could be much smaller than the value needed to make SDSS or UKIDSS images elongated, and the foreground quasar could also be obscured. To confirm or reject the binary scenario for individual objects would require high-resolution imaging, multiwavelength photometry, or near-IR spectroscopy to search for narrow line emission at two redshifts. Note that there is no evidence for two narrow-line redshifts in our two low-redshift quasars with redshifted Mg ii absorption (Figure 11).
The conditions outlined in this section are very similar to those proposed by Civano et al. (2010) as one scenario to explain the AGN CXOC J100043.1020637 (hereafter CXOC J1000). That object hosts two compact optical sources in the same galaxy and has a broad-line redshift which is higher by 1200 km s-1 than the narrow-line redshift. It also exhibits a strong X-ray iron emission line accompanied by redshifted iron absorption. In contrast to our objects, the absorption in CXOC J1000 is deepest at the longest wavelengths (greatest redshifted velocities). Civano et al. (2010, 2012) suggest that the foreground object in that system could be a heavily obscured Type 2 (narrow-line) AGN with an outflowing, high-velocity, highly ionized wind backlit by the X-ray continuum of a background Type 1 (broad-line) AGN. The velocity vector of the backlit portion of the wind must be oriented so as to produce a redshift. The large velocity difference between the redshfts of the two AGN could arise from a gravitational interaction.
Another effect may be at work in this model, for both CXOC J1000 and any binary quasar in our sample. If the wind from the foreground object has a sufficiently large velocity, the relativistic Doppler shift can produce significantly redshifted absorption even when the backlit wind is directed near the plane of the sky. We discuss the relativistic Doppler shift in § 5.5.
5.4.1 Expected number of silhouetted outflows in the BOSS DR9Q
We can estimate whether or not the abundance of BAL quasars with redshifted troughs is consistent with a scenario explaining them as silhouetted outflows in binary quasar systems.
We start with 69674 BOSS quasars examined for redshifted troughs. At , 5 kpc is a separation small enough for the system to appear unresolved in SDSS imaging. Approximately 0.040.01% of luminous SDSS quasars have binary companions at projected radii between 5 and 100 kpc (Myers et al. 2007, 2008; Hennawi et al. 2010). The binary fraction at projected radii 5 kpc is likely to be a factor of 10 lower, based on how long merging or interacting galaxies spend at a given projected separation (Liu et al. 2011). Thus, we expect only 3 binary quasars at 5 kpc separation in the 69674 BOSS DR9Q quasars. Even if we make the extreme assumption that all quasars in such close binaries host BAL outflows with covering factor =100% out to a radius of 5 kpc, only half of such binaries will have an optically faint or obscured quasar as the foreground object and an optically brighter quasar as the background object, as required in our scenario.
Thus, while a small number of silhouetted outflows may be present in our sample, to explain our entire sample with them would require binary quasars at projected radii 5 kpc to be a factor of 10 more abundant than current studies indicate. Furthermore, their outflows would have to have a geometry and distribution of covering factors able to explain why both blueshifted and redshifted absorption are seen in 10 out of 13 objects targeted by the BOSS as quasar candidates. That fraction is much larger than expected if blueshifted and redshifted absorption are uncorrelated.
5.5 Relativistic Doppler shifts
A final possibility for producing redshifted absorption is the relativistic Doppler shift (Einstein 1905). In its own rest frame, an ion absorbs at the rest wavelength of a given transition. In a frame in which the ion is moving (in any direction) then — in addition to the normal Doppler shift — time dilation means that the ion will absorb photons of a lower frequency (longer wavelength). Normally the time dilation factor is negligible, but it has been observed in the Galactic microquasar SS 433 in emission lines which arise from two oppositely directed jets moving at 0.26 near to the plane of the sky (Abell & Margon 1979). If there is absorbing gas in some or all of these BAL quasars moving at a sufficiently high speed over a range of angles close to the plane of the sky, the resulting absorption will be seen at a range of velocities which can span both blueshifts and redshifts relative to the quasar rest frame.
In Appendix D we discuss some underappreciated aspects of the relativistic Doppler shift relevant to line absorption (for example, absorption at a given blueshifted wavelength does not uniquely determine the velocity of the outflow even if its angle to the line of sight is known). Few papers on the effects of the relativistic Doppler shift on absorption have appeared in the astronomical literature (Sher 1968; Hovsepyan 1998; Wang 2011), in contrast to the numerous papers applying it to line emission in quasars (beginning with Mathews 1982), In this section we consider only the potential application of the relativistic Doppler shift to the absorption in our objects. We use to denote the angle relative to our line of sight, with pointing away from us and denoting the plane of the sky.
As an example, for a flow reaching the highest speeds seen in quasar outflows (), a range of angles centered slightly toward the line of sight () would be sufficient to explain the trough in J2157 (approximately 2000 km s-1 to 10,000 km s-1). For a flow reaching a top speed of only , reproducing the same trough would require twice as wide a range of angles, centered slightly away from the line of sight (). Similarly, gas at a range of speeds from at would produce redshifted troughs spanning 0 to +6000 km s-1, but an identical trough could be produced by gas at lower velocities directed slightly away from the observer ().
Producing redshifted troughs via the relativistic Doppler effect does not require large gas inflow velocities, but does require even larger velocities nearly transverse to our line of sight to a quasar’s continuum source. One scenario which could generate large transverse velocities is a nearly vertical outflow launched from small radii, where the initial rotational velocity and radiative acceleration are both large, and viewed at a large inclination angle.
The relativistic Doppler effect also could be a factor if any object is involved in a binary quasar scenario (§ 5.4). In that scenario, the outflow velocity as well as the rotational velocity can contribute to the transverse velocity.
In either case, large transverse velocities should result in variability in the redshifted troughs on the crossing timescale of the continuum source by the gas. Gas moving at crosses the 1550 Å continuum region of our fiducial BH + SS73 disc in 21 days. The crossing time would be at most 2.2 times longer at 2800 Å than at 1550 Å for an SS73 disc, but could be 5 to 15 times longer at both wavelengths (105 to 315 days) given the observationally inferred sizes of quasar continuum source regions (Blackburne et al. 2011 and § 5.3.1). For the most massive black holes (1010 ), assuming a continuum source 5 to 15 times larger than a SS73 disc that nonetheless scales as (Equation 4), the continuum source crossing time at would be 6 to 18 years.
6 Discussion
We have presented observations of seventeen quasars with redshifted broad absorption in C iv and Si iv (and often in numerous other transitions) and new observations of two previously known quasars with redshifted broad absorption in Mg ii.
Roughly 1 in 1000 BAL quasars has redshifted C iv absorption (§ 4.5), although such absorption appears to be more common in the SDSS-III/BOSS DR9 quasar catalog (1 in 660) than in the SDSS-I/II DR7 quasar catalog (1 in 1600). Why these objects are so rare, given that infalling matter is ultimately the power source for all quasars, is not clear.
The absorption in these objects can extend to velocities of 10,000 km s-1 and appears just as saturated as absorption in standard, blueshifted BAL troughs does. The trough shapes can be classified as either -shaped, V-shaped or -shaped (§ 4.2). Although absorption at the systemic redshift in these objects sometimes reaches zero flux within the noise, none of their redshifted absorption troughs do so, meaning that the redshifted absorption does not fully cover the continuum source. The redshifted absorption does not need to cover the broad emission line region to explain the observations (with one exception), but we cannot rule out equal covering of both the continuum and emission ine regions.
We have used the absorption index (§ 4.4) to measure the strengths of the blueshifted absorption (AI), the redshifted absorption (AI+), and the total absorption (AITot) in these objects. The AI and AI+ values are uncorrelated overall, but their distributions are statistically indistinguishable. The AITot distribution is statistically consistent with the AI distribution of standard BAL quasars, although the AITot distribution lacks a tail to very strong troughs. In other words, the redshifted velocities of these troughs are unusual, but their overall strengths are not.
Based on our sample, at least 50% of quasars with redshifted C iv absorption are LoBAL quasars, as compared to 5% of standard quasars being LoBAL quasars (§ 4.3). However, the AITot distribution of these objects is not at all consistent with the AI distribution of standard LoBAL quasars (§ 4.4). The low-ionization gas in these objects appears to have a different origin than in standard LoBAL quasars.
In one or two cases where high-excitation Fe iii absorption is seen (§ 4.6), we infer that the absorber has a very high density ( cm-3) and a small distance from the ionizing continuum source ( pc).
We have discussed possible explanations for redshifted troughs including gravitational redshifts (§ 5.1), infall (§ 5.2), rotating disc-wind outflows (§ 5.3), outflows from one member of a binary quasar pair seen in absorption against the other (§5.4), and the relativistic Doppler effect in outflows moving close to transverse to our line of sight (§ 5.5). None of these explanations by themselves seems likely to explain all our objects.
The binary quasar scenario can explain the observed range of trough shapes, velocities and absorption indices. However, a factor of 10 excess in the numbers of close binary quasars over the predictions of current studies would be needed to explain our sample entirely as binary quasars; this scenario cannot be the dominant explanation.
As alluded to in the title of our paper, we are left with two main scenarios to explain these objects. It is possible that some of our objects will be explained by one scenario and some by the other.
Infalling gas undergoing adiabatic compression is expected to have an increasing covering factor with infall velocity, making it a plausible explanation only for some -shaped and -shaped troughs. The infall velocities observed in our objects have been seen in simulations of gas infall in quasars, but whether the gas at those velocities can match the large optical depths observed in C iv and other species is not clear. In this scenario, the high fraction of low-ionization redshifted troughs would be due to preferential infall of high-density gas. However, the match between the distributions of AITot in BAL quasars with redshifted absorption and AI in standard BAL quasars is not explained by this model.
Rotation-dominated disc winds can explain the distributions of absorption indices in these objects, at least for -shaped and -shaped troughs. Rotation plus gravitational redshifting can in principle explain the range of trough shapes and velocity extents in this scenario. Low-ionization absorption might be preferentially seen in this model due to winds with relatively high-density gas having relatively low terminal velocities (perhaps not even exceeding the escape velocity), enabling redshifted velocities due to rotation to dominate the absorption profile. However, the variability properties available for a subset of our objects (see below) do not match the predictions of this scenario.
6.1 Variability in different scenarios
The observed variability of BAL troughs is believed to be due primarily to tranverse motions of absorbing gas across the continuum source (e.g., Gibson et al. 2010; Hall et al. 2011), although cases are known where the variability in narrower quasar outflows are more consistent with changes in the ionization of the absorbing gas (Misawa et al. 2007; Hamann et al. 2011). In this section we discuss what each scenario considered herein for the origin of redshifted BAL troughs might predict for the variability of those troughs. Future spectroscopic observations of these objects will be required to test these predictions. In all cases, what matters for variability is the transverse motion of the absorber and its size relative to the continuum source, not the distance of the absorber from the continuum source; as both are at the same cosmological distance from us, only their relative sizes matter.
In each of our suggested models for redshifted troughs, strong variability on timescales of less than a year is possible because large transverse motions are possible. Not observing rapid variability in any of these objects over time would constrain the rotating wind model to ever greater azimuthal symmetry, the infall scenario to more ordered infall, the binary quasar scenario to smaller transverse velocities, and would rule out a substantial contribution from a relativistic Doppler shift.
In the infall scenario, more variability should occur at larger redshifted velocities, because gas with larger infall velocities is likely to have larger transverse velocities as well. In the quasar J1628, a shift of the absorption to smaller average redshifted velocities has been seen. If the absorption is due to gas undergoing decelerating infall due to outward radiative acceleration, future observations should show a continued shift to smaller average redshifted velocities and increasing deceleration.
Variability in the rotation-dominated wind scenario has been discussed in § 5.3.3. The pattern expected for the simplest variability scenario (changes in absorption strength propagating from blueshifted to redshifted velocities) has been seen in only one of the four cases where two epochs of high S/N spectroscopy are available. A lack of variability in V-shaped outflows on rest-frame timescales of two years or more would rule out this scenario for such objects.
In the binary quasar scenario, variability at blueshifted and redshifted velocities will be uncorrelated. The level of variability in this scenario depends on the transverse velocity of the silhouetted outflow relative to the background quasar. The variability could be comparable to that in standard BAL quasars, but might be lower if BAL outflows decrease substantially in velocity at large outflow distances due to the sweeping up of ambient gas (Faucher-Giguere, Quataert & Murray 2011).
In the case of absorption redshifts arising from a relativistic Doppler shift, the variability of such absorption is likely to be more substantial than the variability of a standard BAL trough, as the large transverse velocity of the gas causes it to traverse the continuum source quickly.
6.2 Ly-alpha emission
A final unusual aspect of these quasars with redshifted broad absorption is that most of them have strong and relatively narrow Ly emission (nine of fifteen objects with Ly coverage have such emission). Although it may be possible to produce apparent narrow Ly emission via Ly and N v absorption of underlying broad emission (e.g., Hall et al. 2004c), absorption in those lines is not always strong in these objects. A full comparison of the Ly properties of these objects and of DR9Q quasars is beyond the scope of this paper, but the prevalence of strong, narrow Ly emission argues against a rotating accretion-disc scenario for redshifted C iv absorption, as there is no obvious explanation for such Ly emission in such scenarios.
Our objects’ Ly FWHMs are near the upper end of the 500–2000 km s-1 range of the FWHMs of Ly emission from the regions of neutral gas near high-redshift galaxies known as Ly blobs (Nilsson et al. 2006; Smith & Jarvis 2007, and references therein). The fluxes of our objects’ narrow Ly lines are about an order of magnitude larger than in the most luminous Ly blobs known (Steidel et al. 2000), so the lines must arise predominantly from illumination by the quasar. The strong, relatively narrow Ly emission in our quasars might arise due to larger than usual amounts of neutral gas in the quasar host galaxy and surrounding environs. An excess of such gas would be consistent with the infall explanation for these objects. Narrow-band imaging or longslit spectroscopy of these objects to ascertain the spatial extent of their Ly emission might constrain the origin of the gas responsible.
6.3 Future work
A variety of further observations of these objects would be useful to determine their nature. Near-infrared spectroscopy could provide accurate redshifts and possible evidence for binarity via narrow emission lines in the rest-frame optical. Continued monitoring of these objects’ spectra at observed optical wavelengths will establish the variability properties of the full sample. High-resolution UV/optical spectroscopy of some objects may better constrain the column densities of the absorbing gas and thereby its physical properties and location as well.
X-ray observations could help discriminate between the different models we have put forward. Quasars observed to have the same strong X-ray absorption seen in standard BAL quasars with the same trough strength and ionization range distributions as our sample are candidates for having rotating disc winds. In the infall scenario, however, the redshifted gas observed in front of these quasars’ UV emitting regions may not cover the smaller X-ray emitting region, or may have the same covering factor for both regions (if the absorbing gas consists of many small clouds, for example). Thus, in this scenario quasars with only redshifted absorption may have X-ray properties similar to those of normal, non-BAL quasars (i.e., no significant X-ray absorption, normal X-ray spectral shape, and nominal optical to X-ray flux ratio).
Larger samples of quasars with redshifted troughs would better establish how common they are and how their trough properties compare to those of standard, blueshifted-trough BAL quasars. The goal of the BOSS is to obtain at least 150,000 spectra of quasars, and the DR9Q catalog contains only 62,000 such objects; therefore, an increase in the sample size a factor 2.5 can be expected in the BOSS alone. Follow-up spectroscopy of candidate cases and a dedicated search for redshifted Mg ii absorption extending to lower redshifts (especially where [O ii] emission at the systemic redshift can be seen) could increase this number still further. Furthermore, the existence of redshifted BAL troughs raises the possibility that the processes producing them could also create narrower redshifted troughs. That possibility may complicate the interpretation of the velocity distribution of narrow absorbers around quasar redshifts solely in terms of infall and clustering (e.g., Wild et al. 2008).
Regardless of the origin of redshifted BAL troughs, they provide a rare but useful probe of quasars and their environs. Any which are due to infall of gas offer a test of models of gas dynamics and AGN fueling and feedback in galaxies during epochs of AGN activity. Any which are due to rotating accretion disc winds offer a test of models of such winds. Any which are due to binary quasars offer a new view of BAL outflows; namely, along lines of sight which do not intersect the quasar which launched them. Such cases offer probes of BAL outflow properties at known projected distances from their launch site, enabling new tests of models of BAL dynamics.
Acknowledgments
We thank D. Proga, M. Bautista, D. Edmonds and N. Murray for discussions, and the referee for a careful review. PBH thanks NSERC for its research support, the Institute of Astronomy at the University of Cambridge for hosting his sabbatical, and the Aspen Center for Physics (NSF Grant #1066293) for its hospitality. WNB and NFA are supported by NSF grant AST-1108604. This research has made extensive use of NASA’s Astrophysics Data System Bibliographic Services. and of the Atomic Line List at http://www.pa.uky.edu/peter/atomic/.
Funding for SDSS-III has been provided by the Alfred P. Sloan Foundation, the Participating Institutions, the National Science Foundation, and the U.S. Department of Energy Office of Science. The SDSS-III web site is http://www.sdss3.org/. SDSS-III is managed by the Astrophysical Research Consortium for the Participating Institutions of the SDSS-III Collaboration including the University of Arizona, the Brazilian Participation Group, Brookhaven National Laboratory, University of Cambridge, Carnegie Mellon University, University of Florida, the French Participation Group, the German Participation Group, Harvard University, the Instituto de Astrofisica de Canarias, the Michigan State/Notre Dame/JINA Participation Group, Johns Hopkins University, Lawrence Berkeley National Laboratory, Max Planck Institute for Astrophysics, Max Planck Institute for Extraterrestrial Physics, New Mexico State University, New York University, Ohio State University, Pennsylvania State University, University of Portsmouth, Princeton University, the Spanish Participation Group, University of Tokyo, University of Utah, Vanderbilt University, University of Virginia, University of Washington, and Yale University.
References
- Abazajian, Adelman-McCarthy, Agüeros, Allam, Allende Prieto, An, Anderson, Anderson, Annis, Bahcall, & et al. (2009) Abazajian K. N., Adelman-McCarthy J. K., Agüeros M. A., Allam S. S., Allende Prieto C., An D., Anderson K. S. J., Anderson S. F., et al., 2009, ApJS, 182, 543
- Abell & Margon (1979) Abell G. O., Margon B., 1979, Nature, 279, 701
- Ahn, Alexandroff, Allende Prieto, Anderson, Anderton, Andrews, Aubourg, Bailey, Balbinot, Barnes, & et al. (2012) Ahn C. P., Alexandroff R., Allende Prieto C., Anderson S. F., Anderton T., Andrews B. H., Aubourg É., Bailey S., et al., 2012, Astrophys. J. Suppl. Ser., 203, 21
- (4) Aihara H., Allende Prieto C., An D., Anderson S. F., Aubourg É., Balbinot E., Beers T. C., Berlind A. A., et al., 2011a, ApJS, 193, 29
- (5) —, 2011b, ApJS, 195, 26
- Allen, Hewett, Maddox, Richards, & Belokurov (2011) Allen J. T., Hewett P. C., Maddox N., Richards G. T., Belokurov V., 2011, MNRAS, 410, 860
- Annis, Soares-Santos, Strauss, Becker, Dodelson, Fan, Gunn, Hao, Ivezic, Jester, Jiang, Johnston, Kubo, Lampeitl, Lin, Lupton, Miknaitis, Seo, Simet, & Yanny (2011) Annis J., Soares-Santos M., Strauss M. A., Becker A. C., Dodelson S., Fan X., Gunn J. E., Hao J., et al., 2011, ArXiv e-prints
- Aoki (2010) Aoki K., 2010, Publ. Astron. Soc. Jpn., 62, 1333
- Arav, Becker, Laurent-Muehleisen, Gregg, White, Brotherton, & de Kool (1999) Arav N., Becker R. H., Laurent-Muehleisen S. A., Gregg M. D., White R. L., Brotherton M. S., de Kool M., 1999, ApJ, 524, 566
- Arav, Moe, Costantini, Korista, Benn, & Ellison (2008) Arav N., Moe M., Costantini E., Korista K. T., Benn C., Ellison S., 2008, Astrophys. J., 681, 954
- Barai, Proga, & Nagamine (2012) Barai P., Proga D., Nagamine K., 2012, Mon. Not. R. Astron. Soc., 424, 728
- Bautista & Pradhan (1998) Bautista M. A., Pradhan A. K., 1998, ApJ, 492, 650
- Becker, White, & Helfand (1995) Becker R. H., White R. L., Helfand D. J., 1995, ApJ, 450, 559
- Blackburne, Pooley, Rappaport, & Schechter (2011) Blackburne J. A., Pooley D., Rappaport S., Schechter P. L., 2011, Astrophys. J., 729, 34
- Bolton, Schlegel, Aubourg, Bailey, Bhardwaj, Brownstein, Burles, Chen, Gunn, Dawson, Eisenstein, Knapp, Loomis, Lupton, Maraston, Muna, Myers, Olmstead, Padmanabhan, Paris, Percival, Petitjean, Rockosi, Ross, Schneider, Shu, Strauss, Thomas, Tremonti, Wake, Weaver, & Wood-Vasey (2012) Bolton A. S., Schlegel D. J., Aubourg E., Bailey S., Bhardwaj V., Brownstein J. R., Burles S., Chen Y.-M., et al., 2012, AJ, 144
- Borguet, Edmonds, Arav, Benn, & Chamberlain (2012) Borguet B., Edmonds D., Arav N., Benn C., Chamberlain C., 2012, ArXiv e-prints
- Capellupo, Hamann, Shields, Rodríguez Hidalgo, & Barlow (2011) Capellupo D. M., Hamann F., Shields J. C., Rodríguez Hidalgo P., Barlow T. A., 2011, MNRAS, 413, 908
- Chartas, Saez, Brandt, Giustini, & Garmire (2009) Chartas G., Saez C., Brandt W. N., Giustini M., Garmire G. P., 2009, ApJ, 706, 644
- Civano, Elvis, Lanzuisi, Aldcroft, Trichas, Bongiorno, Brusa, Blecha, Comastri, Loeb, Salvato, Fruscione, Koekemoer, Komossa, Gilli, Mainieri, Piconcelli, & Vignali (2012) Civano F., Elvis M., Lanzuisi G., Aldcroft T., Trichas M., Bongiorno A., Brusa M., Blecha L., et al., 2012, ApJ, 752, 49
- Civano, Elvis, Lanzuisi, Jahnke, Zamorani, Blecha, Bongiorno, Brusa, Comastri, Hao, Leauthaud, Loeb, Mainieri, Piconcelli, Salvato, Scoville, Trump, Vignali, Aldcroft, Bolzonella, Bressert, Finoguenov, Fruscione, Koekemoer, Cappelluti, Fiore, Giodini, Gilli, Impey, Lilly, Lusso, Puccetti, Silverman, Aussel, Capak, Frayer, Le Floch, McCracken, Sanders, Schiminovich, & Taniguchi (2010) Civano F., Elvis M., Lanzuisi G., Jahnke K., Zamorani G., Blecha L., Bongiorno A., Brusa M., et al., 2010, ApJ, 717, 209
- Collin & Zahn (1999) Collin S., Zahn J.-P., 1999, Astron. Astrophys., 344, 433
- Crenshaw, Kraemer, & George (2003) Crenshaw D. M., Kraemer S. B., George I. M., 2003, Annu. Rev. Astron. Astrophys., 41, 117
- Dai, Shankar, & Sivakoff (2008) Dai X., Shankar F., Sivakoff G. R., 2008, ApJ, 672, 108
- Dai, Shankar, & Sivakoff (2012) —, 2012, Astrophys. J., 757, 180
- Dawson, Schlegel, Ahn, Anderson, Aubourg, Bailey, Barkhouser, Bautista, Beifiori, Berlind, Bhardwaj, Bizyaev, Blake, Blanton, Blomqvist, Bolton, Borde, Bovy, Brandt, Brewington, Brinkmann, Brown, Brownstein, Bundy, Busca, Carithers, Carnero, Carr, Chen, Comparat, Connolly, Cope, Croft, Cuesta, da Costa, Davenport, Delubac, de Putter, Dhital, Ealet, Ebelke, Eisenstein, Escoffier, Fan, Filiz Ak, Finley, Font-Ribera, Génova-Santos, Gunn, Guo, Haggard, Hall, Hamilton, Harris, Harris, Ho, Hogg, Holder, Honscheid, Huehnerhoff, Jordan, Jordan, Kauffmann, Kazin, Kirkby, Klaene, Kneib, Le Goff, Lee, Long, Loomis, Lundgren, Lupton, Maia, Makler, Malanushenko, Malanushenko, Mandelbaum, Manera, Maraston, Margala, Masters, McBride, McDonald, McGreer, McMahon, Mena, Miralda-Escudé, Montero-Dorta, Montesano, Muna, Myers, Naugle, Nichol, Noterdaeme, Nuza, Olmstead, Oravetz, Oravetz, Owen, Padmanabhan, Palanque-Delabrouille, Pan, Parejko, Pâris, Percival, Pérez-Fournon, Pérez-Ràfols, Petitjean, Pfaffenberger, Pforr, Pieri, Prada, Price-Whelan, Raddick, Rebolo, Rich, Richards, Rockosi, Roe, Ross, Ross, Rossi, Rubiño-Martin, Samushia, Sánchez, Sayres, Schmidt, Schneider, Scóccola, Seo, Shelden, Sheldon, Shen, Shu, Slosar, Smee, Snedden, Stauffer, Steele, Strauss, Streblyanska, Suzuki, Swanson, Tal, Tanaka, Thomas, Tinker, Tojeiro, Tremonti, Vargas Magaña, Verde, Viel, Wake, Watson, Weaver, Weinberg, Weiner, West, White, Wood-Vasey, Yeche, Zehavi, Zhao, & Zheng (2013) Dawson K. S., Schlegel D. J., Ahn C. P., Anderson S. F., Aubourg É., Bailey S., Barkhouser R. H., Bautista J. E., et al., 2013, Astron. J., 145, 10
- de Kool, Becker, Arav, Gregg, & White (2002) de Kool M., Becker R. H., Arav N., Gregg M. D., White R. L., 2002, ApJ, 570, 514
- di Francesco, Evans, Caselli, Myers, Shirley, Aikawa, & Tafalla (2007) di Francesco J., Evans II N. J., Caselli P., Myers P. C., Shirley Y., Aikawa Y., Tafalla M., 2007, Protostars and Planets V, 17
- Dorodnitsyn (2009) Dorodnitsyn A. V., 2009, MNRAS, 393, 1433
- Dorodnitsyn (2010) —, 2010, MNRAS, 406, 1060
- Edmonds, Borguet, Arav, Dunn, Penton, Kriss, Korista, Costantini, Steenbrugge, Gonzalez-Serrano, Aoki, Bautista, Behar, Benn, Crenshaw, Everett, Gabel, Kaastra, Moe, & Scott (2011) Edmonds D., Borguet B., Arav N., Dunn J. P., Penton S., Kriss G. A., Korista K., Costantini E., et al., 2011, arxiv:1106.2084
- Einstein (1905) Einstein A., 1905, Annalen der Physik, 322, 891
- Eisenstein, Weinberg, Agol, Aihara, Allende Prieto, Anderson, Arns, Aubourg, Bailey, Balbinot, & et al. (2011) Eisenstein D. J., Weinberg D. H., Agol E., Aihara H., Allende Prieto C., Anderson S. F., Arns J. A., Aubourg E., et al., 2011, AJ, 142, 72
- Elvis (2000) Elvis M., 2000, ApJ, 545, 63
- Farrah, Surace, Veilleux, Sanders, & Vacca (2005) Farrah D., Surace J. A., Veilleux S., Sanders D. B., Vacca W. D., 2005, ApJ, 626, 70
- Farrah, Urrutia, Lacy, Efstathiou, Afonso, Coppin, Hall, Lonsdale, Jarrett, Bridge, Borys, & Petty (2012) Farrah D., Urrutia T., Lacy M., Efstathiou A., Afonso J., Coppin K., Hall P. B., Lonsdale C., et al., 2012, ApJ, 745, 178
- Faucher-Giguere, Quataert, & Murray (2011) Faucher-Giguere C.-A., Quataert E., Murray N., 2011, arXiv:1108.0413
- Fesen, Gerardy, McLin, & Hamilton (1999) Fesen R. A., Gerardy C. L., McLin K. M., Hamilton A. J. S., 1999, Astrophys. J., 514, 195
- Filiz Ak, Brandt, Hall, Schneider, Anderson, Gibson, Lundgren, Myers, Petitjean, Ross, Shen, York, Bizyaev, Brinkmann, Malanushenko, Oravetz, Pan, Simmons, & Weaver (2012) Filiz Ak N., Brandt W. N., Hall P. B., Schneider D. P., Anderson S. F., Gibson R. R., Lundgren B. F., Myers A. D., et al., 2012, Astrophys. J., 757, 114
- Foltz, Weymann, Morris, & Turnshek (1987) Foltz C. B., Weymann R. J., Morris S. L., Turnshek D. A., 1987, ApJ, 317, 450
- Foltz, Weymann, Peterson, Sun, Malkan, & Chaffee (1986) Foltz C. B., Weymann R. J., Peterson B. M., Sun L., Malkan M. A., Chaffee Frederic H. J., 1986, ApJ, 307, 504
- Foltz, Wilkes, Weymann, & Turnshek (1983) Foltz C. B., Wilkes B., Weymann R., Turnshek D., 1983, PASP, 95, 341
- Fukugita, Ichikawa, Gunn, Doi, Shimasaku, & Schneider (1996) Fukugita M., Ichikawa T., Gunn J. E., Doi M., Shimasaku K., Schneider D. P., 1996, AJ, 111, 1748
- Gabel, Kraemer, Crenshaw, George, Brandt, Hamann, Kaiser, Kaspi, Kriss, Mathur, Nandra, Netzer, Peterson, Shields, Turner, & Zheng (2005) Gabel J. R., Kraemer S. B., Crenshaw D. M., George I. M., Brandt W. N., Hamann F. W., Kaiser M. E., Kaspi S., et al., 2005, Astrophys. J., 631, 741
- Gallerani, Maiolino, Juarez, Nagao, Marconi, Bianchi, Schneider, Mannucci, Oliva, Willott, Jiang, & Fan (2010) Gallerani S., Maiolino R., Juarez Y., Nagao T., Marconi A., Bianchi S., Schneider R., Mannucci F., et al., 2010, A&A, 523, A85
- Ganguly, Bond, Charlton, Eracleous, Brandt, & Churchill (2001) Ganguly R., Bond N. A., Charlton J. C., Eracleous M., Brandt W. N., Churchill C. W., 2001, ApJ, 549, 133
- Ganguly & Brotherton (2008) Ganguly R., Brotherton M. S., 2008, ApJ, 672, 102
- Gaspari, Ruszkowski, & Oh (2013) Gaspari M., Ruszkowski M., Oh S. P., 2013, ArXiv e-prints
- Gehrels (1986) Gehrels N., 1986, ApJ, 303, 336
- Gibson, Brandt, Gallagher, Hewett, & Schneider (2010) Gibson R. R., Brandt W. N., Gallagher S. C., Hewett P. C., Schneider D. P., 2010, ApJ, 713, 220
- Gibson, Jiang, Brandt, Hall, Shen, Wu, Anderson, Schneider, Vanden Berk, Gallagher, Fan, & York (2009) Gibson R. R., Jiang L., Brandt W. N., Hall P. B., Shen Y., Wu J., Anderson S. F., Schneider D. P., et al., 2009, ApJ, 692, 758
- Glikman, Urrutia, Lacy, Djorgovski, Mahabal, Myers, Ross, Petitjean, Ge, Schneider, & York (2012) Glikman E., Urrutia T., Lacy M., Djorgovski S. G., Mahabal A., Myers A. D., Ross N. P., Petitjean P., et al., 2012, Astrophys. J., 757, 51
- Gunn, Carr, Rockosi, Sekiguchi, Berry, Elms, de Haas, Ivezić, Knapp, Lupton, Pauls, Simcoe, Hirsch, Sanford, Wang, York, Harris, Annis, Bartozek, Boroski, Bakken, Haldeman, Kent, Holm, Holmgren, Petravick, Prosapio, Rechenmacher, Doi, Fukugita, Shimasaku, Okada, Hull, Siegmund, Mannery, Blouke, Heidtman, Schneider, Lucinio, & Brinkman (1998) Gunn J. E., Carr M., Rockosi C., Sekiguchi M., Berry K., Elms B., de Haas E., Ivezić Ž., et al., 1998, AJ, 116, 3040
- Gunn, Siegmund, Mannery, Owen, Hull, Leger, Carey, Knapp, York, Boroski, Kent, Lupton, Rockosi, Evans, Waddell, Anderson, Annis, Barentine, Bartoszek, Bastian, Bracker, Brewington, Briegel, Brinkmann, Brown, Carr, Czarapata, Drennan, Dombeck, Federwitz, Gillespie, Gonzales, Hansen, Harvanek, Hayes, Jordan, Kinney, Klaene, Kleinman, Kron, Kresinski, Lee, Limmongkol, Lindenmeyer, Long, Loomis, McGehee, Mantsch, Neilsen, Neswold, Newman, Nitta, Peoples, Pier, Prieto, Prosapio, Rivetta, Schneider, Snedden, & Wang (2006) Gunn J. E., Siegmund W. A., Mannery E. J., Owen R. E., Hull C. L., Leger R. F., Carey L. N., Knapp G. R., et al., 2006, AJ, 131, 2332
- Hall (2007) Hall P. B., 2007, AJ, 133, 1271
- Hall, Anderson, Strauss, York, Richards, Fan, Knapp, Schneider, Vanden Berk, & Geballe (2002) Hall P. B., Anderson S. F., Strauss M. A., York D. G., Richards G. T., Fan X., Knapp G. R., Schneider D. P., et al., 2002, ApJS, 141, 267
- Hall, Anosov, White, Brandt, Gregg, Gibson, Becker, & Schneider (2011) Hall P. B., Anosov K., White R. L., Brandt W. N., Gregg M. D., Gibson R. R., Becker R. H., Schneider D. P., 2011, MNRAS, 411, 2653
- (57) Hall P. B., Hoversten E. A., Tremonti C. A., Vanden Berk D. E., Schneider D. P., Strauss M. A., Knapp G. R., York D. G., et al., 2004a, AJ, 127, 3146
- Hall & Hutsemékers (2003) Hall P. B., Hutsemékers D., 2003, in Active Galactic Nuclei: From Central Engine to Host Galaxy, Collin S., Combes F., Shlosman I., eds., p. 209
- (59) Hall P. B., Knapp G. R., Richards G. T., Strauss M. A., Anderson S. F., Schneider D. P., vanden Berk D. A., York D. G., et al., 2004b, in Multiwavelength AGN Surveys, R. Mújica & R. Maiolino, ed., pp. 247–252
- Hall, Kowalski, Harris, Awal, Leggett, Kilic, Anderson, & Gates (2008) Hall P. B., Kowalski P. M., Harris H. C., Awal A., Leggett S. K., Kilic M., Anderson S. F., Gates E., 2008, AJ, 136, 76
- (61) Hall P. B., Snedden S. A., Niederste-Ostholt M., Eisenstein D. J., Strauss M. A., York D. G., Schneider D. P., 2004c, AJ, 128, 534
- Hamann, Kanekar, Prochaska, Murphy, Ellison, Malec, Milutinovic, & Ubachs (2011) Hamann F., Kanekar N., Prochaska J. X., Murphy M. T., Ellison S., Malec A. L., Milutinovic N., Ubachs W., 2011, MNRAS, 410, 1957
- Hamann & Sabra (2004) Hamann F., Sabra B., 2004, in Astronomical Society of the Pacific Conference Series, Vol. 311, AGN Physics with the Sloan Digital Sky Survey, G. T. Richards & P. B. Hall, ed., pp. 203–212
- Hartley, Drew, Long, Knigge, & Proga (2002) Hartley L. E., Drew J. E., Long K. S., Knigge C., Proga D., 2002, MNRAS, 332, 127
- Hayato, Yamaguchi, Tamagawa, Katsuda, Hwang, Hughes, Ozawa, Bamba, Kinugasa, Terada, Furuzawa, Kunieda, & Makishima (2010) Hayato A., Yamaguchi H., Tamagawa T., Katsuda S., Hwang U., Hughes J. P., Ozawa M., Bamba A., et al., 2010, Astrophys. J., 725, 894
- Hennawi, Myers, Shen, Strauss, Djorgovski, Fan, Glikman, Mahabal, Martin, Richards, Schneider, & Shankar (2010) Hennawi J. F., Myers A. D., Shen Y., Strauss M. A., Djorgovski S. G., Fan X., Glikman E., Mahabal A., et al., 2010, Astrophys. J., 719, 1672
- Hennawi, Strauss, Oguri, Inada, Richards, Pindor, Schneider, Becker, Gregg, Hall, Johnston, Fan, Burles, Schlegel, Gunn, Lupton, Bahcall, Brunner, & Brinkmann (2006) Hennawi J. F., Strauss M. A., Oguri M., Inada N., Richards G. T., Pindor B., Schneider D. P., Becker R. H., et al., 2006, AJ, 131, 1
- Hewett, Foltz, & Chaffee (2001) Hewett P. C., Foltz C. B., Chaffee F. H., 2001, AJ, 122, 518
- Hewett & Wild (2010) Hewett P. C., Wild V., 2010, MNRAS, 405, 2302
- Hobbs, Nayakshin, Power, & King (2011) Hobbs A., Nayakshin S., Power C., King A., 2011, Mon. Not. R. Astron. Soc., 413, 2633
- Hodge, Becker, White, Richards, & Zeimann (2011) Hodge J. A., Becker R. H., White R. L., Richards G. T., Zeimann G. R., 2011, arxiv:1103.5749
- Hopkins & Quataert (2010) Hopkins P. F., Quataert E., 2010, MNRAS, 407, 1529
- Hovsepyan (1998) Hovsepyan Y. I., 1998, Physics Uspekhi, 41, 941
- Iono, Wilson, Takakuwa, Yun, Petitpas, Peck, Ho, Matsushita, Pihlstrom, & Wang (2007) Iono D., Wilson C. D., Takakuwa S., Yun M. S., Petitpas G. R., Peck A. B., Ho P. T. P., Matsushita S., et al., 2007, ApJ, 659, 283
- Jannuzi, Hartig, Kirhakos, Sargent, Turnshek, Weymann, Bahcall, Bergeron, Boksenberg, Savage, Schneider, & Wolfe (1996) Jannuzi B. T., Hartig G. F., Kirhakos S., Sargent W. L. W., Turnshek D. A., Weymann R. J., Bahcall J. N., Bergeron J., et al., 1996, ApJL, 470, L11
- Jenkins, Wallerstein, & Silk (1976) Jenkins E. B., Wallerstein G., Silk J., 1976, Astrophys. J. Suppl. Ser., 32, 681
- Jiménez-Vicente, Mediavilla, Muñoz, & Kochanek (2012) Jiménez-Vicente J., Mediavilla E., Muñoz J. A., Kochanek C. S., 2012, Astrophys. J., 751, 106
- Kaspi & Behar (2010) Kaspi S., Behar E., 2010, Space Sci. Rev., 157, 249
- King, Miller, & Raymond (2012) King A. L., Miller J. M., Raymond J., 2012, ApJ, 746, 2
- Knigge, Scaringi, Goad, & Cottis (2008) Knigge C., Scaringi S., Goad M. R., Cottis C. E., 2008, MNRAS, 386, 1426
- Knigge, Woods, & Drew (1995) Knigge C., Woods J. A., Drew J. E., 1995, MNRAS, 273, 225
- Kurosawa & Proga (2009) Kurosawa R., Proga D., 2009, ApJ, 693, 1929
- Lawrence & Elvis (2010) Lawrence A., Elvis M., 2010, ApJ, 714, 561
- Leighly & Moore (2004) Leighly K. M., Moore J. R., 2004, ApJ, 611, 107
- Levine, Gnedin, Hamilton, & Kravtsov (2008) Levine R., Gnedin N. Y., Hamilton A. J. S., Kravtsov A. V., 2008, ApJ, 678, 154
- Li, Ostriker, & Sunyaev (2012) Li J., Ostriker J., Sunyaev R., 2012, ApJ, submitted
- Liu, Shen, Strauss, & Hao (2011) Liu X., Shen Y., Strauss M. A., Hao L., 2011, ApJ, 737, 101
- Lynds (1967) Lynds C. R., 1967, ApJ, 147, 396
- Maiolino, Oliva, Ghinassi, Pedani, Mannucci, Mujica, & Juarez (2004) Maiolino R., Oliva E., Ghinassi F., Pedani M., Mannucci F., Mujica R., Juarez Y., 2004, A&A, 420, 889
- Martin & Bouché (2009) Martin C. L., Bouché N., 2009, Astrophys. J., 703, 1394
- Mathews (1982) Mathews W. G., 1982, Astrophys. J., 258, 425
- Misawa, Eracleous, Charlton, & Kashikawa (2007) Misawa T., Eracleous M., Charlton J. C., Kashikawa N., 2007, ApJ, 660, 152
- Moe, Arav, Bautista, & Korista (2009) Moe M., Arav N., Bautista M. A., Korista K. T., 2009, ApJ, 706, 525
- Moore (1950) Moore C. E., 1950, An ultraviolet multiplet table, Sections 1-2. NBS Circular 488, Washington: US Government Printing Office
- Murray & Chiang (1998) Murray N., Chiang J., 1998, ApJ, 494, 125
- Murray, Chiang, Grossman, & Voit (1995) Murray N., Chiang J., Grossman S. A., Voit G. M., 1995, ApJ, 451, 498
- Myers, Brunner, Richards, Nichol, Schneider, & Bahcall (2007) Myers A. D., Brunner R. J., Richards G. T., Nichol R. C., Schneider D. P., Bahcall N. A., 2007, Astrophys. J., 658, 99
- Myers, Richards, Brunner, Schneider, Strand, Hall, Blomquist, & York (2008) Myers A. D., Richards G. T., Brunner R. J., Schneider D. P., Strand N. E., Hall P. B., Blomquist J. A., York D. G., 2008, ApJ, 678, 635
- Nayakshin & Zubovas (2012) Nayakshin S., Zubovas K., 2012, ArXiv e-prints
- Nilsson, Fynbo, Møller, Sommer-Larsen, & Ledoux (2006) Nilsson K. K., Fynbo J. P. U., Møller P., Sommer-Larsen J., Ledoux C., 2006, Astron. Astrophys., 452, L23
- Osterbrock & Ferland (2006) Osterbrock D. E., Ferland G. J., 2006, Astrophysics of Gaseous Nebulae and Active Galactic Nuclei, Second Edition. Sausalito: University Science Books, pp. 125–126
- Oyaizu, Lima, Cunha, Lin, Frieman, & Sheldon (2008) Oyaizu H., Lima M., Cunha C. E., Lin H., Frieman J., Sheldon E. S., 2008, ApJ, 674, 768
- Pâris, Petitjean, Aubourg, Bailey, Ross, Myers, Strauss, Anderson, Arnau, Bautista, Bizyaev, Bolton, Bovy, Brandt, Brewington, Browstein, Busca, Capellupo, Carithers, Croft, Dawson, Delubac, Ebelke, Eisenstein, Engelke, Fan, Filiz Ak, Finley, Font-Ribera, Ge, Gibson, Hall, Hamann, Hennawi, Ho, Hogg, Ivezić, Jiang, Kimball, Kirkby, Kirkpatrick, Lee, Le Goff, Lundgren, MacLeod, Malanushenko, Malanushenko, Maraston, McGreer, McMahon, Miralda-Escudé, Muna, Noterdaeme, Oravetz, Palanque-Delabrouille, Pan, Perez-Fournon, Pieri, Richards, Rollinde, Sheldon, Schlegel, Schneider, Slosar, Shelden, Shen, Simmons, Snedden, Suzuki, Tinker, Viel, Weaver, Weinberg, White, Wood-Vasey, & Yèche (2012) Pâris I., Petitjean P., Aubourg É., Bailey S., Ross N. P., Myers A. D., Strauss M. A., Anderson S. F., et al., 2012, Astron. Astrophys., 548, A66
- Press, Teukolsky, Vetterling, & Flannery (2007) Press W. H., Teukolsky S. A., Vetterling W. T., Flannery B. P., 2007, Numerical Recipes, 3rd Edition . Cambridge: Cambridge University Press, p. 731
- Proga (2003) Proga D., 2003, ApJL, 592, L9
- Proga & Kallman (2004) Proga D., Kallman T. R., 2004, ApJ, 616, 688
- Proga, Kallman, Drew, & Hartley (2002) Proga D., Kallman T. R., Drew J. E., Hartley L. E., 2002, ApJ, 572, 382
- Proga, Ostriker, & Kurosawa (2008) Proga D., Ostriker J. P., Kurosawa R., 2008, ApJ, 676, 101
- Proga, Rodriguez-Hidalgo, & Hamann (2012) Proga D., Rodriguez-Hidalgo P., Hamann F., 2012, in Astronomical Society of the Pacific Conference Series, Vol. 460, AGN Winds in Charleston, Chartas G., Hamann F., Leighly K. M., eds., p. 171
- Richards, Vanden Berk, Reichard, Hall, Schneider, SubbaRao, Thakar, & York (2002) Richards G. T., Vanden Berk D. E., Reichard T. A., Hall P. B., Schneider D. P., SubbaRao M., Thakar A. R., York D. G., 2002, AJ, 124, 1
- Risaliti, Nardini, Salvati, Elvis, Fabbiano, Maiolino, Pietrini, & Torricelli-Ciamponi (2011) Risaliti G., Nardini E., Salvati M., Elvis M., Fabbiano G., Maiolino R., Pietrini P., Torricelli-Ciamponi G., 2011, MNRAS, 410, 1027
- Rodríguez Hidalgo, Hamann, & Hall (2011) Rodríguez Hidalgo P., Hamann F., Hall P., 2011, MNRAS, 411, 247
- Rogerson, Hall, Snedden, Brotherton, & Anderson (2011) Rogerson J. A., Hall P. B., Snedden S. A., Brotherton M. S., Anderson S. F., 2011, New Astronomy, 16, 128
- Ross, Myers, Sheldon, Yèche, Strauss, Bovy, Kirkpatrick, Richards, Aubourg, Blanton, Brandt, Carithers, Croft, da Silva, Dawson, Eisenstein, Hennawi, Ho, Hogg, Lee, Lundgren, McMahon, Miralda-Escude, Palanque-Delabrouille, Paris, Petitjean, Pieri, Rich, Roe, Schiminovich, Schlegel, Schneider, Slosar, Suzuki, Tinker, Weinberg, Weyant, White, & Wood-Vasey (2012) Ross N. P., Myers A. D., Sheldon E. S., Yèche C., Strauss M. A., Bovy J., Kirkpatrick J. A., Richards G. T., et al., 2012, ApJS, 199, 3
- Schneider, Richards, Hall, Strauss, Anderson, Boroson, Ross, Shen, Brandt, Fan, Inada, Jester, Knapp, Krawczyk, Thakar, Vanden Berk, Voges, Yanny, York, Bahcall, Bizyaev, Blanton, Brewington, Brinkmann, Eisenstein, Frieman, Fukugita, Gray, Gunn, Hibon, Ivezić, Kent, Kron, Lee, Lupton, Malanushenko, Malanushenko, Oravetz, Pan, Pier, Price, Saxe, Schlegel, Simmons, Snedden, SubbaRao, Szalay, & Weinberg (2010) Schneider D. P., Richards G. T., Hall P. B., Strauss M. A., Anderson S. F., Boroson T. A., Ross N. P., Shen Y., et al., 2010, AJ, 139, 2360
- Shakura & Sunyaev (1973) Shakura N. I., Sunyaev R. A., 1973, A&A, 24, 337
- Shaohua, Huiyuan, Hongyan, Tinggui, & Peng (2011) Shaohua Z., Huiyuan W., Hongyan Z., Tinggui W., Peng J., 2011, arXiv:1106.1587
- Shen, Strauss, Oguri, Hennawi, Fan, Richards, Hall, Gunn, Schneider, Szalay, Thakar, Vanden Berk, Anderson, Bahcall, Connolly, & Knapp (2007) Shen Y., Strauss M. A., Oguri M., Hennawi J. F., Fan X., Richards G. T., Hall P. B., Gunn J. E., et al., 2007, AJ, 133, 2222
- Sher (1968) Sher D., 1968, JRASC, 62, 105
- Sim, Proga, Kurosawa, Long, Miller, & Turner (2012) Sim S. A., Proga D., Kurosawa R., Long K. S., Miller L., Turner T. J., 2012, ArXiv e-prints
- Smee, Gunn, Uomoto, Roe, Schlegel, Rockosi, Carr, Leger, Dawson, Olmstead, Brinkmann, Owen, Barkhouser, Honscheid, Harding, Long, Lupton, Loomis, Anderson, Annis, Bernardi, Bhardwaj, Bizyaev, Bolton, Brewington, Briggs, Burles, Burns, Castander, Connolly, Davenport, Ebelke, Epps, Feldman, Friedman, Frieman, Heckman, Hull, Knapp, Lawrence, Loveday, Mannery, Malanushenko, Malanushenko, Merrelli, Muna, Newman, Nichol, Oravetz, Pan, Pope, Ricketts, Shelden, Sandford, Siegmund, Simmons, Smith, Snedden, Schneider, Strauss, SubbaRao, Tremonti, Waddell, & York (2012) Smee S., Gunn J. E., Uomoto A., Roe N., Schlegel D., Rockosi C. M., Carr M. A., Leger F., et al., 2012, ArXiv e-prints
- Smith & Jarvis (2007) Smith D. J. B., Jarvis M. J., 2007, MNRAS, 378, L49
- Steidel, Adelberger, Shapley, Pettini, Dickinson, & Giavalisco (2000) Steidel C. C., Adelberger K. L., Shapley A. E., Pettini M., Dickinson M., Giavalisco M., 2000, Astrophys. J., 532, 170
- Steidel, Erb, Shapley, Pettini, Reddy, Bogosavljević, Rudie, & Rakic (2010) Steidel C. C., Erb D. K., Shapley A. E., Pettini M., Reddy N., Bogosavljević M., Rudie G. C., Rakic O., 2010, ApJ, 717, 289
- Stoughton, Lupton, Bernardi, Blanton, Burles, Castander, Connolly, Eisenstein, & Frieman (2002) Stoughton C., Lupton R. H., Bernardi M. B., Blanton M. R., Burles S., Castander F. J., Connolly A. J., Eisenstein D. J., et al., 2002, AJ, 123, 485
- Tegmark & Peebles (1998) Tegmark M., Peebles P. J. E., 1998, ApJL, 500, L79
- Thompson, Quataert, & Murray (2005) Thompson T. A., Quataert E., Murray N., 2005, Astrophys. J., 630, 167
- Tombesi, Cappi, Reeves, Palumbo, Braito, & Dadina (2011) Tombesi F., Cappi M., Reeves J. N., Palumbo G. G. C., Braito V., Dadina M., 2011, ApJ, 742, 44
- Trump, Hall, Reichard, Richards, Schneider, Vanden Berk, Knapp, Anderson, Fan, Brinkman, Kleinman, & Nitta (2006) Trump J. R., Hall P. B., Reichard T. A., Richards G. T., Schneider D. P., Vanden Berk D. E., Knapp G. R., Anderson S. F., et al., 2006, ApJS, 165, 1
- Vaughan & Uttley (2008) Vaughan S., Uttley P., 2008, MNRAS, 390, 421
- Véron-Cetty, Joly, & Véron (2004) Véron-Cetty M.-P., Joly M., Véron P., 2004, A&A, 417, 515
- Wampler, Chugai, & Petitjean (1995) Wampler E. J., Chugai N. N., Petitjean P., 1995, ApJ, 443, 586
- Wang (2011) Wang C., 2011, Annalen der Physik, 523, 239
- Warren, Hambly, Dye, Almaini, Cross, Edge, Foucaud, Hewett, Hodgkin, Irwin, Jameson, Lawrence, Lucas, Adamson, Bandyopadhyay, Bryant, Collins, Davis, Dunlop, Emerson, Evans, Gonzales-Solares, Hirst, Jarvis, Kendall, Kerr, Leggett, Lewis, Mann, McLure, McMahon, Mortlock, Rawlings, Read, Riello, Simpson, Smith, Sutorius, Targett, & Varricatt (2007) Warren S. J., Hambly N. C., Dye S., Almaini O., Cross N. J. G., Edge A. C., Foucaud S., Hewett P. C., et al., 2007, MNRAS, 375, 213
- Weymann, Morris, Foltz, & Hewett (1991) Weymann R. J., Morris S. L., Foltz C. B., Hewett P. C., 1991, ApJ, 373, 23
- Wild & Hewett (2010) Wild V., Hewett P. C., 2010, arxiv:1010.2500
- Wild, Kauffmann, White, York, Lehnert, Heckman, Hall, Khare, Lundgren, Schneider, & vanden Berk (2008) Wild V., Kauffmann G., White S., York D., Lehnert M., Heckman T., Hall P. B., Khare P., et al., 2008, MNRAS, 388, 227
- Winkler, Long, Hamilton, & Fesen (2005) Winkler P. F., Long K. S., Hamilton A. J. S., Fesen R. A., 2005, Astrophys. J., 624, 189
- Wright, Eisenhardt, Mainzer, Ressler, Cutri, Jarrett, Kirkpatrick, Padgett, McMillan, Skrutskie, Stanford, Cohen, Walker, Mather, Leisawitz, Gautier, McLean, Benford, Lonsdale, Blain, Mendez, Irace, Duval, Liu, Royer, Heinrichsen, Howard, Shannon, Kendall, Walsh, Larsen, Cardon, Schick, Schwalm, Abid, Fabinsky, Naes, & Tsai (2010) Wright E. L., Eisenhardt P. R. M., Mainzer A. K., Ressler M. E., Cutri R. M., Jarrett T., Kirkpatrick J. D., Padgett D., et al., 2010, AJ, 140, 1868
- Wu, Crenshaw, Hamilton, Fesen, Leventhal, & Sarazin (1997) Wu C.-C., Crenshaw D. M., Hamilton A. J. S., Fesen R. A., Leventhal M., Sarazin C. L., 1997, Astrophys. J. Lett., 477, L53
- Wu, Brandt, Hall, Gibson, Richards, Schneider, Shemmer, Just, & Schmidt (2011) Wu J., Brandt W. N., Hall P. B., Gibson R. R., Richards G. T., Schneider D. P., Shemmer O., Just D. W., et al., 2011, ApJ, 736, 28
- York, Adelman, Anderson, Anderson, Annis, Bahcall, Bakken, Barkhouser, Bastian, & Berman (2000) York D. G., Adelman J., Anderson J. E., Anderson S. F., Annis J., Bahcall N. A., Bakken J. A., Barkhouser R., et al., 2000, AJ, 120, 1579
Appendix A Notes on Individual Objects
SDSS J002825.02010604.2 (J0028; Fig. 6) has a redshift of =4.11520.0102 (Hewett & Wild 2010), from emission features of Ly, Si iii], and C iii]. (Only a visual redshift is available in DR9Q.) J0028 has absorption troughs spanning the systemic redshift in C iv, Si iv, N v, and P v. The Si iv trough is continuous, but the C iv trough is interrupted by weak, narrow C iv emission at the systemic redshift. There is also emission and absorption in Si ii, O i, and C ii. The three epochs of spectroscopy on this quasar are shown in Figure 10 and are discussed in § 3.3.1.
SDSS J014829.81013015.0 (J0148; Fig. 2) has a DR9Q C iii] PCA redshift of =3.0610.008. It has strong, narrow Ly emission and accompanying narrow C iv emission which appears to interrupt a BAL trough spanning both blueshifted and redshifted velocities, as seen in Si iv. Similar troughs interrupted by narrow emission are seen in O vi and N v. There may be some Fe ii* absorption longward of C iv, but Fe ii* cannot explain the redshifted absorption seen in O vi, N v and Si iv. At the blue end of the Si iv trough where the absorption is strongest, absorption is also seen in P v, S iv, possibly C iii]*, C ii, and Al iii. There also appears to be strong, blueshifted emission of C iv and Si iv.
SDSS J080544.99264102.9 (J0805; Fig. 2) has a DR9Q C iii] PCA redshift of =2.7030.008. Its spectrum is remarkably similar to that of J0148, except that the C ii absorption is weaker and only weak blueshifted emission is discernible in C iv and none at all in Si iv.
SDSS J082818.81362758.6 (J0828; Fig. 2) has a DR9Q full PCA redshift of =2.3660.005, which is a better match to the spectrum than the DR9Q C iii] PCA =2.370. The true systemic redshift may be even smaller, as J0828 has strong Ly emission with an apparent peak at =2.361, but we adopt a systemic =2.366 to be conservative. It has strong, blueshifted absorption in N v, C ii, Si iv, C iv, Al iii, and Mg ii. It has redshifted absorption in Si iv and C iv, and probably in N v, C ii, and Al iii.
SDSS J083030.26165444.7 (J0830; Fig. 2) has narrow Ly emission at =2.43450.0005; there is also narrow emission at the same redshift in N v, Si iv, and C iv. The DR9Q full PCA redshift is =2.4230.005 (no C iii] PCA redshift is available). We adopt the narrow emission redshift as systemic to be conservative about the extent of the redshifted absorption. There is redshifted absorption in C iii*, N v, C ii, Si iv, C iv, Al iii, and possibly Ly, extending to at least =2.465 in all troughs from at least =2.417 in C iii*, N v, Si iv and C iv (1530 to +2650 km s-1, km s-1) and from =2.43 in Ly, C ii and Al iii (390 to +2650 km s-1, km s-1). Ly absorption is confused with broad and narrow Ly emission, making the absorption identification uncertain; however, the redshifted velocity of the end of the trough for other ions matches that of the putative Ly trough.
SDSS J094108.92022944.7 (J0941; Fig. 2) has =3.4460.002 from its DR9Q C iii] PCA redshift. It has a red continuum and striking, narrow emission lines of O vi, Ly, N v, Si iv (very weak), and C iv. J0941 has blueshifted absorption in O vi, P v, N v, Si iv, and C iv. It has redshifted C iv absorption which is roughly symmetric around the emission redshift with the blueshifted C iv absorption. There appears to be accompanying redshifted Si iv absorption, and possibly redshifted P v and N v absorption, but there is no sign of redshifted O vi absorption.
SDSS J0941 is unique in our sample in that it is morphologically classified as a galaxy; see § 3.2.
SDSS J101946.08051523.7 (J1019; Fig. 2) has a DR9Q C iii] PCA redshift of =2.452. It has broad emission in N v, Al iii, C iii], Fe iii UV34, UV50 and UV48, and possibly Mg ii. Blue wings of Si iv and C iv emission also appear to be present. There is redshifted absorption (from =2.46 to =2.54, or =+800 km s-1 to =+7500 km s-1) in Fe iii, Al iii, Al ii, C iv, Si iv, C ii, Si ii and N v. Shortward of Ly, there is absorption consistent with redshifted C iii*, P v+Fe iii, S iv and probably O vi, but given the resolution of the BOSS spectrum, Ly forest contamination makes those identifications less certain. The C iv and Fe iii absorption extend to =2.55 (=+8300 km s-1), and may extend to =2.57 (=+10100 km s-1). The Fe iii absorption is seen in multiplets UV34, UV48, and UV50. As discussed in § 3, BAL troughs in UV34 and UV48 have been seen before, but this is the first reported case of UV50 absorption. An intervening absorber at =1.6135 is responsible for narrow absorption at 4050, 4200 and 4365 Å.
SDSS J103412.33072003.6 (J1034; Fig. 6) at (Hewett & Wild 2010) has C iv absorption both blueshifted (3100 km s-1 wide up to km s-1) and redshifted (5200 km s-1 wide, up to km s-1) in its SDSS and BOSS spectra, plus blueshifted Al iii and Mg ii. In addition, its BOSS spectrum shows both blueshifted and redshifted Si iv. In both C iv and Si iv, the blueshifted absorption is much stronger than the redshifted absorption. There is no sign of [O ii] 3727,3729 emission in its BOSS spectrum.
SDSS J114655.05330750.1 (J1146; Fig. 2) has a DR9Q C iii] PCA redshift of =2.780. It has weak, redshifted absorption in N v, Si iv, C iv, and probably Al iii and O vi. J1146 has the shallowest absorption and the smallest AITot value in our sample.
SDSS J114756.00025023.4 (J1147; Fig. 6) has =2.55590.0056 (Hewett & Wild 2010) from Si iii]+C iii] emission. (The DR9Q C iii] PCA redshift is =2.5600, but despite the small difference our inspection shows that the HW10 redshift provides the better fit.) However, the continuum slope of the SDSS spectrum of this object is in error. The and colors synthesized from the spectrum are much redder than the corresponding colors from the SDSS imaging and the BOSS spectrum. Therefore, we only plot the BOSS spectrum in Figure 6. J1147 shows absorption in Si iv and C iv which is strongest at =2.540 (1340 km s-1) and extends to redshifted velocities, generally weakening with increasing redshifted velocity. There is no clear redshifted N v trough, but it may be concealed by narrow N v emission; such emission is seen in C iv. Narrow Ly, N v, Si ii, and C ii absorption are seen at =2.540 and at =2.610 (+4530 km s-1).
SDSS J132333.01004633.8 (J1323; Fig. 2) is at =2.4550.038 from our inspection of Si iii]+C iii]; no DR9Q C iii] PCA redshift is available, and the DR9Q full PCA redshift of =2.376 is spuriously low. It has troughs in P v, N v, Si iv, C iv and possibly C ii that span both blueshifted and redshifted velocities. J1323 has blueshifted C iv emission but no sign of blueshifted Si iv emission. J1323 has two epochs of BOSS spectroscopy, but the second-epoch spectrum has a considerably lower signal-to-noise ratio than the first, and so no notable trough variability is distinguishable between the two epochs.
SDSS J143945.28044409.2 (J1439) has a DR9Q C iii] PCA redshift of =2.4920.001, which matches the redshift of the peak of its narrow Ly emission. Any Mg ii emission present is swamped by noise around 9800 Å (observed); there is also poor night sky line subtraction near 5892 Å (observed). The spectrum of J1439 resembles that of J2157. J1439 appears to have redshifted absorption in C iii*, N v, Si iv, and C iv beginning at its systemic redshift and extending to ( km s-1) in all three lines, and possibly to (+11200 km s-1) in C iv. There are also relatively narrow absorption systems at =2.465 in Ly, C iv and possibly Si iv, and at =2.4873 in Ly, C iv, Si ii, C ii, and possibly N v; the latter redshift may mark the short-wavelength end of the broad absorption troughs.
SDSS J144055.59315051.7 (J1440; Fig. 2), at a DR9Q C iii] PCA redshift of =2.9540.015, has blueshifted and redshifted absorption in O vi, N v, Si ii, C ii, Si iv, and C iv. The troughs are split by weak emission just longward of the systemic redshift in each transition.
SDSS J162805.80474415.6 (J1628; Fig. 6) at (Hewett & Wild 2010) has broad C iv absorption blueshifted by up to 9500 km s-1 and a redshifted C iv trough extending to 12400 km s-1 in its SDSS spectrum and to 11100 km s-1 in its BOSS spectrum. We previously suggested the latter trough could instead be either a very high velocity ( km s-1) Al iii trough without accompanying Mg ii, or He ii 1640 absorption associated with the km s-1 C iv outflow (Hall et al. 2004b). These hypotheses are ruled out by the detection of redshifted Si iv absorption, at velocities matching those of the redshifted C iv absorption, in the BOSS spectrum of this object. J1628 also exhibits narrow absorption at =1.4967 (11600 km s-1) in C iv, Al ii, Fe ii, and Mg ii and narrow Fe ii+Mg ii absorption at . No [O ii] emission is detected in the BOSS spectrum of this object.
SDSS J170953.28270516.6 (J1709; Fig. 2) has strong, narrow Ly at , consistent with the DR9Q C iii] PCA redshift of , which we adopt as systemic. A redshifted trough is seen in O vi, C iii*, N v, Si iv and C iv, extending to +4430 km s-1 (slightly narrower in Si iv). Weak, redshifted absorption is seen in Al iii 1854,1862.
SDSS J172404.44313539.6 (J1724; Fig. 2) has narrow Ly emission at =2.5240.001, but we adopt the DR9Q C iii] PCA redshift of =2.5160.001 as systemic. There is absorption which is mostly redshifted in N v, C ii, Si iv, C iv, Al iii, and possibly Mg ii. The Si iv and C iv absorption extends from =2.51 to =2.62 (=9350 km s-1), and the N v absorption is at least that wide. The C ii and Al iii troughs are narrower (4200 km s-1). The Mg ii region is at the far red end of the spectrum, but there is a suggestion of a trough in the same velocity range as C ii and Al iii and a depth of 50% of the continuum. Below Ly, there is strong, broad C iii* 1175 and P v/Fe iii 1116 emission in this object, along with redshifted absorption from O vi, S iv 1062+S iv* 1072, P v 1118,1128 and C iii*. There is a narrow Ly absorber at =2.53. The apparent narrow Ly absorber longward of that is C ii from a narrow intervening system with C iv, Si iv and possibly Mg ii at =2.224. There is also an intervening system with Si iv, C iv, Al iii, and Mg ii at 1.9066.
SDSS J215704.26002217.7 (J2157; Fig. 2) has a DR9Q C iii] PCA redshift of , which we adopt as systemic. (We do not adopt the DR9Q Mg ii PCA redshift of because Mg ii is weak and affected by night sky emission line residuals.) It has absorption troughs in N v, Si iv and C iv composed of absorption beginning at a small blueshift ( km s-1 in C iv) and extending smoothly to a large redshift (=9050 km s-1 in C iv) at generally decreasing depth. The region of the blueshifted trough at either has a different range of ionization stages present or constitutes a separate, narrow absorption system; absorption is seen there in Ly, Si ii and C ii as well as in N v, Si iv, and C iv. There also appears to be redshifted P v and Al iii absorption. The absorption in Al iii is narrower than in the other ions, which is typical for standard BAL quasars which exhibit Al iii troughs. The spectrum exhibits strong, narrow Ly emission accompanied by narrow O i 1302+Si ii1304, He ii 1640, Mg ii and possibly C iv emission.
Appendix B Objects with candidate redshifted high-ionization absorption
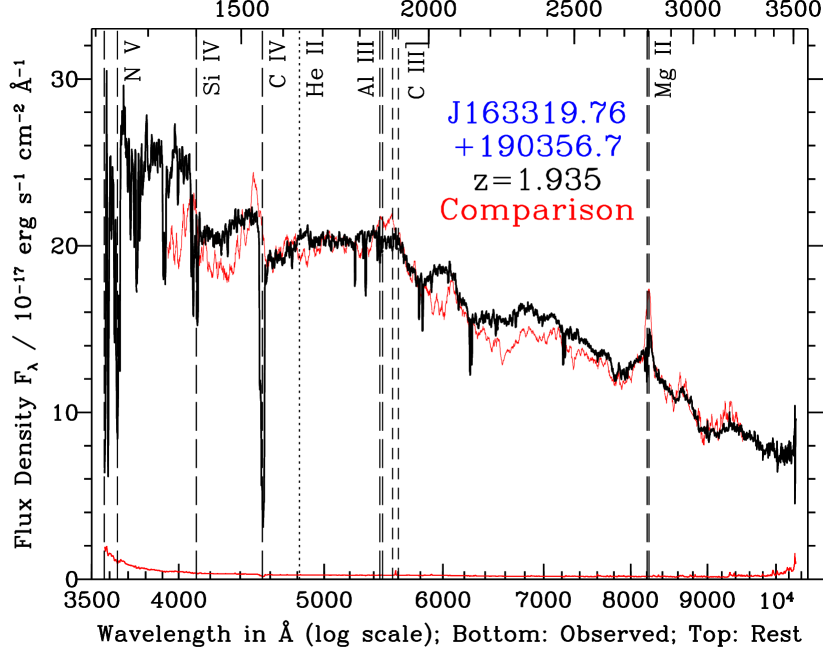
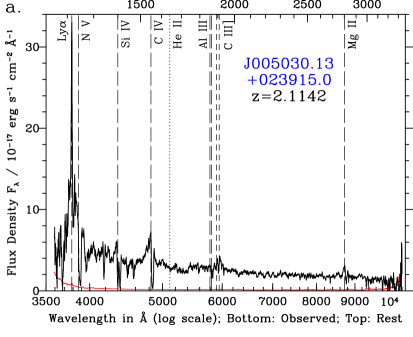
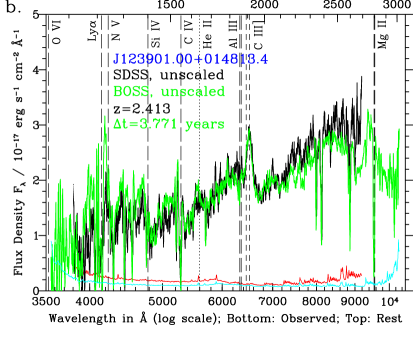
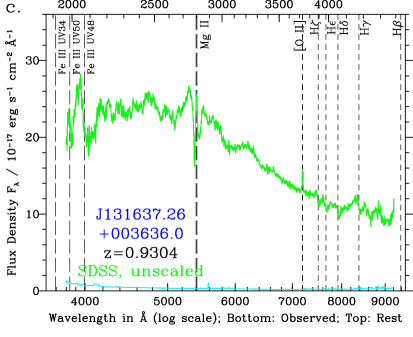
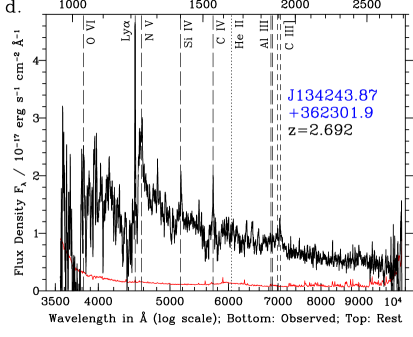
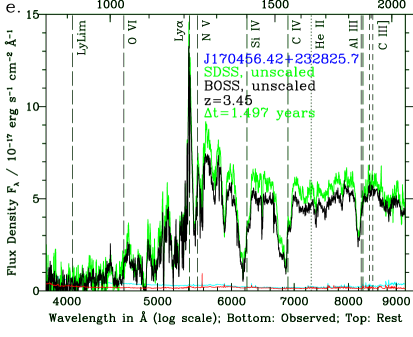
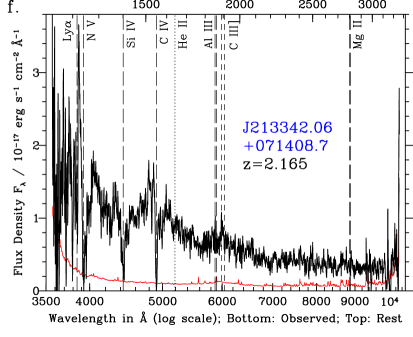
In this section we discuss a number of quasars which have candidate redshifted high-ionization absorption features in their spectra. Their spectra are shown in Figure 15 and Figure 16. We discuss the candidate shown in Figure 15 at some length before discussing the others.
SDSS J163319.76190856.7 (J1633; Fig. 15) has a DR9Q Mg ii PCA redshift of , which we adopt as systemic (no C iii] PCA redshift is available). It has a complex of three narrow absorption systems at blueshifts 2000 km s-1 in C iv, N v, C ii 1334 and Si iv. It also has what appear to be broad troughs extending longward of the rest wavelengths of Si iv (halfway to the position of C iv) and C iv (to the position of He ii). These troughs extend to at least =7300 km s-1 and possibly to =14100 km s-1 in C iv. There may be a redshifted component of C ii 1334 absorption, but there is no clear sign of redshifted absorption in Ly or N v. J1633 also exhibits an intervening Mg ii+Fe ii system at and an intervening C iv system at . J1633 was detected in the radio by the FIRST survey (Becker et al. 1995) and has a deconvolved size of 2.67″0.76″ with major axis oriented 86.1∘ E of N.
The reality of the putative redshifted Si iv and C iv absorption in J1633 is unclear, as follows. The ultraviolet spectrum of a quasar can be thought of as a roughly power-law continuum plus strong, broad emission lines and a pseudocontinuum of weaker and/or blended broad emission lines, Balmer continuum emission, H i two-photon emission (Hall et al. 2004a), etc. The combination of unusual emission-line profiles and strong emission in the pseudocontinuum can cause gaps between emission complexes to mimic absorption features.
J1633 is a potential example of this phenomenon. Its spectrum appears explainable by strong Si iv and C iv emission which is almost entirely blueshifted from the systemic wavelength, plus a complex of narrow N v, Si iv and C iv absorption systems near the systemic redshift, plus an unusual spectral shape between C iv and C iii] 1908.
Cases of entirely blueshifted C iv emission are rare but not unknown (e.g., Fig. 3 of Leighly & Moore 2004). In particular, the spectrum of J1633 strongly resembles the composite spectrum of ‘PHL 1811 analog’ quasars presented in Fig. 8 of Wu et al. (2011). The UV spectra of PHL 1811 analogs exhibit weak high-ionization emission lines but strong Fe iii 2080 Å and UV Fe ii emission like that seen in J1633. As an example, the candidate PHL 1811 analog SDSS J113000.64583248.3 shows a strong emission complex between C iv and C iii].
We show in Fig. 15 the spectrum of J1633 as a thick black line, with a scaled and heavily smoothed spectrum of the unusual quasar SDSS J113000.64583248.3 overplotted as a thin red line. We used a scaling to roughly account for the effects of different power-law continuum slopes and reddening in the two objects. The scaling demonstrates that a quasar without any obvious absorption can match the continuum shape of J1633 at wavelengths between C iv and Mg ii. (This figure also demonstrates that if J1633 lacked narrow absorption troughs, it would likely qualify as a PHL 1811 analog according to the criteria of Wu et al. (2011).) A slightly shallower scaling would better match the continuum near Si iv, indicating that at wavelengths just longward of C iv J1633 has weaker emission than SDSS J113000.64583248.3 does. Possible contributors for the strong emission between C iv and C iii] include Fe ii, He ii, Al ii, N iv] and Al iii. However, the exact origin is immaterial for our purposes: we have demonstrated that J1633 can plausibly be explained without invoking redshifted absorption troughs, and so we exclude it from further discussion here. Nonetheless, it would be worth obtaining further spectroscopy of this object, to shorter rest-frame wavelengths if possible, to characterize its spectral shape more accurately and to search for absorption variability.
Turning to Figure 16, we have the candidate SDSS J005030.13023915.0 (J0050; Fig. 16). It has strong, narrow Ly emission at =2.11420.0010, consistent with the DR9Q Mg ii PCA redshift of =2.112 and the DR9Q full PCA redshift of =2.118; we adopt the latter as systemic. (The DR9Q C iii] PCA redshift of =2.129 is spuriously large.) a redshift consistent with the redshift of the peaks of C iv and Mg ii. It has a redshifted trough seen in Ly, N v, C ii, Si iv and C iv from =0 to +1780 km s-1). The relatively narrow velocity range means that it is either a mini-BAL quasar or has a complex of unresolved narrow absorption systems along our line of sight which appear redshifted due to their peculiar velocities (Wild et al. 2008). In fact, within the broad redshifted trough, there is narrow Al iii, Fe iii, and Mg ii absorption at =2.129 (+1060 km s-1). The broad absorption does not reach zero depth in Ly, but nearly does in N v. The absorber might be too highly ionized to show strong Ly, or might not fully cover the Ly emission region at the velocities in question.
The line widths and strengths of the absorption features in J0050 are probably too strong for the absorber to be an intervening system with a redshifted peculiar velocity of 1060 km s-1 relative to the quasar. However, the redshifted velocity is one of the smallest in our sample, and the Ly, C iii] and Mg ii lines are all affected by absorption, increasing the uncertainty of this object’s systemic redshift so that a redshift high enough to eliminate the redshifted absorption cannot be excluded. Until a more robust systemic redshift is determined (e.g., through near-infrared spectroscopy of rest-frame optical narrow emission lines), we consider this quasar merely a candidate for having redshifted absorption.
SDSS J123901.00014813.4 (J1239; Fig. 16) may be a case of a quasar with an unusual continuum shape and relatively narrow absorption at the systemic redshift. It has an SDSS spectrum which differs from the BOSS spectrum in having a redder continuum shape and a weaker Ly+N v emission line. J1239 has strong narrow high- and low-ionization absorption from a potential damped Ly absorber at =2.4130.001. It has a strong 1900 Å emission complex at a redshift consistent with the absorption redshift. Ly, N v, C iv, He ii and probably Mg ii emission are blueshifted by 3000 km s-1 to =2.3790.001. The spectrum also exhibits a strong UV Fe ii pseudocontinuum. There appears to be broad redshifted absorption in C iv, Si iv and possibly N v extending from at least km s-1 to km s-1 ( km s-1), which would still extend to redshifted velocities even if we adopted the Hewett & Wild (2010) redshift of 2.42220.0055 for this object. Our lack of certainty in the reality and extent of these putative redshifted troughs may be due to the low signal-to-noise ratio of the spectra. Nonetheless, as with J1633, a combination of blueshifted Si iv and C iv emission and strong Fe ii pseudocontinuum could explain the spectrum of this object without redshifted absorption troughs, so for now we consider it merely a candidate.
SDSS J131637.26003636.0 (J1316; Fig. 16) at from [O ii] emission (Hewett & Wild 2010) is our only candidate with Mg ii absorption. This object is not a BOSS ancillary target, but has three SDSS spectra (one of which is very noisy). There is some flux variability between the two best SDSS spectra, but no statistically significant trough variability between the normalized spectra. The spectrum of this object presented in Figure 3 of Hewett, Foltz & Chaffee (2001) was taken in between the last two SDSS spectral epochs and confirms the absorption features bracketing the systemic redshift of Mg ii, extending from km s-1 to km s-1 in a shape. The SDSS spectra show that these are not NAL systems; both “troughs” are smooth over their 2000 km s-1 widths. The blueshifted trough has been included in the BAL quasar samples of Trump et al. (2006) and Gibson et al. (2009). We classify this object as having candidate redshifted absorption because we do not have confirmation of the redshifted trough in other transitions. In fact, this object was mentioned in Hall et al. (2002), where we suggested that both apparent Mg ii troughs could be gaps between Fe ii multiplets seen in emission, as could the apparent troughs near 4000 Å observed. However, those latter features could be redshifted Fe iii absorption, and there may be redshifted Balmer-line absorption as well. The high densities required for such absorption (Hall 2007) could yield a very useful distance constraint for the absorber in this object (see § 4.6), if the absorption is confirmed.
SDSS J134243.87362301.9 (J1342; Fig. 16) has blueshifted troughs in C iv, Si iv, Ly+N v, and O vi (the latter being particularly strong relative to C iv). Our inspection redshift of agrees with the DR9 pipeline redshift and is equal within the errors to the PCA redshift of . It also appears to have a weak, redshifted C iv trough. However, the significance of that putative trough is low due to the noise in the spectrum, and there is no redshifted trough apparent in any other ion. Therefore we consider J1342 as only a candidate for redshifted absorption.
SDSS J170456.42232825.7 (J1704; Fig. 16) has Ly emission which peaks at =3.44100.0005. Hewett & Wild (2010) give =3.4100.009, which is clearly too low a redshift. There is narrow Ly absorption at =3.45000.0005, consistent with the redshift of the broad C iii] line, and so we adopt that as the systemic redshift. However, the DR9Q C iii] redshift is =3.491, in which case its absorption troughs would be purely blueshifted. Examination of the C iii] emission region suggests that the true systemic redshift lies somewhere between these two values. Therefore, we consider this object only a candidate for redshifted absorption until a more robust systemic redshift is available.
Both SDSS and BOSS spectra are available for J1704, which is slightly fainter in the BOSS epoch. There is no significant trough variability between the two epochs. J1704 has troughs extending across our adopted systemic redshift in Si iv, C iv and Al iii from at least km s-1 to km s-1, and blueshifted troughs in Al iii, Al ii, C ii, O i/Si ii, Si ii, N v, C iii* and O vi, with spans of up to km s-1. Because the redshifted portions of the C iv, Si iv and Al iii troughs in this object extend only to +2500 km s-1, it is possible that they are blends of narrow associated absorbers which appear redshifted due to their peculiar velocities (e.g., Wild et al. 2008). That possibility can be tested with high resolution spectroscopy. It is also possible that there is some Fe ii* absorption in this object between C iv and C iii]. However, the wavelengths and strengths of those Fe ii* transitions are not a good match to the apparent redshifted absorption in J1704, which does match Si iv, C iv and Al iii in wavelength.
Finally, for SDSS J213342.06071408.77 (J2133; Fig. 16) we conservatively adopt a systemic redshift of =2.165 from our inspection of the spectrum (the DR9Q PCA and Mg ii PCA redshifts are 2.1). J2133 has troughs at the adopted systemic redshift, plus candidate redshifted troughs, in C iv, Si iv, and N v. It is listed as a candidate primarily because the low signal-to-noise ratio of its spectrum makes both its systemic redshift and the reality of the putative redshifted troughs uncertain. For example, while no DR9Q C iii] PCA redshift is available for this object, its DR9Q full PCA redshift is =2.096, which if correct would make its troughs even more redshifted.
Appendix C Spurious candidates
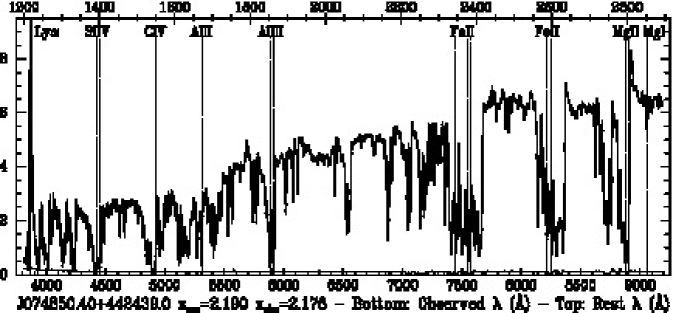
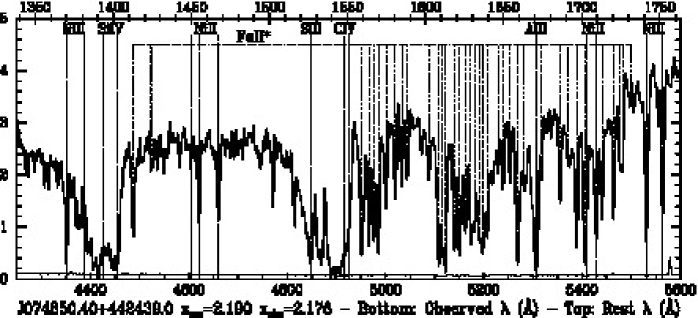
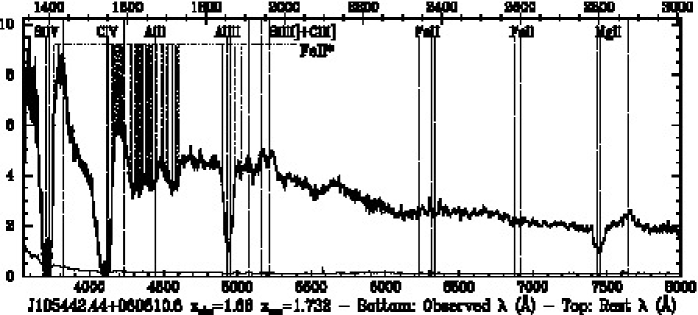
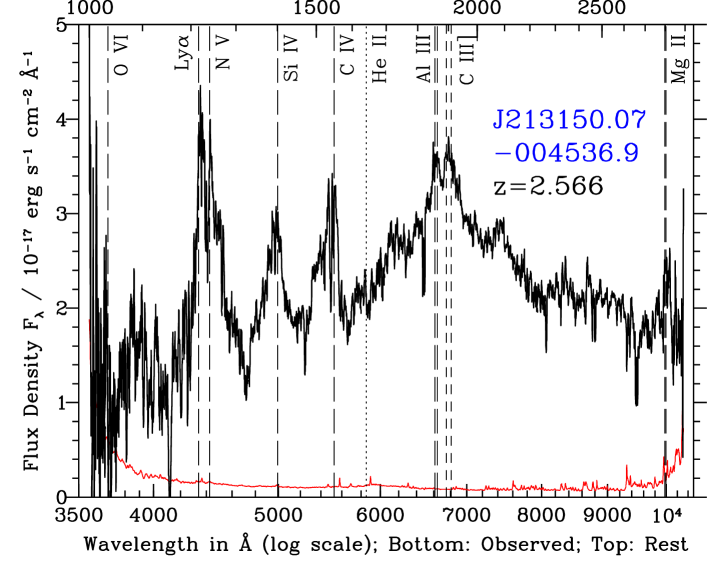
In this section we discuss a number of quasars which have apparent redshifted absorption features in their spectra which are not real.
In Figure 17 we show spectra of quasars wherein absorption from excited-state Fe ii (Fe ii*) resembles redshifted high-ionization absorption. The quasar SDSS J074850.40+442439.0 (hereafter J0748) is shown in the top panel. It is an FeLoBAL with apparent redshifted absorption in C iv but not in Si iv. However, closer inspection of its spectrum from 1350 Å to 1750 Å (middle panel) reveals that the apparent redshifted C iv absorption is part of a complex of Fe ii* absorption with many strong transitions between C iv and C iii] but only one or two strong transitions between Si iv and C iv (see §5.1.1 of Hall et al. 2002). Such Fe ii* absorption can blend together to masquerade as a redshifted C iv trough in other quasars such as SDSS J094633.97365516.8 and SDSS 144424.54+013457.0 (not shown) and SDSS J105442.44+060610.8 (bottom panel). In that panel the dotted lines show Fe ii* absorption at the redshift of strongest absorption in other transitions (dashed lines). Some of the Fe ii* absorbs the C iv emission line, weakening it relative to the Si iv emission line, and some absorbs part of the continuum between rest-frame 1600 Å and 1750 Å. In this object there is little evidence for additional Fe ii* absorption between 2330 Å and 2630 Å which should be present, as it arises from the same lower levels as the observed absorption. Most likely, the absorption is present but is blended with Fe ii emission so as to mimic a relatively smooth continuum.
Fe ii and Fe iii emission may be at work in SDSS J213150.07004546.9 (J2131; Figure 18), which we considered, but ultimately rejected, as a redshifted-absorption candidate. This object has a secure redshift from Al iii+Si iii]+C iii] emission. An extrapolation of the continuum longward of C iii] to shorter wavelengths generates the appearance of strong, redshifted troughs of C iv, Si iv, and N v. However, the detailed shape and position of the putative troughs do not agree with that identification. (E.g., what looks like a moderately broad trough at 4700 Å in the smoothed spectrum is actually the blended Si iv doublet of an intervening metal-line absorber at .) Therefore, the unusual feature in this spectrum is not redshifted absorption but the huge apparent emission feature from 1700–2300 Å. This feature is somewhat reminiscent of that in SDSS J033810.85+005617.6 (§5.3.5 of Hall et al. 2002), but is likely due to some combination of blended Fe ii and Fe iii emission and an extinction curve steeper than that of the SMC (§5.3 of Hall et al. 2002).
Another source of apparent redshifted absorption features is unrecognized flaws in the data. Such flaws are a possibility in any pipeline, and spurious broad features have previously been seen in some SDSS spectra (see, e.g., Hall et al. 2008).
Experience has shown that spectra from certain SDSS fibers, including #374, are more prone to spurious features. For example, SDSS J124224.78364537.1 (SDSS plate-MJD-fiber 2022-53827-374 and BOSS 3973-55323-0536) had an apparent redshifted C iv trough in SDSS which was not confirmed by BOSS spectroscopy. Inspection of the individual spectroscopic exposures in the SDSS revealed that the trough was indeed spurious. The apparent trough is located in the wavelength range where the coverage of the red and blue arms of the SDSS spectrographs overlap. A decrease in flux at the trough wavelengths was present in all of the spectra from the blue arm but none of the spectra from the red arm. The pixels from the blue arm were not rejected, resulting in a spurious trough. Other examples of spurious troughs involving SDSS fiber #374 include SDSS J004418.96090009.4 and SDSS J171216.27+660212.0.
As another example of spurious features tied to certain fibers, the SDSS spectrum of the BL Lac object OM 280 (SDSS J115019.21+241753.8, plate-MJD-fiber 2510-53877-086) appears to show a trough at 4150 Å. This trough is spurious, likely arising from a region of problematic flatfielding (e.g., due to a localized variable feature in the flatfield) in the CCD in the blue arm of SDSS spectrograph #1. This region is visible as a circular depression on the reduced 2-D spectrograms of that CCD in that wavelength range, centered near fiber 81. The affected wavelength region is interpolated over for fibers 78–84, but its effects can sometimes be seen in other nearby fibers such as #86 (used for the spectrum of OM 280), #76 (producing a similar spurious trough in SDSS J115013.88+234602.1), and possibly #73, in which case it could explain the apparent trough in the SDSS spectrum of the BL Lac object PKS 0138097 (Shaohua et al. 2011).
Lastly, inspection of both spectroscopy and imaging can also identify cases of apparent redshifted absorption caused by superpositions. For example, the star-quasar blend SDSS J120749.19+082406.7 has an apparent redshifted Al iii trough from the stellar Mg b feature.
Appendix D Absorber motion and the relativistic Doppler shift
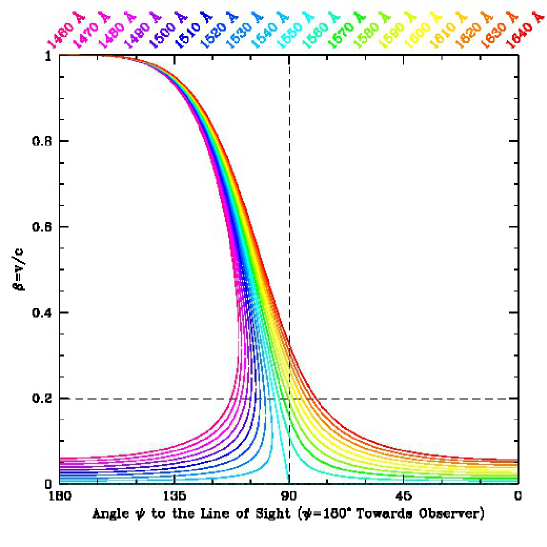
Sher (1968) discuss the implications of the relativistic Doppler effect in terms of the radial and total velocities of the source. We present a similar discussion in terms of the total velocity of the gas and the angle of its motion relative to our line of sight. For simplicity we consider an observer at the systemic redshift of the quasar (but physically distant from it) with the same line of sight to the quasar as us. The only difference between such an observer and us is that the wavelengths seen on Earth are all a factor of longer.
Consider gas moving with speed at an angle to the observer’s line of sight in the observer’s frame, where and points directly toward the observer (in other words, the observer looks in the direction to see the gas). In its own frame, such gas will absorb at the rest wavelength of a given transition, . In the observer’s frame, those absorbed photons have wavelength
| (7) |
Following Foltz et al. (1986), we rewrite this by defining
| (8) |
where . Because refers to motion toward the observer, a negative line-of-sight velocity indicates motion toward the observer.
Redshifted absorption () can be produced by gas moving at relatively low velocity more or less directly away from the observer (). It can also be produced by gas moving purely in the plane of the sky () with . That is the relativistic Doppler effect: due to time dilation, gas moving transversely in the observer’s frame absorbs at a lower frequency (longer wavelength) than stationary gas (Figure 19).
As there is nothing singular about , redshifted absorption can also be produced by gas moving in directions (toward the observer) as long as is large enough that in the observer’s frame the blueshifted velocity of the absorbing gas is counteracted by its increased time dilation.
Absorption at the rest wavelength of a transition can be produced by gas at rest. It cannot be produced by gas moving away from the observer. However, absorption at the rest wavelength can be produced by gas moving toward the observer at any , provided that the gas moves at an angle
| (9) |
Blueshifted absorption can only be produced by gas moving toward the observer (). For any given , there is a minimum at which gas can be moving and still produce absorption at :
| (10) |
However, for any , there are two values of which yield absorption at the same . Consider gas moving at a given and photons with . For just below unity, relatively low-velocity gas (for which time dilation is negligible) can absorb those photons when its motion redshifts them to the rest wavelength of the transition in the absorbing gas frame. Extremely high-velocity gas can also absorb those photons because the highly blueshifted velocity of the absorbing gas in the observer’s frame is counteracted by its large time dilation. For smaller , there continue to be two velocities of at which absorption will occur, but time dilation is not negligible for either of them. Only for does this effect vanish.
As a final aside, we note that detections of relativistic quasar outflows via highly ionized X-ray absorption troughs, both broad and narrow, have been reported over the past decade (e.g., Chartas et al. 2009; Kaspi & Behar 2010; Tombesi et al. 2011). While the significance of narrow X-ray absorption line detections has been questioned, in part due to their variability between different observations (Vaughan & Uttley 2008), strong variability would be natural for such high-velocity outflows and has been observed in Mrk 766 (Risaliti et al. 2011). Furthermore, an additional potential source of variability is that if the outflow varies in even at fixed , will vary. Lastly, a given ratio of observed energy to rest energy () for such an outflow yields a maximum angle it can have to the line of sight, which may be a useful constraint for models of such outflows.