The supermassive black hole mass - Sérsic index relations for bulges and elliptical galaxies
Abstract
Scaling relations between supermassive black hole mass, , and host galaxy properties are a powerful instrument for studying their coevolution. A complete picture involving all of the black hole scaling relations, in which each relation is consistent with the others, is necessary to fully understand the black hole-galaxy connection. The relation between and the central light concentration of the surrounding bulge, quantified by the Sérsic index , may be one of the simplest and strongest such relations, requiring only uncalibrated galaxy images. We have conducted a census of literature Sérsic index measurements for a sample of 54 local galaxies with directly measured values. We find a clear relation, despite an appreciable level of scatter due to the heterogeneity of the data. Given the current and the relations, we have additionally derived the expected relations, which are marginally consistent at the level with the observed relations. Elliptical galaxies and the bulges of disc galaxies are each expected to follow two distinct bent relations due to the Sérsic/core-Sérsic divide. For the same central light concentration, we predict that in the Sérsic bulges of disc galaxies are an order magnitude higher than in Sérsic elliptical galaxies if they follow the same relation.
keywords:
galaxies: bulges – galaxies: fundamental parameters – galaxies: structure – black hole physics1 Introduction
Observations over the past decade have suggested a strong connection between supermassive black holes (SMBHs) and their host galaxies, or rather spheroids, in spite of the huge difference between their respective sizes. While it is clear that the stories of these two objects – the black hole and the galaxy – are tightly interwoven, the origin and nature of their link are still a subject of debate. The scaling relations between the SMBH mass, , and the host spheroid properties make the study of black hole growth an indispensable ingredient to understand the more general framework of galaxy formation and evolution. Beyond the well known relation with the velocity dispersion (Ferrarese & Merritt, 2000; Gebhardt et al., 2000; Graham et al., 2011), the masses of SMBHs have been shown to correlate with a wide series of properties belonging to the spheroidal component of the host galaxy, such as the spheroid luminosity (Kormendy & Richstone, 1995; McLure & Dunlop, 2002; Marconi & Hunt, 2003; Graham & Scott, 2013) and stellar mass (Laor, 2001; Scott et al., 2013), the spheroid dynamical mass (Magorrian et al., 1998; Marconi & Hunt, 2003; Häring & Rix, 2004; Graham, 2012) and the central stellar concentration of the spheroid (Graham et al., 2001). The connection between bulge mass and disc galaxy morphological type means that the pitch angle of a disc galaxy’s spiral arms is also related to the black hole mass (e.g. Davis et al. 2013; Berrier et al. 2013, and references therein). The old and relations were actually inconsistent with each other (e.g. Lauer et al. 2007), and inconsistent with the curved relation (Graham & Driver, 2007a) given the existence of a linear relation (see Section 4). The first of these inconsistencies was addressed in Graham (2012; see also Section 6 of Graham 2008), and we tackle the second here. The astrophysical interest in all of these empirical relations resides partly in the fact that they must all be taken into account by any complete theory or model describing the coevolution of galaxies and SMBHs, and also in their employment to predict the masses of SMBHs in other galaxies.
A decade ago Graham et al. (2001) presented evidence for a strong correlation between the stellar light concentration of spheroids and their SMBH mass, showing that more centrally concentrated spheroids have more massive black holes. Graham & Driver (2007a) re-investigated the same relation, directly using the Sérsic (1963, 1968) index as a measure of the radial concentration of the stars. In addition to a log-linear relation, Graham & Driver (2007a) fit a log-quadratic regression, finding that the relation changed slopes at the low- and high-mass end, and had a level of scatter equivalent to the relation at that time (). The advantages of using the relation to predict the mass of SMBHs are several: as noted by Graham & Driver (2007a), the measurement of requires only images (even photometrically uncalibrated); is not heavily affected by possible kinematic substructure at the center of a galaxy, nor by rotational velocity or the vertical velocity dispersion of an underlying disc, nor by aperture corrections; it is cheap to acquire in terms of telescope time; does not depend on galaxy distances.
Pastrav et al. (2013) have recently pointed out that the recent deep, wide-field photometric surveys of galaxies – e.g. the Sloan Digital Sky Survey (SDSS, York et al. 2000) and the Galaxy And Mass Assembly (GAMA, Driver et al. 2011) – are providing us with large statistically useful samples of galaxies whose major morphological components can be resolved out to . Furthermore, automatic image analysis routines, such as GIM2D (Simard et al., 2002), GALFIT (Peng et al., 2002, 2010), BUDDA (Gadotti, 2008) and GALPHAT (Yoon, Weinberg & Katz, in preparation), can be used to model the surface brightness distribution of the stellar components of these galaxies (e.g. Allen et al. 2006; Simard et al. 2011; Kelvin et al. 2012). A bulge/disc decomposition, along with adequate corrections to account for dust and inclination effects as provided by Pastrav et al. (2013), can provide the Sérsic index of the spheroid component of both elliptical and disc galaxies. This can then be used to predict black hole masses in large samples of galaxies to derive the local black hole mass function (e.g. Graham et al. 2007) and space density (Graham & Driver 2007b, and references therein), if a well calibrated relation exists. However, in the past two years Sani et al. (2011), Vika et al. (2012) and Beifiori et al. (2012) have failed to recover a strong relation.
Due to the existence of the luminosity- relation (e.g. Young & Currie 1994; Jerjen et al. 2000; Graham 2013, and references therein) and the luminosity relation (e.g. Magorrian et al. 1998), an relation must exist111It is not yet established which are the primary or secondary relations.. It is important to investigate why the relation may not have been recovered in the above studies. It is also important to know how it fits in with, and is consistent with, the other scaling relations. Not only does a proper and complete understanding of the SMBH-galaxy connection require this, but the central concentration of stars, reflecting the inner gradient of the gravitational potential, should be intimately related to the black hole mass. A well determined relation may also provide an easy and accurate means to predict black hole masses in other galaxies. Eventually, semi-analytic models of galaxy formation and simulations should include in their recipes all of the black hole mass scaling relations.
In this work we present a census of literature Sérsic index measurements for local galaxies with directly measured supermassive black hole mass. We re-investigate and recover the relation using the combined data from four past independent works. In Section 2 we describe our galaxy sample, and in Section 3 we present the scaling relation which is then discussed and compared with predictions in Section 4. Finally, we summarize our analysis in Section 5.
2 Data
2.1 SMBH masses
Our SMBH galaxy sample comes from Graham & Scott (2013), who have built a catalog of 80 galaxies with supermassive black hole masses obtained from direct maser, stellar or gas kinematic measurements. Black hole masses for our final sample are listed in Table 1, along with their total galaxy B-band absolute magnitudes, , taken from the Third Reference Catalogue of Bright Galaxies (de Vaucouleurs et al. 1991, hereafter RC3) and also their morphological classification. The final sample consists of those galaxies for which Sérsic indices have been reported by at least one of the four studies mentioned below.
2.2 Collecting Sérsic indices
The radial light distribution of spheroidal systems (such as elliptical galaxies or the bulges of lenticular and spiral galaxies) is well described by the Sérsic (1963, 1968) model that parametrizes the intensity as a function of the projected galactic radius such that
(Caon et al. 1993; Andredakis et al. 1995; Graham & Driver 2005, and references therein). The quantity is the intensity at the effective radius that encloses half of the total light from the model, and is a constant defined in terms of the Sérsic index , which is the parameter that measures the curvature of the radial light profile.
We obtained Sérsic index measurements for our SMBH sample from the following four independent works.
i) Graham & Driver (2007a, hereafter GD07) fit the radial light profiles from a sample of 27 elliptical and disc galaxies with SMBH masses derived from resolved dynamical studies. The light profiles they used were predominantly from Graham et al. (2001), who searched the various public archives for high-quality R-band images and fit ellipses to the isophotes with the IRAF task ellipse, allowing the position angle and ellipticity to vary with radius222A discussion of the original galaxy light profiles can be found in Erwin et al. (2004) and Trujillo et al. (2004).. The resulting light profiles were then fit by GD07 with a seeing-convolved Sérsic model for elliptical galaxies, and with a combined (seeing-convolved) exponential disc and bulge for the disc galaxies, using the subroutine UNCMND from Kahaner et al. (1989). The inner couple of arcseconds of the profiles was in some instances excluded from the fit due to the potential presence of partially depleted cores or AGNs, that would produce a biasing central deficit or excess of light relative to the inward extrapolation of their outer Sérsic profile.
ii) Vika et al. (2012, hereafter V12) investigated the and the relations. They performed two dimensional (2D) profiling with GALFIT3 on near-IR images (from the UKIDSS-LASS survey) of a sample of 25 galaxies. V12 fit the light distribution using a Sérsic function for the elliptical galaxies, the bulges and the bars of lenticular/spiral galaxies, and an exponential function for the disc components. In the case of core-Sérsic galaxies with partially depleted cores, they implemented a mask for the inner region. Bright nuclei were additionally modelled as point sources using the PSF. A relation between SMBH mass and the Sérsic index was not found by V12. They noticed that the Sérsic index can vary significantly from study to study and they suggested that such mismatch may be due to the different weighting of pixels during the fit that each study used and/or to a wavelength bias. The signal-to-noise weighted fitting routines, such as GALFIT, can be highly sensitive to central dust obscuration, unaccounted for central excesses and deficits of light relative to the fitted model, and especially errors in the adopted PSF.
iii) From their GALFIT3-derived 2D bulge-disc decompositions of Spitzer/IRAC images of 57 galaxies, Sani et al. (2011, hereafter S11) investigated the scaling relations between SMBH mass and several other parameters of the host spheroids. The image decomposition was performed with a Sérsic model for the elliptical galaxies and with a Sérsic model plus an exponential model for the lenticular and spiral galaxies. A Gaussian component and a nuclear point source were added in the presence of a bar or an AGN, respectively. In an attempt to restrict the degeneracy between the effective radius and the Sérsic index, following Hunt et al. (2004), S11 performed 2D fitting by fixing the Sérsic index to a set of constant values in the range between and . They found tight correlations between the SMBH mass and the bulge luminosity and dynamical mass. However, the relation between the SMBH mass and the effective radius had a high intrinsic dispersion and no correlation with the Sérsic index was found.
iv) Beifiori et al. (2012, hereafter B12) analyzed Sloan Digital Sky Survey -band images and extracted photometric and structural
parameters for a sample of 57 galaxies, for which
19 had an accurate measurement and the remaining 38 had only an upper limit
which are not used here.
They performed 2D decompositions with GASP2D (Méndez-Abreu et al., 2008), using a Sérsic
profile to model the elliptical galaxies and a combination of a Sérsic plus an exponential model for the disc
galaxies. Galaxies affected by poor decomposition due to either a central bar, a Freeman Type II disc profile (Freeman, 1970),
or just inadequately represented by the single or double component modelling were eliminated from their initial sample.
Among their correlations involving the SMBH mass and the parameters of the
host galaxy, the tightest was with the stellar velocity dispersion.
Little or no correlation was found with the Sérsic index (see their Figure 7).
Table 1 reports the Sérsic index measurements from the above four works, along with the type of photometric decomposition performed. It comprises 62 galaxies. Each galaxy can have up to four Sérsic index estimates. 35 galaxies have multiple measurements of their Sérsic index. In the next two Sections we discuss how we compare and combine them.
| Galaxy | Type | core | Decomposition | |||||||||||
| GD07a | V12b | S11c | B12d | GD07a | V12b | S11c | B12d | |||||||
| [mag] | ||||||||||||||
| (1) | (2) | (3) | (4) | (5) | (6) | (7) | (8) | (9) | (10) | (11) | (12) | (13) | ||
| Abell 1836-BCG | E1 | y? | BD | 2.73 | ||||||||||
| Circinus | Sb | n? | BD | 2.0 | ||||||||||
| IC 1459 | E | y | Bg | 6.0 | ||||||||||
| IC 2560 | SBb | n? | BDg | 2.0 | ||||||||||
| MESSIER 32 | S0? | n | BD | BDm | BD | 1.51 | 2.1 | 4.0 | ||||||
| MESSIER 59 | E | n | Bm | B | 5.7 | 5.0 | ||||||||
| MESSIER 60 | E1 | y | B | Bm | BD | BD | 6.04 | 3.6 | 3.0 | 1.63 | ||||
| MESSIER 64 | Sab | n? | BD | 1.49 | ||||||||||
| MESSIER 77 | SBb | n | BDbm | BDg | BD | 0.8 | 1.0 | 1.27 | ||||||
| MESSIER 81 | Sab | n | BD | BDg | BD | 3.26 | 3.0 | 2.57 | ||||||
| MESSIER 84 | E1 | y | B | Bm | Bg | B | 5.60 | 3.5 | 7.0 | 4.10 | ||||
| MESSIER 87 * | E0 | y? | B | Bm | Bg | 6.86 | 2.4 | 4.0 | ||||||
| MESSIER 89 | E | y | B | BDg | B | 3.6 | 4.0 | 4.30 | ||||||
| MESSIER 96 | SBab | n | BDb | 1.0 | ||||||||||
| MESSIER 104 | Sa | y | BDbg | 1.5 | ||||||||||
| MESSIER 105 | E1 | y | B | B | 4.29 | 5.0 | ||||||||
| MESSIER 106 | SBbc | n | BD | BDp | BDg | 2.04 | 3.5 | 2.0 | ||||||
| Milky Way | SBbc | n | BD | 1.32 | ||||||||||
| NGC 0524 | S0 | y | BD | 3.0 | ||||||||||
| NGC 0821 | E | n | B | B | B | 4.00 | 7.0 | 7.70 | ||||||
| NGC 1023 | SB0 | n | BD | BDb | 2.01 | 3.0 | ||||||||
| NGC 1300 | SBbc | n | BD | 3.0 | ||||||||||
| NGC 1316 | SB0 | y? | BDg | 5.0 | ||||||||||
| NGC 1399 | E | y | B | 16.8 | ||||||||||
| NGC 2549 | SB0 | n | BD | 7.0 | ||||||||||
| NGC 2778 | SB0 | n | BD | BD | BD | 1.60 | 2.7 | 2.5 | ||||||
| NGC 2787 * | SB0 | n | BD | BDbg | 1.97 | 3.0 | ||||||||
| NGC 2960 | Sa? | n? | BD | 4.0 | ||||||||||
| NGC 2974 | E | n | Bg | 3.0 | ||||||||||
| NGC 3079 | SBc | n? | BDbg | 2.0 | ||||||||||
| NGC 3115 * | S0 | n | BD | BD | 13.0 | 3.0 | ||||||||
| NGC 3227 | SBa | n | BD | 4.0 | ||||||||||
| NGC 3245 | S0 | n | BD | BD | BD | BD | 4.31 | 2.6 | 2.5 | 1.60 | ||||
| NGC 3377 | E5 | n | B | B | B | 3.04 | 6.0 | 3.47 | ||||||
| NGC 3384 | SB0 | n | BD | BDb | BD | 1.72 | 2.5 | 2.33 | ||||||
| NGC 3414 | S0 | n | BDb | 5.0 | ||||||||||
| NGC 3489 | SB0 | n | BD | 1.5 | ||||||||||
| NGC 3585 | S0 | n | BD | 2.5 | ||||||||||
| NGC 3607 | S0 | n | Bg | B | 5.0 | 4.70 | ||||||||
| NGC 3608 * | E2 | y | B | B | 6.0 | 9.03 | ||||||||
| NGC 3998 * | S0 | y? | BDg | BD | 1.5 | 2.29 | ||||||||
| NGC 4026 | S0 | n | BD | 3.5 | ||||||||||
| NGC 4151 | SBab | n | BDg | 3.5 | ||||||||||
| NGC 4261 | E2 | y | B | Bm | BDg | B | 7.30 | 3.5 | 4.0 | 4.31 | ||||
| NGC 4291 | E2 | y | B | 4.02 | ||||||||||
| NGC 4342 * | S0 | n | BD | BD | 5.11 | 1.9 | ||||||||
| NGC 4459 * | S0 | n | B | BD | B | 3.9 | 2.5 | 7.44 | ||||||
| Table 1. Continued. | ||||||||||||||
| Galaxy | Type | core | Decomposition | |||||||||||
| GD07a | V12b | S11c | B12d | GD07a | V12b | S11c | B12d | |||||||
| [mag] | ||||||||||||||
| (1) | (2) | (3) | (4) | (5) | (6) | (7) | (8) | (9) | (10) | (11) | (12) | (13) | ||
| NGC 4473 | E5 | n | B | Bm | B | BD | 2.73 | 4.3 | 7.0 | 2.23 | ||||
| NGC 4486A | E2 | n | Bm | B | 2.0 | 2.5 | ||||||||
| NGC 4564 | S0 | n | BD | BD | BD | 3.15 | 3.7 | 7.0 | ||||||
| NGC 4596 | SB0 | n | BDb | BDb | BD | 3.6 | 3.0 | 4.43 | ||||||
| NGC 4697 | E4 | n | B | B | B | B | 4.00 | 3.8 | 5.0 | 4.96 | ||||
| NGC 5077 | E3 | y | Bg | 6.0 | ||||||||||
| NGC 5128 | S0 | n? | BDbg | 3.5 | ||||||||||
| NGC 5252 | S0 | n | BD | 4.82 | ||||||||||
| NGC 5576 | E3 | n | Bm | B | B | 5.1 | 7.0 | 8.71 | ||||||
| NGC 5813 | E | y | Bm | B | 8.3 | 6.0 | ||||||||
| NGC 5845 | E3 | n | B | B | B | B | 3.22 | 2.6 | 3.0 | 3.45 | ||||
| NGC 5846 | E | y | Bm | B | 3.7 | 3.0 | ||||||||
| NGC 6251 * | E2 | y? | B | Bg | 11.8 | 7.0 | ||||||||
| NGC 7052 | E | y | B | BD | B | 4.55 | 1.8 | 5.0 | ||||||
| NGC 7582 | SBab | n | BDg | 4.0 | ||||||||||
| a Graham & Driver (2007a). b Vika et al. (2012). c Sani et al. (2011). d Beifiori et al. (2012). | ||||||||||||||
2.3 Comparing Sérsic indices
There are three main points that distinguish each study: the first is the wavelength of the image.
The spatial distribution of the surface brightness of a galaxy, and hence its light profile, is a function of the observational bandpass. This means that the structural parameters, in general, may vary with wavelength due to stellar population gradients or dust obscuration. The central light concentration of a galaxy, described by the Sérsic index, is indeed a slight function of wavelength. Using reprocessed Sloan Digital Sky Survey Data Release Seven (SDSS DR7, Abazajian et al. 2009) and UKIRT Infrared Deep Sky Survey Large Area Survey (Lawrence et al., 2007) imaging data available from the Galaxy And Mass Assembly (GAMA) database, Kelvin et al. (2012) performed 2D model fits with GALFIT to 170,000 galaxies in the bandpasses, using primarily a pure Sérsic profile, to quantify how photometric and structural parameters of a galaxy vary with wavelength. Their Figure 21 shows the mean Sérsic index as a function of the rest-frame wavelength for two subsamples: the disc-dominated and the spheroid-dominated systems. Kelvin et al. (2012) find that the spheroid-dominated population is characterized by mean Sérsic indices that remain relatively stable at all wavelengths, with increasing by 30% from to .
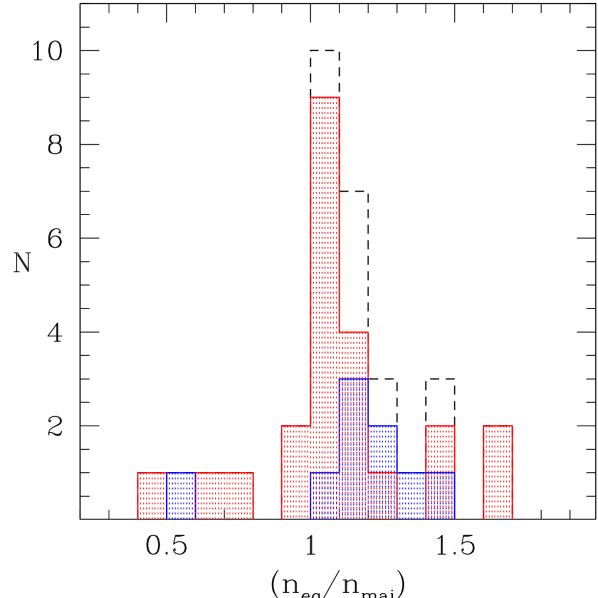
The second point is the model fitting method: one-dimensional and two-dimensional photometric decomposition techniques, if performed on the same galaxy, can produce different values of the Sérsic index due to ellipticity gradients which the 2D models cannot accommodate. The parameters of the Sérsic model can vary if derived along the major- or the minor-axis, as first noted by Caon et al. (1993). Ferrari et al. (2004) quantified such discrepancy in terms of ellipticity gradients, i.e. the isophote eccentricity that varies with radius. The histogram in Figure 1 has been created using data from Caon et al. (1993) and shows the distribution of the ratio between the “equivalent” Sérsic index and that measured along the major-axis, . The “equivalent” axis is the geometric mean, , of the major and the minor axis of the isophotal ellipses. The mean (and the standard deviation) of the whole sample is . This tells us that the equivalent Sérsic index is on average 10% higher than the major-axis Sérsic index. From Figure 1, their relative difference will be less than 40% in 95% of the time.
The third issue pertains to the weighting-scheme used for the fits. The arrival of photons, which build up a galaxy image, is a Poissonian process (), which therefore advocates the need for a signal-to-noise weighted fitting scheme. However the presence of active galactic nuclei, nuclear star clusters, nuclear stellar discs, dust, partially-depleted cores and an uncertain PSF make such a weighting prone to error unless all of these factors are taken into account.
Hence, what do we expect from our heterogeneous collection of data? First, the wavelength bias should produce a systematic effect in the Sérsic index measurements, i.e. we expect the measurements from GD07 (R-band) and B12 (-band) to be slightly smaller than those from V12 (K-band) and S11 (m). Second, because the Sérsic index derived from a two-dimensional analysis can be approximated to the one-dimensional , one may expect the Sérsic index derived from one-dimensional decomposition along the major-axis, as performed by GD07, to be slightly smaller than the Sérsic index derived from the two-dimensional modelling in V12, S11 and B12. However, when we compare different measurements of the Sérsic index (belonging to the same galaxy), we do not observe the previous systematic effects; moreover, for a non negligible number of galaxies we find that multiple measurements have a relative difference333Given two measurements and , with , we define the relative difference as . greater than 50%.
| Galaxy | |||||||
| (1) | (2) | (3) | (4) | (5) | (6) | (7) | (8) |
| Galaxies with same choice of decomposition | |||||||
| M87 | |||||||
| NGC 0821 | |||||||
| NGC 3115 | |||||||
| NGC 4342 | |||||||
| NGC 4564 | |||||||
| NGC 6251 | |||||||
| Galaxies with different choices of decomposition | |||||||
| M60 | |||||||
| NGC 4459 | |||||||
| NGC 7052 | |||||||
Many factors, if not properly taken into account, can affect the model-fitting of the light distribution of a galaxy and hence the derivation of its structural parameters. These factors can include: additional nuclear components; the presence of a bar; a partially depleted core in high resolution images; a bad sky subtraction, etc. Moreover, different choices of structural components for the same galaxy will produce contrasting Sérsic indices. Table 2 reports a few examples of discrepant measurements. For the first five galaxies, each study used the same type of decomposition (Sérsic or Sérsic+exponential). For the last three galaxies each study performed a different image decomposition. M60 was modelled with a pure Sérsic profile by GD07 and V12, while S11 and B12 used an additional disc component. NGC 4459 has a bulge+disc profile according to S11, while V12 and B12 agreed in modelling the galaxy with a pure Sérsic profile. GD07 and S11 fit NGC 7052 with a pure Sérsic profile, whereas V12 chose a bulge+disc model. An exhaustive analysis of why the individual Sérsic indices differ from author to author is however beyond the scope of the present work.
2.4 Combining Sérsic indices
To combine the results of these four heterogeneous works, we decided to use a method that was as simple as possible and that involved the least manipulation of the data. Our strategy consisted of looking at galaxies with multiple measurements, comparing the different Sérsic indices and excluding the most contrasting measurements before then averaging the remaining Sérsic indices.
The exclusion-algorithm is the following: given a galaxy A that has been analyzed by more than one study, we take each measurement and we look for the closest one . If the absolute difference is more than 50% of the minimum among the two measurements, we exclude . Obviously, if a galaxy has only two measurements, we exclude both of them. After applying the exclusion-algorithm, we compute the average logarithmic value of the remaining measurements to give us .
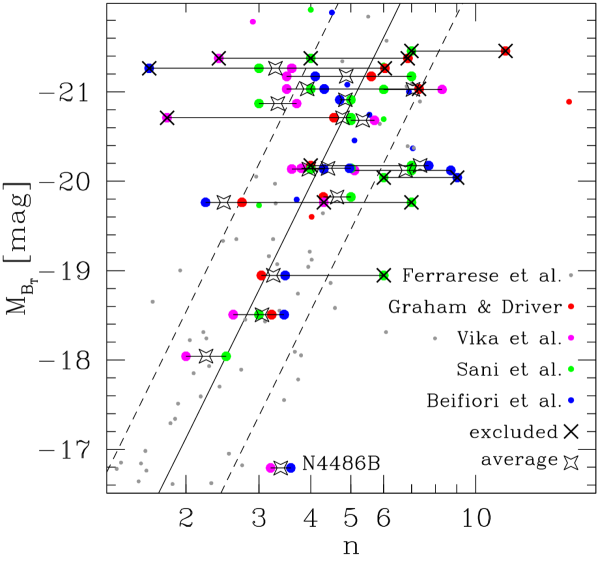
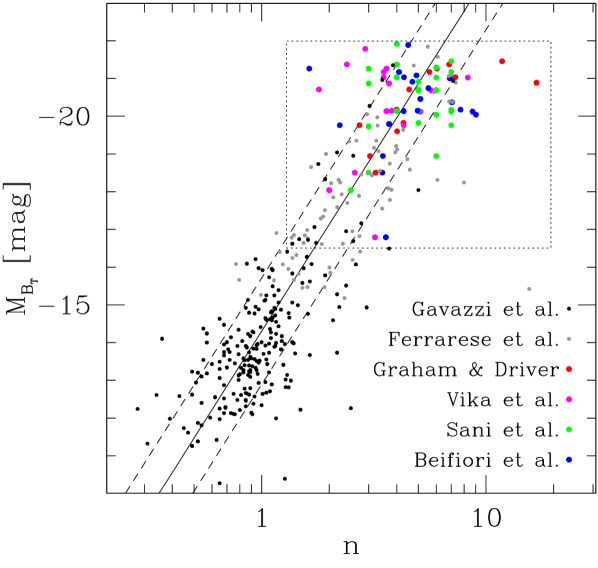
Figures 2 and 3 are helpful to visualize our approach. Figure 3 is a “zoom” of Figure 2 and they both show the absolute total B-band magnitude of elliptical galaxies plotted against their Sérsic index. The black solid line shows the relation from Graham & Guzmán (2003) such that , while the dashed lines are a rough “by eye” estimate of its scatter.
The horizontal solid lines in Figure 3 connect the different Sérsic index measurements of the same galaxy. If a galaxy’s Sérsic index has been measured by more than one study, it is represented with a bigger dot. Thus, small dots refer to galaxies that have been measured by only one study. A black cross on a dot means that we intend to exclude that particular measurement because it is in strong disagreement () with the other points according to our exclusion-algorithm. The average of the logarithmic values of the remaining measurements is denoted by an empty star.
We apply the same procedure to the bulges of the lenticular and spiral galaxies, which are not shown in the plots (Figures 2 and 3), but are included in the following analysis. Our final sample consists of 54 galaxies with directly measured SMBH mass and at least one measurement of the Sérsic index; among these, 27 galaxies have indices measured by more than one study. The 8 galaxies excluded from the initial sample of 62 objects, due to widely varying Sérsic indices, are marked with a star in Table 1.
3 Analysis
After taking galaxies with multiple Sérsic index measurements, rejecting the outlying values and averaging the remaining ones, according to the strategy discussed in Section 2.4, we build the diagram. For galaxies with multiple measurements, we calculated the error on their mean Sérsic index, whereas for single-measured objects we assumed an error444The error of single-measured objects was estimated as follows. Using the 35 galaxies with multiple measurements of their Sérsic indices, we first computed the average of each galaxy without applying the exclusion algorithm (see Section 2.4) and its error ; we then calculated the median value of the errors (20%). of 20%. Figure 4a includes galaxies with single and averaged-multiple Sérsic indices, whereas Figure 4b only shows those with an averaged-multiple measurement and is thus more reliable.
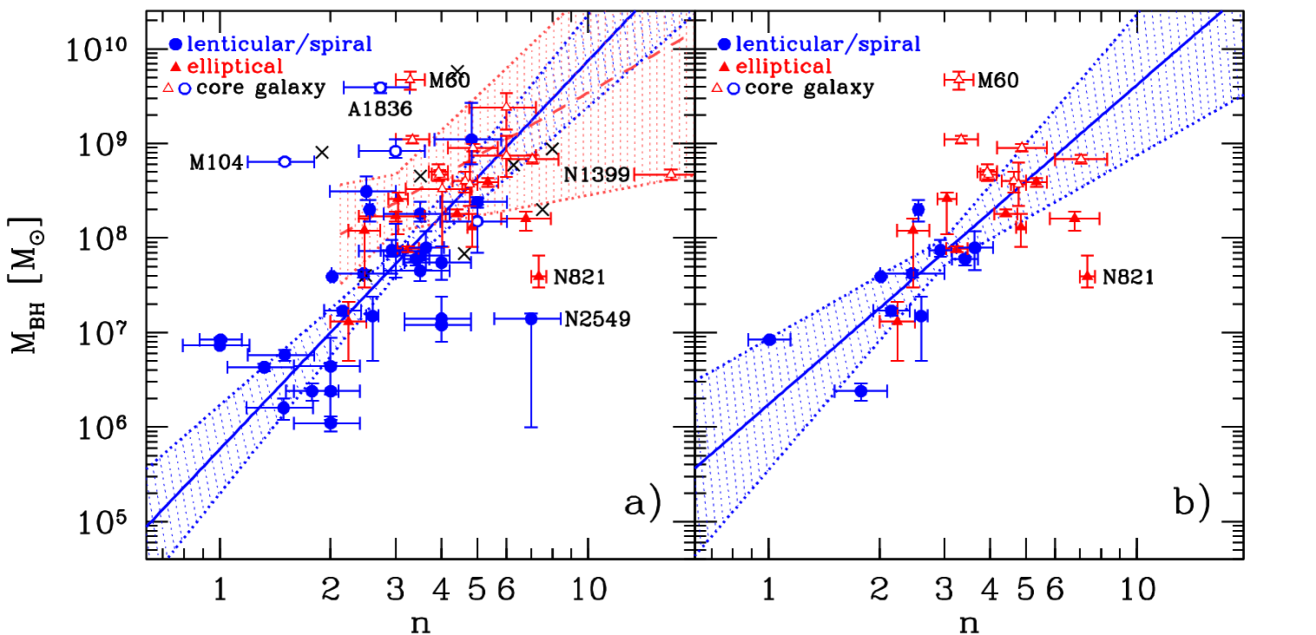
Despite the higher level of scatter in Figure 4a, both diagrams display an appreciable correlation between the SMBH mass and the spheroid light concentration. That is, after excluding the discrepant Sérsic indices according to the process in Section 2.4, presumably from poor fits, we recover a clear trend between black hole mass and Sérsic index. We have visually identified six555Abell 1836-BCG, M60, M104, NGC 1399, NGC 821, NGC 2549. outliers in Figure 4a and two666M60, NGC 821. outliers in Figure 4b; these objects are labelled in both diagrams and were excluded from the following regression analysis. The Spearman’s correlation coefficients and the likelihood of the correlation occuring by chance are given in Table 3. In both panels we have performed a symmetrical linear bisector regression using the BCES routine from Akritas & Bershady (1996), which was checked using the Bayesian linear regression code linmix_err (Kelly, 2007). However, we have not lumped all the galaxy data together, as there is good reason not to do this.
| Figure 4a excluding outliers | ||
|---|---|---|
| Figure 4a including outliers | ||
| Figure 4b excluding outliers | ||
| Figure 4b including outliers |
Among our galaxy sample with direct measurements, Graham & Scott (2013) identified “core-Sérsic” galaxies that display a central deficit of light relative to the inward extrapolation of their outer Sérsic light profile, and “Sérsic” galaxies that do not (Graham & Guzmán, 2003; Graham et al., 2003; Trujillo et al., 2004). “Core-Sérsic” galaxies are thought to have formed from dry merger events, whereas “Sérsic” galaxies are the result of gaseous processes. Their classification (Column 5 of Table 1) has primarily come from the inspection of high-resolution images. When no core designation was available or possible from the literature, Graham & Scott (2013) used a criteria based on the velocity dispersion , such that galaxies with are considered likely to possess a partially depleted core, while galaxies with are not. For reasons discussed in Section 4, we divided our sample into four subsamples:
-
-
the Sérsic bulges of disc galaxies;
-
-
Sérsic elliptical galaxies;
-
-
the core-Sérsic bulges of disc galaxies;
-
-
core-Sérsic elliptical galaxies.
We expect a different relation for each of the previous subsamples,
and hence we elect not to perform a single linear regression to all the data
shown in Figures 4a and 4b.
Our symmetrical regressions have been performed for
the Sérsic bulges of disc galaxies in Figures 4a and 4b
and for core-Sérsic elliptical galaxies in Figure 4a.
Due to small numbers, the statistics were not able to provide reliable regressions for
core-Sérsic elliptical galaxies in Figure 4b, nor for
Sérsic elliptical galaxies and core-Sérsic bulges in either Figures 4a and
4b.
Table 4 contains the results from the symmetrical regressions.
All of the outliers reside more than from the
linear regressions.
| # | Type | |||
| Figure 4a | ||||
| 9 | Sérsic elliptical galaxies | … | … | … |
| 27 | Sérsic bulges | 0.62 | ||
| 10 | Core-Sérsic elliptical galaxies | 0.27 | ||
| 2 | Core-Sérsic bulges | … | … | … |
| Figure 4b | ||||
| 8 | Sérsic elliptical galaxies | … | … | … |
| 10 | Sérsic bulges | 0.44 | ||
| 7 | Core-Sérsic elliptical galaxies | … | … | … |
| 0 | Core-Sérsic bulges | … | … | … |
4 Predictions and discussion
The relation can be predicted from two other important scaling relations: the and the relations, where is the luminosity of the galaxy’s spheroidal component.
Since at least Graham (2001, his Figure 14), we have known that
the relation is different for elliptical galaxies and the bulges of disc galaxies.
Figure 10 from Graham & Guzmán (2003) and Figure 11 from Graham (2013) display the
relation for elliptical galaxies (in the B-band) and for the bulges of disc galaxies
(in the Ks-band) respectively.
In both Figures, the linear regressions had been estimated “by eye”.
We re-analyzed the data from their Figures and performed a symmetrical linear
bisector regression analysis using the BCES routine from Akritas & Bershady (1996).
We obtained
for the elliptical galaxies, and
for the bulges of the disc galaxies. Here indicates the absolute B-band magnitude of elliptical galaxies and indicates the dust-corrected, absolute Ks-band magnitude of the bulges of disc galaxies.
We have used the relation from Graham & Scott (2013) who derived B-band and Ks-band bulge magnitudes, from the total luminosity of lenticular and spiral galaxies, through a statistical correction that takes into account inclination effects and dust absorption. Following Graham (2012), Graham & Scott (2013) derived the relation separately for core-Sérsic and Sérsic spheroids. They observed a near-linear relation for the core-Sérsic spheroids, thought to be built in additive dry merger events, and a notably (2.5 times) steeper relation for the Sérsic spheroids considered to be products of gas-rich processes. They reported
and
for their core-Sérsic subsample, whereas
and
for their Sérsic galaxies.
The bent nature of the above relations
and the linear nature of the two distinct relations for elliptical galaxies and bulges
requires that there be two distinct bent relations for elliptical galaxies and bulges.
This explains the curved nature of the relation reported by Graham & Driver (2007a).
The predicted relations, derived from the above six equations, are reported in Table 5
and shown in Figure 5.
| Type | Prediction |
|---|---|
| Sérsic elliptical galaxies | |
| Sérsic bulges | |
| Core-Sérsic elliptical galaxies | |
| Core-Sérsic bulges |
The expected relations for the Sérsic bulges of disc galaxies and for core-Sérsic elliptical galaxies (Table 5) are marginally consistent at the level with the results from the linear regression analysis performed in Figure 4 (Table 4). More quality data and a wider range of Sérsic indices would be beneficial to confirm the predicted relations.
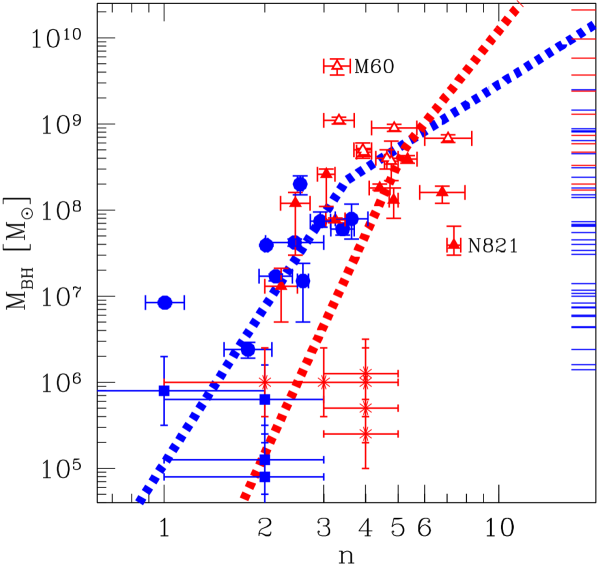
For comparison, in Figure 5 we plot 10 additional galaxies with taken from the sample of Greene et al. (2008). The horizontal offset that separates the bulges of their 4 disc galaxies from their 6 elliptical galaxies supports our predicted gap between the relations for elliptical galaxies and bulges at the low-mass end of this diagram. If the bent relation is the same for all galaxies – irrespective of their morphology – this gap occurs because elliptical galaxies and the bulges of disc galaxies inhabit different regions of the diagram (see Figure 14 in Graham 2001). That is, for a given light profile shape (i.e. Sérsic index ) the bulges of disc galaxies are brighter than elliptical galaxies. Figure 5 allows one to predict that an order of magnitude gap is expected between the SMBH masses of Sérsic elliptical galaxies and the Sérsic bulges of disc galaxies having the same .
In Figure 5 we also show the black hole masses of 51 galaxies that belong to the sample of Graham & Scott (2013) but do not have multiple Sérsic index measurements. Among them, 13 are core-Sérsic elliptical galaxies, 5 are core-Sérsic bulges of disc galaxies, one is a Sérsic elliptical galaxy and 32 are Sérsic bulges of disc galaxies. We point out that measuring the Sérsic indices of these galaxies could add many useful points to the diagram. In particular, the 13 extra core-Sérsic elliptical galaxies would allow one to better explore the diagram in the high- end, between and , where most galaxies are thought to have formed from a different process, namely dry major mergers. Similarly, there are an additional 10 Sérsic bulges of disc galaxies with that could extend the low- end of the correlation.
The Sérsic index is a slight function of the observational bandpass. This dependency of galaxy structural parameters with wavelength arises due to radial gradients in the stellar population gradients and/or dust obscuration (Kelvin et al., 2012). We therefore plan to perform accurate galaxy image decompositions for all the galaxies belonging to the sample of Graham & Scott (2013) – with a directly measured SMBH mass – to explore the relation and other black hole mass scaling relations in a homogeneous analysis (same observational bandpass and same light profile decomposition method).
Finally, we compare the results from this work with those from Graham & Driver (2007a), highlighting two main points. First, and similar to our sample, the galaxy sample used by Graham & Driver (2007a) was dominated (80%) by disc galaxies in the low-mass end () and by elliptical galaxies (80%) in the high-mass end (). Second, Graham & Driver (2007a) measured a Sérsic index greater than 10 for three spheroids with , which are absent in Figure 4b. Combining the different galaxy types and fitting a single relation, it is easy to understand why a quadratic relation would be more appropriate than a single log-linear relation to describe their data. At (), their quadratic relation has a slope of , similar to that observed for our Sérsic bulges.
5 Summary and Conclusions
The relation (Graham & Driver, 2007a) is important for any complete theory or model to describe the coevolution of galaxies and SMBHs. It also provides a means to estimate black hole masses in galaxies and may prove fruitful for recent and future deep, wide-field photometric surveys of galaxies which can statistically estimate the black hole masses in a large sample of galaxies up to . The main motivation of this work was to re-investigate the relation, given a recent spate of papers which did not detect it. We have gone beyond the simple recovery of the relation, and explored potential substructures in this diagram in terms of distinct relations for Sérsic and core-Sérsic galaxies, and for bulges and elliptical galaxies.
We compiled a large collection of literature Sérsic index measurements
(Graham & Driver, 2007a; Sani et al., 2011; Vika et al., 2012; Beifiori et al., 2012) for a sample of 62 galaxies
with directly measured SMBH masses.
We compared multiple Sérsic index measurements
which existed for 35 galaxies,
and found relative
differences greater than 50% in many instances.
This is more than expected from a systematic bias produced by different types of light
profile modelling (1D or 2D) or different observational bandpasses.
We therefore excluded the outlying Sérsic indices and averaged the remaining values.
This exclusion resulted in the removal of 8 galaxies.
Our final sample therefore consists of 54 galaxies: among them, 27 had Sérsic indices measured only by one study
and the remaining 27 have an averaged Sérsic index measurement.
Our principal conclusions are:
-
1.
The diagram (Figure 4) displays an appreciable correlation.
- 2.
-
3.
If Sérsic bulges and Sérsic elliptical galaxies follow the same relation, then an order of magnitude gap is expected between the SMBH masses of Sérsic elliptical galaxies and the Sérsic bulges of disc galaxies having the same .
A wider range of Sérsic indices would be beneficial to put tighter constraints on the observed slopes of the correlations. The catalog of 80 directly measured supermassive black hole masses compiled by Graham & Scott (2013) allows one to explore the diagram in the low- and hig-mass end. We recognize the need for a well calibrated relation and plan to perform accurate galaxy light profile decompositions to refine the black hole mass scaling relations.
Acknowledgments
GS thanks Dr. Nicholas Scott for useful discussions. This research was supported by Australian Research Council funding through grants DP110103509 and FT110100263. AM, LKH, ES acknowledge support from grants PRIN-MIUR 2010-2011 “The dark Universe and the cosmic evolution of baryons: from current surveys to Euclid” and PRIN-INAF 2011 “Black hole growth and AGN feedback through the cosmic time”. This research has made use of the GOLDMine database (Gavazzi et al., 2003) and the NASA/IPAC Extragalactic Database (NED) which is operated by the Jet Propulsion Laboratory, California Institute of Technology, under contract with the National Aeronautics and Space Administration.
References
- Abazajian et al. (2009) Abazajian, K. N., Adelman-McCarthy, J. K., Agüeros, M. A., et al. 2009, ApJS, 182, 543
- Akritas & Bershady (1996) Akritas, M. G., & Bershady, M. A. 1996, ApJ, 470, 706
- Allen et al. (2006) Allen, P. D., Driver, S. P., Graham, A. W., et al. 2006, MNRAS, 371, 2
- Andredakis et al. (1995) Andredakis, Y. C., Peletier, R. F., & Balcells, M. 1995, MNRAS, 275, 874
- Beifiori et al. (2012) Beifiori, A., Courteau, S., Corsini, E. M., & Zhu, Y. 2012, MNRAS, 419, 2497
- Berrier et al. (2013) Berrier, J. C., Davis, B. L., Kennefick, D., et al. 2013, ApJ, 769, 132
- Caon et al. (1993) Caon, N., Capaccioli, M., & D’Onofrio, M. 1993, MNRAS, 265, 1013
- de Vaucouleurs et al. (1991) de Vaucouleurs, G., de Vaucouleurs, A., Corwin, H. G., Jr., et al. 1991, Third Reference Catalogue of Bright Galaxies.
- Davis et al. (2013) Davis, B. L., Berrier, J. C., Shields, D. W., Kennefick, J., Kennefick, D., Seigar, M. S., Lacy, C. H. S., & Puerari, I. 2013, ApJS, 199, 33
- Driver et al. (2011) Driver, S. P., Hill, D. T., Kelvin, L. S., et al. 2011, MNRAS, 413, 971
- Erwin et al. (2004) Erwin, P., Graham, A. W., & Caon, N. 2004, Coevolution of Black Holes and Galaxies,
- Ferrarese & Merritt (2000) Ferrarese, L., & Merritt, D. 2000, ApJ, 539, L9
- Ferrarese et al. (2006a) Ferrarese, L., Côté, P., Jordán, A., et al. 2006, ApJS, 164, 334
- Ferrari et al. (2004) Ferrari, F., Dottori, H., Caon, N., Nobrega, A., & Pavani, D. B. 2004, MNRAS, 347, 824
- Freeman (1970) Freeman, K. C. 1970, ApJ, 160, 811
- Gadotti (2008) Gadotti, D. A. 2008, MNRAS, 384, 420
- Gavazzi et al. (2003) Gavazzi, G., Boselli, A., Donati, A., Franzetti, P., & Scodeggio, M. 2003, A&A, 400, 451
- Gavazzi et al. (2005) Gavazzi, G., Donati, A., Cucciati, O., et al. 2005, A&A, 430, 411
- Gebhardt et al. (2000) Gebhardt, K., Bender, R., Bower, G., et al. 2000, ApJ, 539, L13
- Graham (2001) Graham, A. W. 2001, AJ, 121, 820
- Graham (2008) Graham, A. W. 2008, ApJ, 680, 143
- Graham (2012) Graham, A. W. 2012, ApJ, 746, 113
- Graham (2013) Graham, A. W. 2013, in Planets, Stars and Stellar Systems, Volume 6, p. 91-140, T. D. Oswalt & W. C. Keel (Eds.), Springer Publishing (arXiv:1108.0997)
- Graham & Driver (2005) Graham, A. W., & Driver, S. P. 2005, PASA, 22, 118
- Graham & Driver (2007a) Graham, A. W., & Driver, S. P. 2007a, ApJ, 655, 77
- Graham & Driver (2007b) Graham, A. W., & Driver, S. P. 2007b, MNRAS, 380, L15
- Graham et al. (2007) Graham, A. W., Driver, S. P., Allen, P. D., & Liske, J. 2007, MNRAS, 378, 198
- Graham et al. (2001) Graham, A. W., Erwin, P., Caon, N., & Trujillo, I. 2001, ApJ, 563, L11
- Graham et al. (2003) Graham, A. W., Erwin, P., Trujillo, I., & Asensio Ramos, A. 2003, AJ, 125, 2951
- Graham & Guzmán (2003) Graham, A. W., & Guzmán, R. 2003, AJ, 125, 2936
- Graham et al. (2011) Graham, A. W., Onken, C. A., Athanassoula, E., & Combes, F. 2011, MNRAS, 412, 2211
- Graham & Scott (2013) Graham, A. W., & Scott, N. 2013, ApJ, 764, 151
- Greene et al. (2008) Greene, J. E., Ho, L. C., & Barth, A. J. 2008, ApJ, 688, 159
- Häring & Rix (2004) Häring, N., & Rix, H.-W. 2004, ApJ, 604, L89
- Hunt et al. (2004) Hunt, L. K., Pierini, D., & Giovanardi, C. 2004, A&A, 414, 905
- Jerjen et al. (2000) Jerjen, H., Binggeli, B., & Freeman, K. C. 2000, AJ, 119, 593
- Kahaner et al. (1989) Kahaner, D., Moler, C., & Nash, S. 1989, Numerical Methods and Software (Englewood Cliffs: Prentice Hall)
- Kelly (2007) Kelly, B. C. 2007, ApJ, 665, 1489
- Kelvin et al. (2012) Kelvin, L. S., Driver, S. P., Robotham, A. S. G., et al. 2012, MNRAS, 421, 1007
- Kormendy & Richstone (1995) Kormendy, J., & Richstone, D. 1995, ARA&A, 33, 581
- Laor (2001) Laor, A. 2001, ApJ, 553, 677
- Lauer et al. (2007) Lauer, T. R., Tremaine, S., Richstone, D., & Faber, S. M. 2007, ApJ, 670, 249
- Lawrence et al. (2007) Lawrence, A., Warren, S. J., Almaini, O., et al. 2007, MNRAS, 379, 1599
- Magorrian et al. (1998) Magorrian, J., Tremaine, S., Richstone, D., et al. 1998, AJ, 115, 2285
- Marconi & Hunt (2003) Marconi, A., & Hunt, L. K. 2003, ApJ, 589, L21
- McLure & Dunlop (2002) McLure, R. J., & Dunlop, J. S. 2002, MNRAS, 331, 795
- Méndez-Abreu et al. (2008) Méndez-Abreu, J., Aguerri, J. A. L., Corsini, E. M., & Simonneau, E. 2008, A&A, 478, 353
- Pastrav et al. (2013) Pastrav, B. A., Popescu, C. C., Tuffs, R. J. & Sansom, A. E. 2013, arXiv:1301.5602
- Peng et al. (2002) Peng, C. Y., Ho, L. C., Impey, C. D., & Rix, H.-W. 2002, AJ, 124, 266
- Peng et al. (2010) Peng, C. Y., Ho, L. C., Impey, C. D., & Rix, H.-W. 2010, AJ, 139, 2097
- Sani et al. (2011) Sani, E., Marconi, A., Hunt, L. K., & Risaliti, G. 2011, MNRAS, 413, 1479
- Sérsic (1963) Sérsic, J.-L. 1963, Boletin de la Asociacion Argentina de Astronomia, 6, 41
- Sérsic (1968) Sérsic, J.-L. 1968, Atlas de Galaxias Australes (Cordoba: Observatorio Astronomico)
- Scott et al. (2013) Scott, N., Graham, A. W., & Schombert, J. 2013, ApJ, 768, 76
- Simard et al. (2002) Simard, L., Willmer, C. N. A., Vogt, N. P., et al. 2002, ApJS, 142, 1
- Simard et al. (2011) Simard, L., Mendel, J. T., Patton, D. R., Ellison, S. L., & McConnachie, A. W. 2011, ApJS, 196, 11
- Trujillo et al. (2004) Trujillo, I., Erwin, P., Asensio Ramos, A., & Graham, A. W. 2004, AJ, 127, 1917
- Vika et al. (2012) Vika, M., Driver, S. P., Cameron, E., Kelvin, L., & Robotham, A. 2012, MNRAS, 419, 2264
- York et al. (2000) York, D. G., Adelman, J., Anderson, J. E., Jr., et al. 2000, AJ, 120, 1579
- Young & Currie (1994) Young, C. K., & Currie, M. J. 1994, MNRAS, 268, L11
Appendix A
Section 2.4 illustrates the method we used to combine multiple Sérsic index measurements of the same galaxy. These came from four different studies among which only one (GD07) reported a strong relation.
To check the consistency and the robustness of our results, here we repeat the analysis excluding all the GD07 measurements. Figure 6a, which can be compared to Figure 4a, still displays a correlation, although it is more noisy at the high mass end (Spearman’s correlation coefficient , likelihood of the correlation occuring by chance ). Hence we conclude that the inclusion of the GD07 data did not force the recovery of the relation(s). However, the two galaxies previously identified as outliers in Figure 4b reduce the strength of the correlation in Figure 6b to a likelihood of the correlation occuring by chance to .
